| Param | Original file | Final file |
|---|---|---|
| Filename | modeM0/AS1T03_138T04_9000003180cztM0_level2.fits | modeM0/AS1T03_138T04_9000003180cztM0_level2_quad_clean.evt |
| Size (bytes) | 60,071,040 | 26,412,480 |
| Size | 57.3 MB | 25.2 MB |
| Events in quadrant A | 389,482 | 113,511 |
| Events in quadrant B | 368,512 | 113,998 |
| Events in quadrant C | 366,812 | 104,499 |
| Events in quadrant D | 324,232 | 95,680 |
| Mode M0 | |||
|---|---|---|---|
| Quadrant | BADHDUFLAG | Total packets | Discarded packets |
| A | 0 | 11410 | 0 |
| B | 0 | 11708 | 0 |
| C | 0 | 11639 | 0 |
| D | 0 | 12386 | 0 |
| Mode SS | |||
|---|---|---|---|
| Quadrant | BADHDUFLAG | Total packets | Discarded packets |
| A | 0 | 108 | 0 |
| B | 0 | 108 | 0 |
| C | 0 | 108 | 0 |
| D | 0 | 108 | 0 |
| Mode M9 | |||
|---|---|---|---|
| Quadrant | BADHDUFLAG | Total packets | Discarded packets |
| A | 0 | 15 | 0 |
| B | 0 | 15 | 0 |
| C | 0 | 15 | 0 |
| D | 0 | 15 | 0 |
| Quadrant | Total seconds | Saturated seconds | Saturation percentage |
|---|---|---|---|
| A | 5296 | 85 | 1.604985% |
| B | 5296 | 151 | 2.851208% |
| C | 5296 | 121 | 2.284743% |
| D | 5296 | 76 | 1.435045% |
Noise dominated data is calculated using 1-second bins in cleaned event files. If a bin has >2000 counts, and if more than 50% of those come from <1% of pixels, then it is considered to be noise-dominated and hence unusable.
| Quadrant | # 1 sec bins | Bins with >0 counts | Bins with >2000 counts | High rate bins dominated by noise | Noise dominated (total time) | Noise dominated (detector-on time) | Marked lightcurve |
|---|---|---|---|---|---|---|---|
| A | 6686 | 5296 | 0 | 0 | 0.00% | 0.00% |  |
| B | 6686 | 5296 | 0 | 0 | 0.00% | 0.00% | 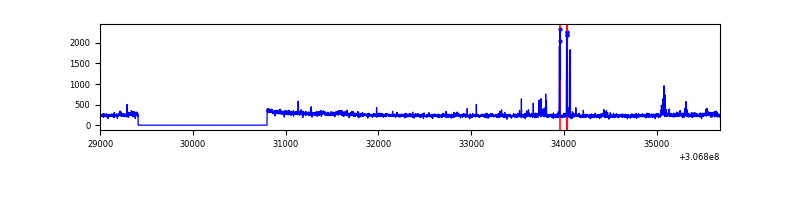 |
| C | 6686 | 5296 | 0 | 0 | 0.00% | 0.00% | 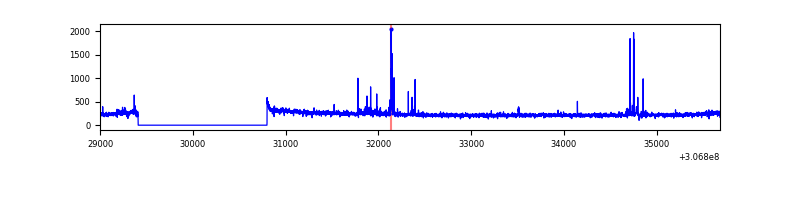 |
| D | 6686 | 5296 | 0 | 0 | 0.00% | 0.00% | 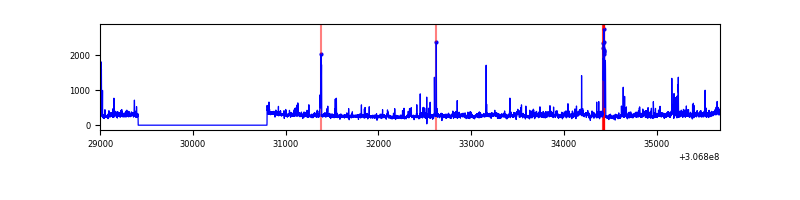 |
Top three noisy pixels from each quadrant. If the there are fewer than three noisy pixels in the level2.evt file, extra rows are filled as -1
| Pixel properties | Quadrant properties | ||||||
|---|---|---|---|---|---|---|---|
| Quadrant | DetID | PixID | Counts | Sigma | Mean | Median | Sigma |
| A | 0 | 29 | 343 | 9.45 | 101 | 96 | 26.1 |
| A | 7 | 110 | 292 | 7.5 | 101 | 96 | 26.1 |
| A | 15 | 47 | 272 | 6.73 | 101 | 96 | 26.1 |
| B | 2 | 9 | 273 | 8.74 | 97 | 94 | 20.5 |
| B | 5 | 255 | 252 | 7.71 | 97 | 94 | 20.5 |
| B | 3 | 17 | 246 | 7.42 | 97 | 94 | 20.5 |
| C | 1 | 81 | 287 | 7.53 | 96 | 91 | 26.0 |
| C | 1 | 80 | 271 | 6.92 | 96 | 91 | 26.0 |
| C | 1 | 65 | 259 | 6.45 | 96 | 91 | 26.0 |
| D | 7 | 3 | 239 | 6.13 | 92 | 85 | 25.1 |
| D | 15 | 46 | 229 | 5.74 | 92 | 85 | 25.1 |
| D | 10 | 113 | 225 | 5.58 | 92 | 85 | 25.1 |
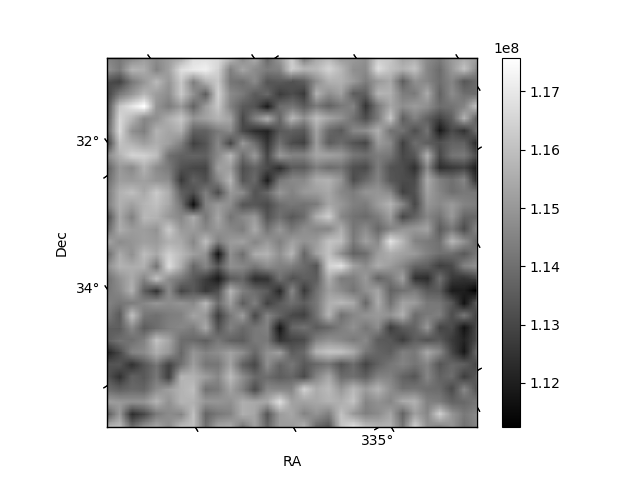
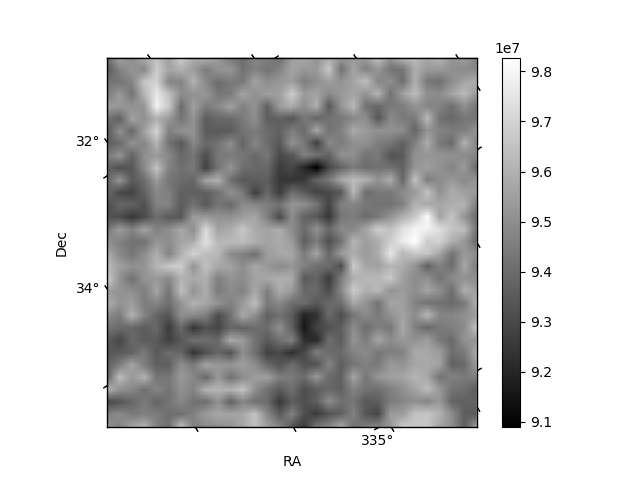
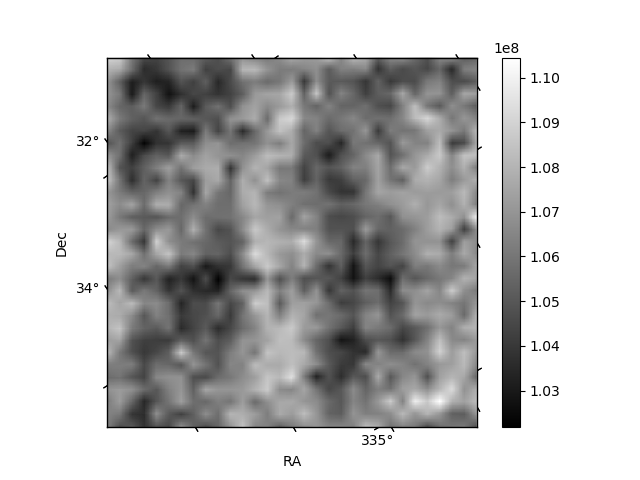
Histogram calculated using DETX and DETY for each event in the final _common_clean file
| Quadrant A |  |
 |
Quadrant B |
|---|---|---|---|
| Quadrant D |  |
 |
Quadrant C |
| Plot type | Count rate plots | Images |
|---|---|---|
| Comparison with Poisson distribution Blue bars denote a histogram of data divided into 1 sec bins. Red curve is a Poisson curve with rate = median count rate of data. |
 |
 |
| Quadrant-wise count rates Data is divided into 100 sec bins |
 |
|
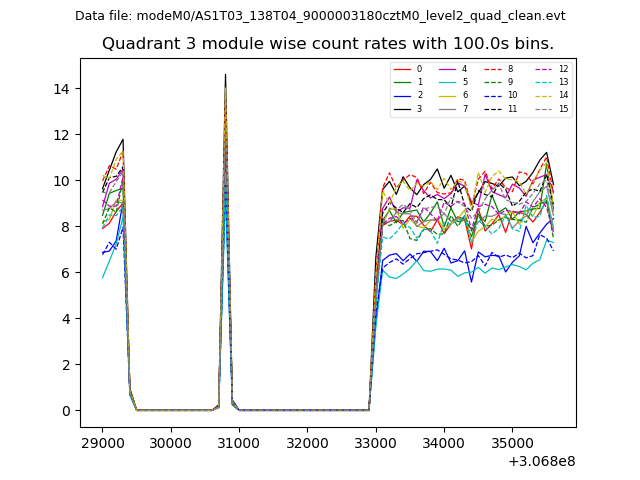
| Module-wise count rates for Quadrant A Data is divided into 100 sec bins |
 |
 |
| Module-wise count rates for Quadrant B Data is divided into 100 sec bins |
 |
 |
| Module-wise count rates for Quadrant C Data is divided into 100 sec bins |
 |
 |
| Module-wise count rates for Quadrant D Data is divided into 100 sec bins |
 |
 |
| Parameter | Plot |
|---|---|
| CZT HV Monitor |  |
| D_VDD |  |
| Temperature 1 |  |
| Veto HV Monitor |  |
| Veto LLD | 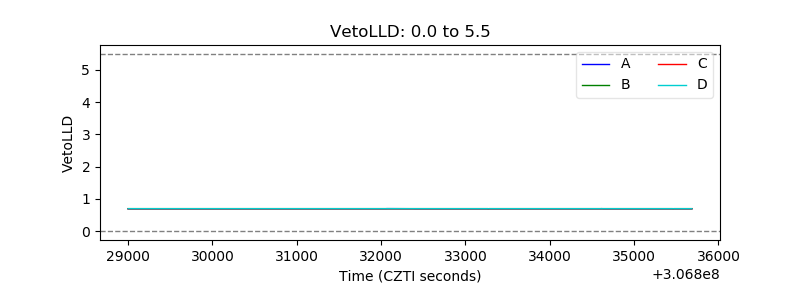 |
| Alpha Counter |  |
| _CPM_Rate |  |
| CZT Counter |  |
| +2.5 Volts monitor |  |
| +5 Volts monitor |  |
| _ROLL_ROT |  |
| _Roll_DEC |  |
| _Roll_RA |  |
| Veto Counter |  |