| Param | Original file | Final file |
|---|---|---|
| Filename | modeM0/AS1T03_138T04_9000003180_21538cztM0_level2.evt | modeM0/AS1T03_138T04_9000003180_21538cztM0_level2_quad_clean.evt |
| Size (bytes) | 140,696,640 | 15,264,000 |
| Size | 134.2 MB | 14.6 MB |
| Events in quadrant A | 1,017,120 | 84,334 |
| Events in quadrant B | 1,034,887 | 86,773 |
| Events in quadrant C | 1,045,444 | 81,479 |
| Events in quadrant D | 1,041,851 | 80,298 |
| Mode M0 | |||
|---|---|---|---|
| Quadrant | BADHDUFLAG | Total packets | Discarded packets |
| A | 0 | 4047 | 1 |
| B | 0 | 4127 | 1 |
| C | 0 | 4160 | 1 |
| D | 0 | 4181 | 1 |
| Mode SS | |||
|---|---|---|---|
| Quadrant | BADHDUFLAG | Total packets | Discarded packets |
| A | 0 | 36 | 0 |
| B | 0 | 36 | 0 |
| C | 0 | 36 | 0 |
| D | 0 | 36 | 0 |
| Mode M9 | |||
|---|---|---|---|
| Quadrant | BADHDUFLAG | Total packets | Discarded packets |
| A | 0 | 14 | 0 |
| B | 0 | 14 | 0 |
| C | 0 | 14 | 0 |
| D | 0 | 14 | 0 |
| Quadrant | Total seconds | Saturated seconds | Saturation percentage |
|---|---|---|---|
| A | 1758 | 39 | 2.218430% |
| B | 1758 | 67 | 3.811149% |
| C | 1758 | 61 | 3.469852% |
| D | 1758 | 26 | 1.478953% |
Noise dominated data is calculated using 1-second bins in cleaned event files. If a bin has >2000 counts, and if more than 50% of those come from <1% of pixels, then it is considered to be noise-dominated and hence unusable.
| Quadrant | # 1 sec bins | Bins with >0 counts | Bins with >2000 counts | High rate bins dominated by noise | Noise dominated (total time) | Noise dominated (detector-on time) | Marked lightcurve |
|---|---|---|---|---|---|---|---|
| A | 3148 | 1759 | 0 | 0 | 0.00% | 0.00% |  |
| B | 3148 | 1759 | 0 | 0 | 0.00% | 0.00% | 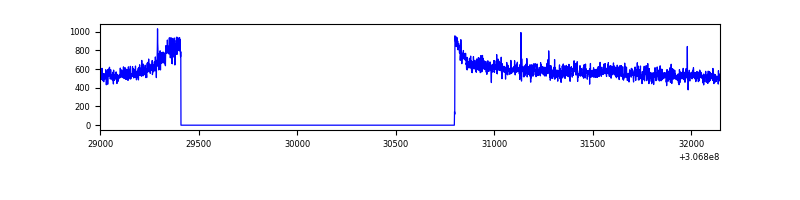 |
| C | 3148 | 1759 | 2 | 2 | 0.06% | 0.11% | 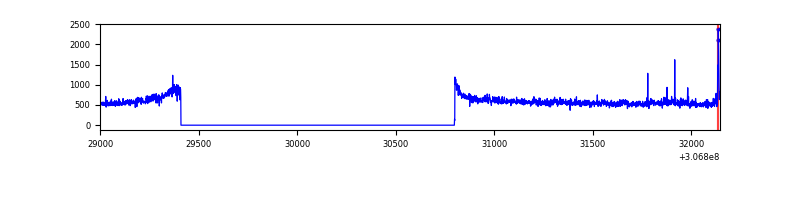 |
| D | 3148 | 1759 | 14 | 14 | 0.44% | 0.80% | 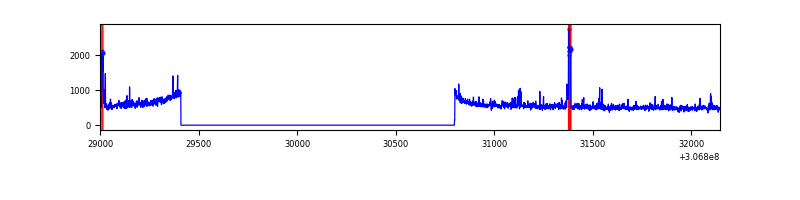 |
Top three noisy pixels from each quadrant. If the there are fewer than three noisy pixels in the level2.evt file, extra rows are filled as -1
| Pixel properties | Quadrant properties | ||||||
|---|---|---|---|---|---|---|---|
| Quadrant | DetID | PixID | Counts | Sigma | Mean | Median | Sigma |
| A | 13 | 254 | 2518 | 41.88 | 264 | 259 | 53.9 |
| A | 0 | 226 | 2226 | 36.46 | 264 | 259 | 53.9 |
| A | 3 | 137 | 2052 | 33.24 | 264 | 259 | 53.9 |
| B | 12 | 111 | 5916 | 111.42 | 262 | 257 | 50.8 |
| B | 0 | 229 | 5807 | 109.27 | 262 | 257 | 50.8 |
| B | 11 | 111 | 5027 | 93.92 | 262 | 257 | 50.8 |
| C | 14 | 238 | 39338 | 667.76 | 246 | 248 | 58.5 |
| C | 0 | 239 | 38487 | 653.22 | 246 | 248 | 58.5 |
| C | 4 | 175 | 2579 | 39.82 | 246 | 248 | 58.5 |
| D | 1 | 52 | 49022 | 788.66 | 249 | 241 | 61.9 |
| D | 14 | 35 | 32831 | 526.9 | 249 | 241 | 61.9 |
| D | 13 | 153 | 9261 | 145.83 | 249 | 241 | 61.9 |
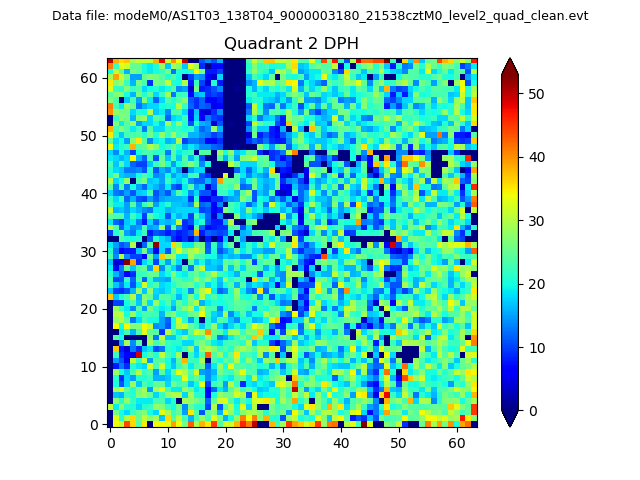
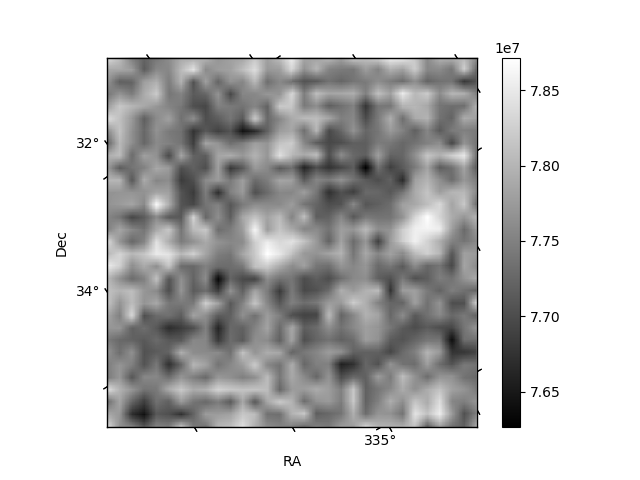
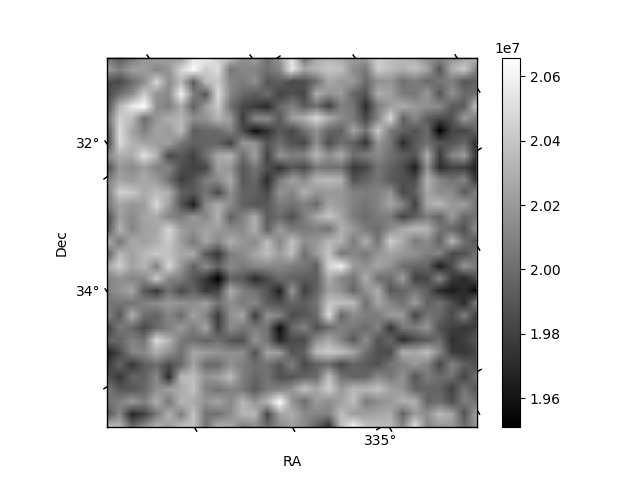
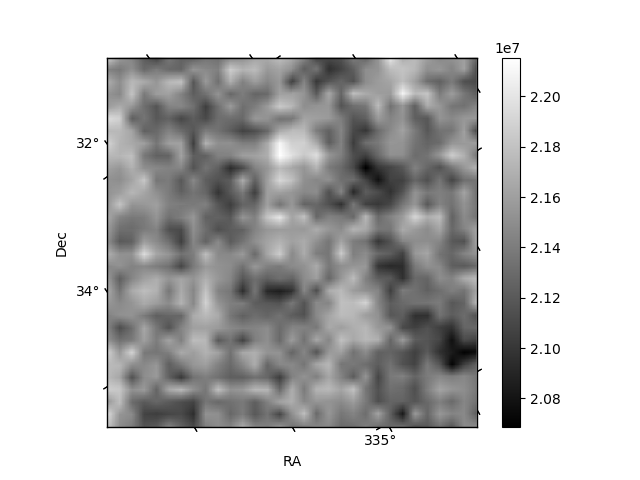
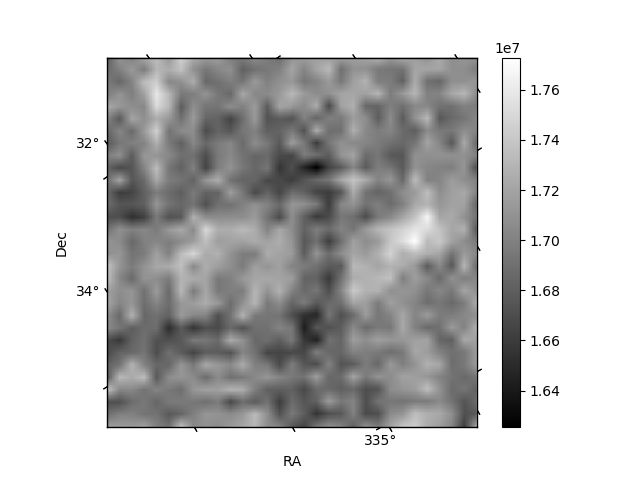
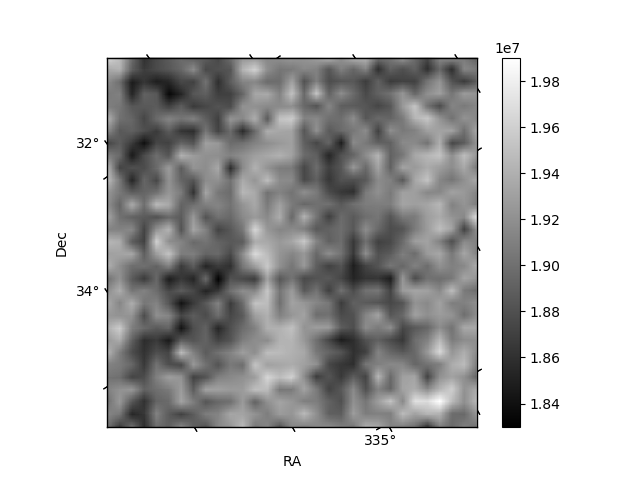
Histogram calculated using DETX and DETY for each event in the final _common_clean file
| Quadrant A | 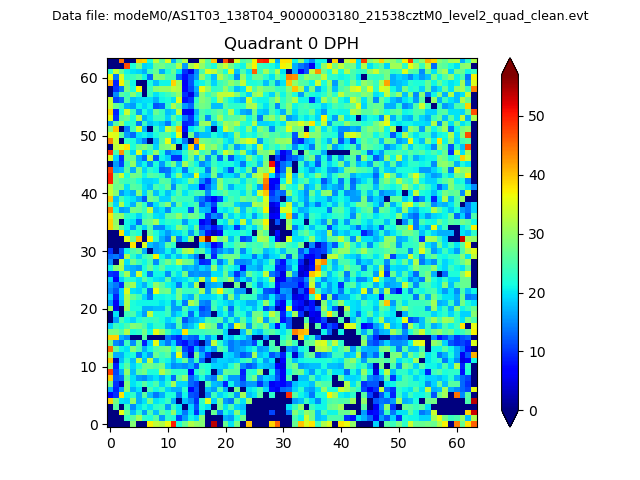 |
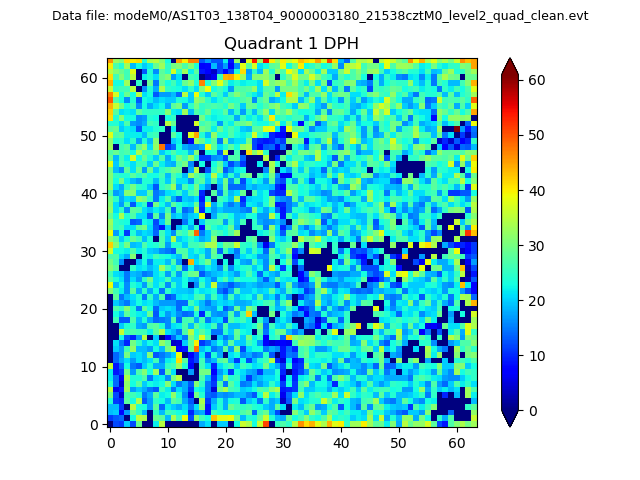 |
Quadrant B |
|---|---|---|---|
| Quadrant D | 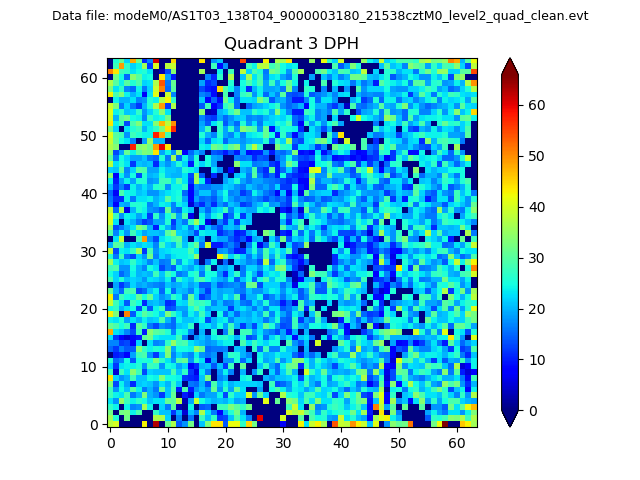 |
 |
Quadrant C |
| Plot type | Count rate plots | Images |
|---|---|---|
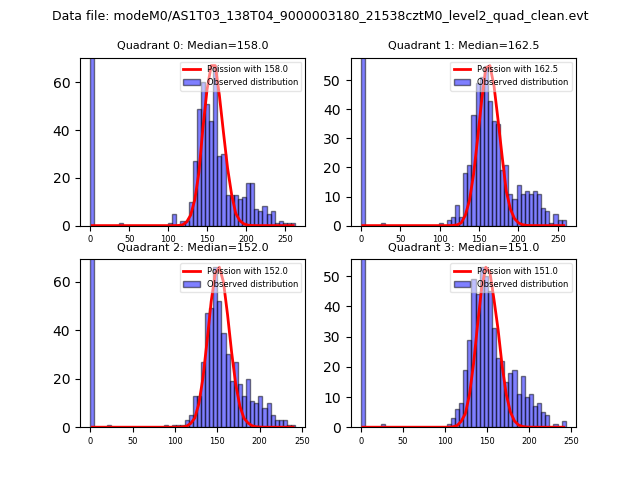
| Comparison with Poisson distribution Blue bars denote a histogram of data divided into 1 sec bins. Red curve is a Poisson curve with rate = median count rate of data. |
 |
 |
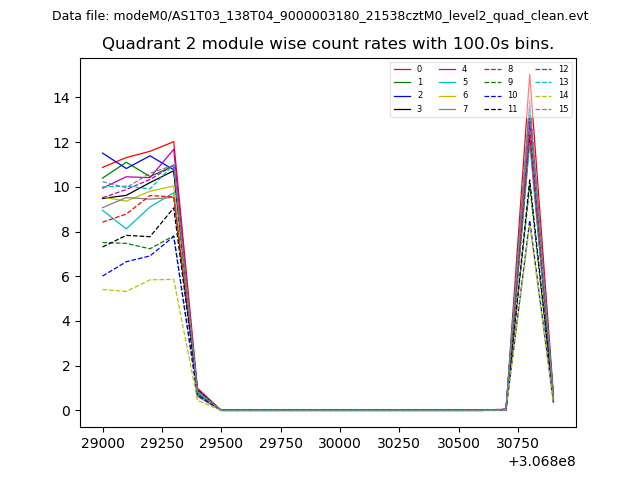
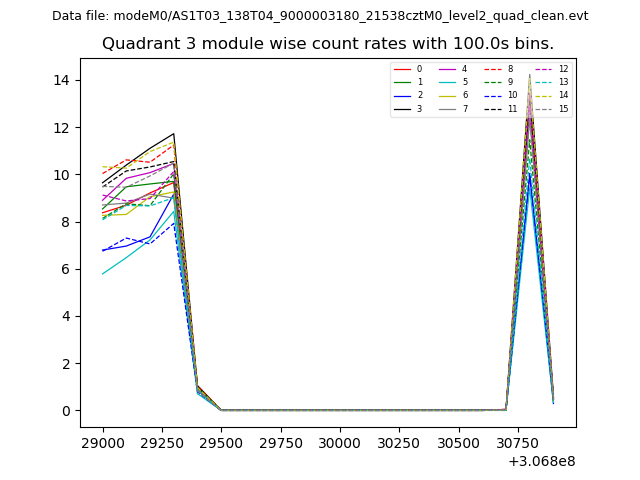
| Quadrant-wise count rates Data is divided into 100 sec bins |
 |
|
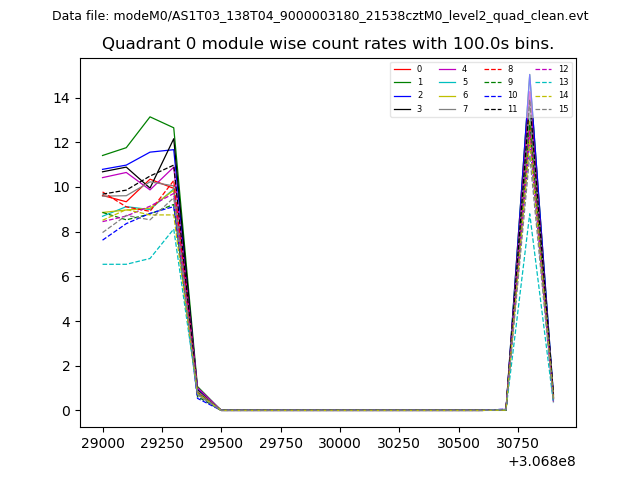
| Module-wise count rates for Quadrant A Data is divided into 100 sec bins |
 |
 |
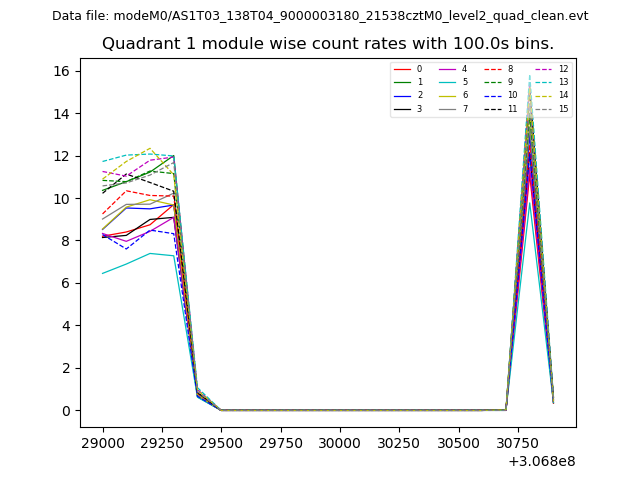
| Module-wise count rates for Quadrant B Data is divided into 100 sec bins |
 |
 |
| Module-wise count rates for Quadrant C Data is divided into 100 sec bins |
 |
 |
| Module-wise count rates for Quadrant D Data is divided into 100 sec bins |
 |
 |
| Parameter | Plot |
|---|---|
| CZT HV Monitor | 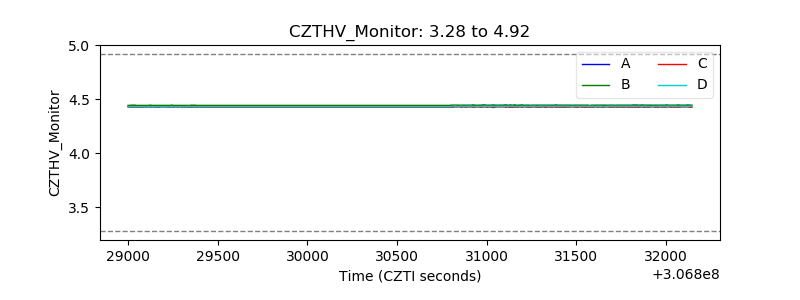 |
| D_VDD | 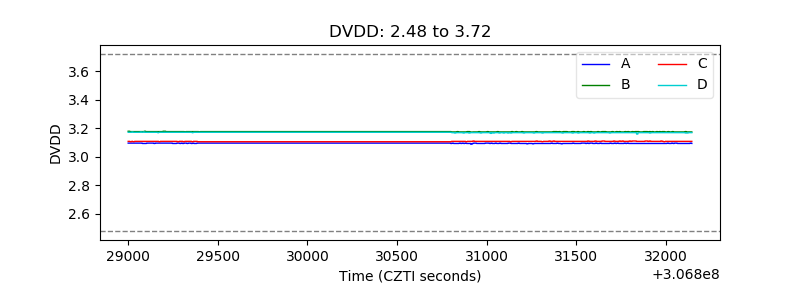 |
| Temperature 1 | 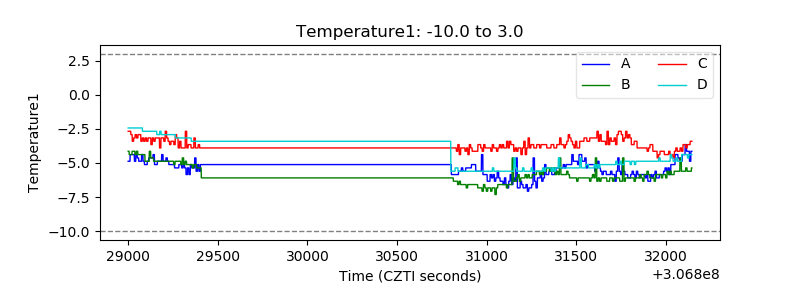 |
| Veto HV Monitor | 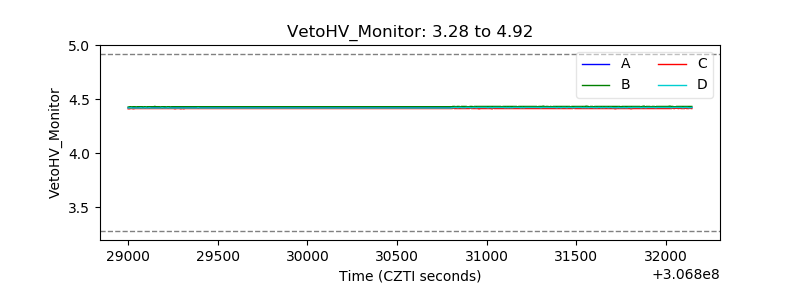 |
| Veto LLD | 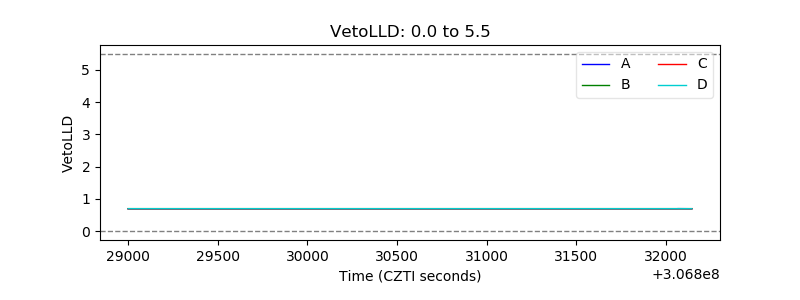 |
| Alpha Counter | 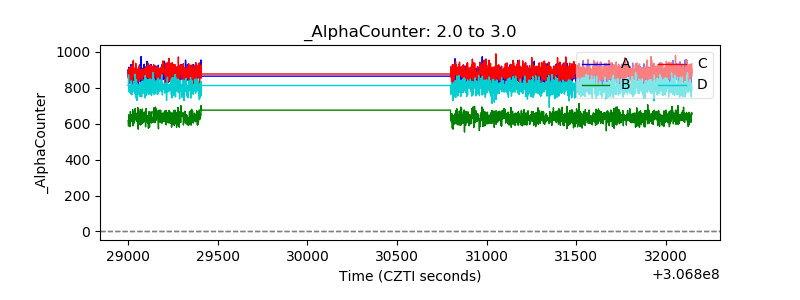 |
| _CPM_Rate | 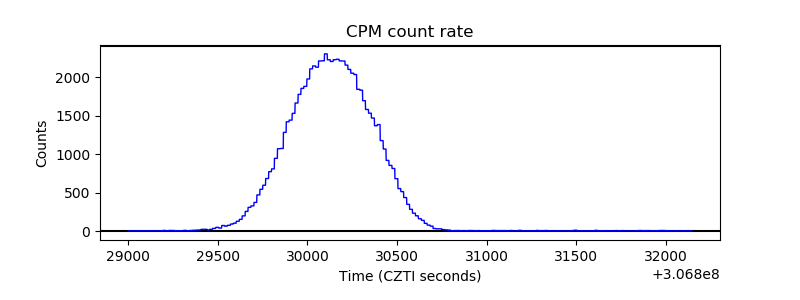 |
| CZT Counter | 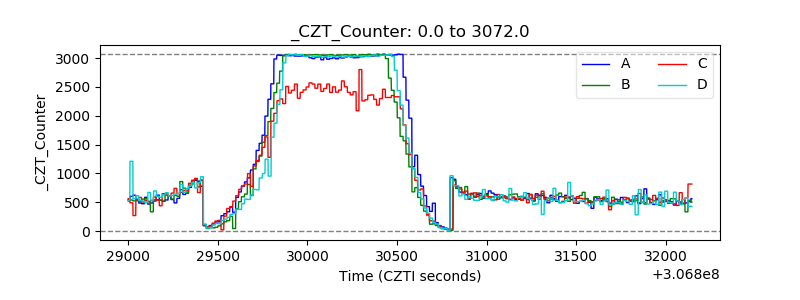 |
| +2.5 Volts monitor |  |
| +5 Volts monitor |  |
| _ROLL_ROT | 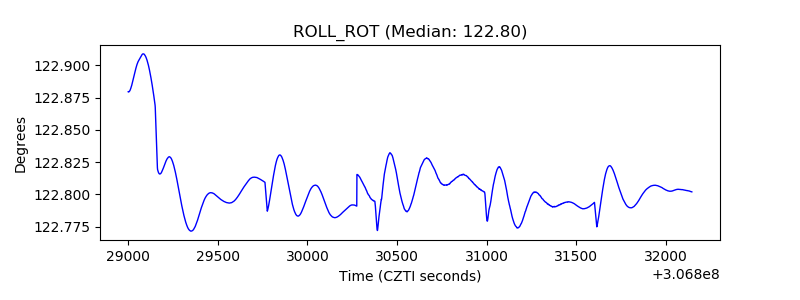 |
| _Roll_DEC | 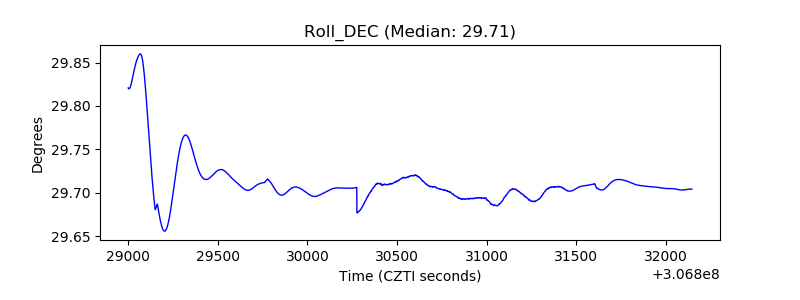 |
| _Roll_RA | 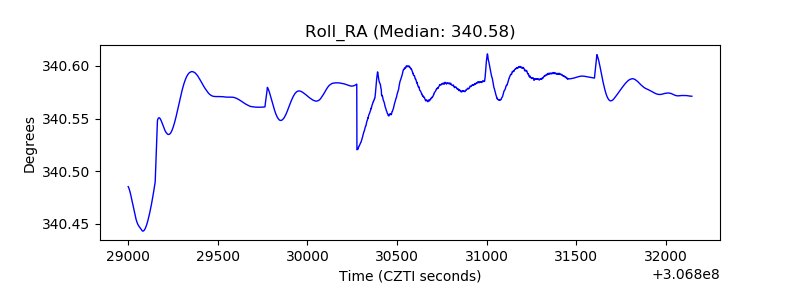 |
| Veto Counter | 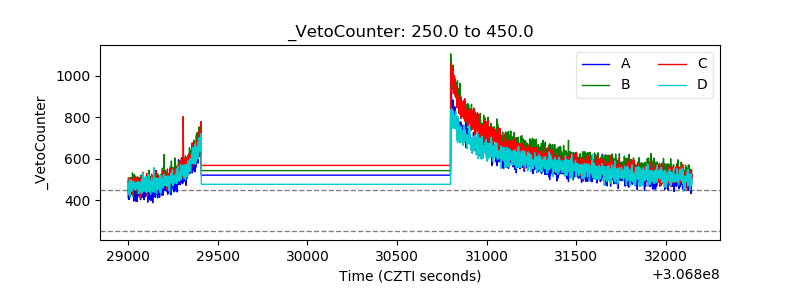 |