| Param | Original file | Final file |
|---|---|---|
| Filename | modeM0/AS1T03_138T04_9000003180_21539cztM0_level2.evt | modeM0/AS1T03_138T04_9000003180_21539cztM0_level2_quad_clean.evt |
| Size (bytes) | 364,371,840 | 64,103,040 |
| Size | 347.5 MB | 61.1 MB |
| Events in quadrant A | 2,587,113 | 412,670 |
| Events in quadrant B | 2,675,297 | 416,942 |
| Events in quadrant C | 2,631,185 | 388,258 |
| Events in quadrant D | 2,809,260 | 380,597 |
| Mode M0 | |||
|---|---|---|---|
| Quadrant | BADHDUFLAG | Total packets | Discarded packets |
| A | 0 | 10410 | 1 |
| B | 0 | 10697 | 1 |
| C | 0 | 10590 | 1 |
| D | 0 | 11252 | 1 |
| Mode SS | |||
|---|---|---|---|
| Quadrant | BADHDUFLAG | Total packets | Discarded packets |
| A | 0 | 98 | 0 |
| B | 0 | 98 | 0 |
| C | 0 | 98 | 0 |
| D | 0 | 98 | 0 |
| Mode M9 | |||
|---|---|---|---|
| Quadrant | BADHDUFLAG | Total packets | Discarded packets |
| A | 0 | 10 | 0 |
| B | 0 | 11 | 0 |
| C | 0 | 11 | 0 |
| D | 0 | 11 | 0 |
| Quadrant | Total seconds | Saturated seconds | Saturation percentage |
|---|---|---|---|
| A | 4885 | 50 | 1.023541% |
| B | 4885 | 95 | 1.944729% |
| C | 4885 | 73 | 1.494371% |
| D | 4885 | 57 | 1.166837% |
Noise dominated data is calculated using 1-second bins in cleaned event files. If a bin has >2000 counts, and if more than 50% of those come from <1% of pixels, then it is considered to be noise-dominated and hence unusable.
| Quadrant | # 1 sec bins | Bins with >0 counts | Bins with >2000 counts | High rate bins dominated by noise | Noise dominated (total time) | Noise dominated (detector-on time) | Marked lightcurve |
|---|---|---|---|---|---|---|---|
| A | 4885 | 4885 | 0 | 0 | 0.00% | 0.00% | 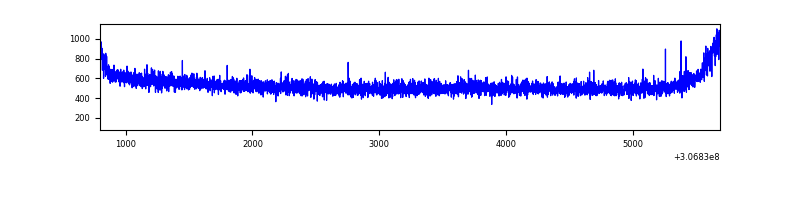 |
| B | 4885 | 4885 | 13 | 13 | 0.27% | 0.27% | 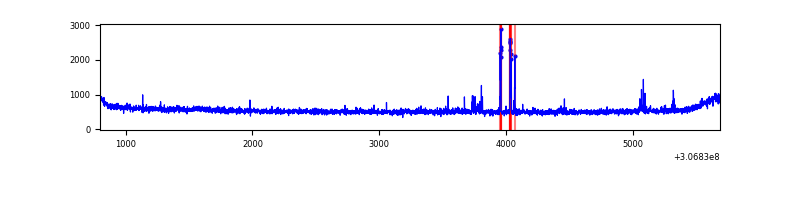 |
| C | 4885 | 4885 | 6 | 6 | 0.12% | 0.12% | 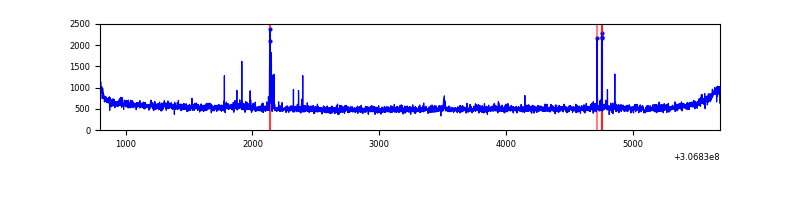 |
| D | 4885 | 4885 | 40 | 40 | 0.82% | 0.82% | 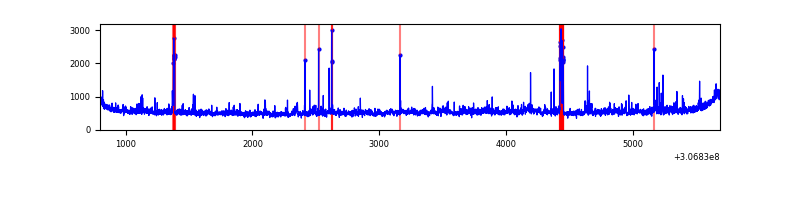 |
Top three noisy pixels from each quadrant. If the there are fewer than three noisy pixels in the level2.evt file, extra rows are filled as -1
| Pixel properties | Quadrant properties | ||||||
|---|---|---|---|---|---|---|---|
| Quadrant | DetID | PixID | Counts | Sigma | Mean | Median | Sigma |
| A | 13 | 254 | 7152 | 48.69 | 671 | 660 | 133.3 |
| A | 0 | 226 | 5868 | 39.06 | 671 | 660 | 133.3 |
| A | 3 | 137 | 5167 | 33.8 | 671 | 660 | 133.3 |
| B | 3 | 64 | 42131 | 330.85 | 665 | 651 | 125.4 |
| B | 0 | 230 | 20702 | 159.93 | 665 | 651 | 125.4 |
| B | 12 | 111 | 14617 | 111.4 | 665 | 651 | 125.4 |
| C | 14 | 238 | 101591 | 688.93 | 630 | 636 | 146.5 |
| C | 0 | 239 | 67267 | 454.7 | 630 | 636 | 146.5 |
| C | 13 | 61 | 4348 | 25.33 | 630 | 636 | 146.5 |
| D | 1 | 52 | 196728 | 1269.32 | 639 | 620 | 154.5 |
| D | 14 | 35 | 161103 | 1038.74 | 639 | 620 | 154.5 |
| D | 13 | 153 | 23512 | 148.17 | 639 | 620 | 154.5 |
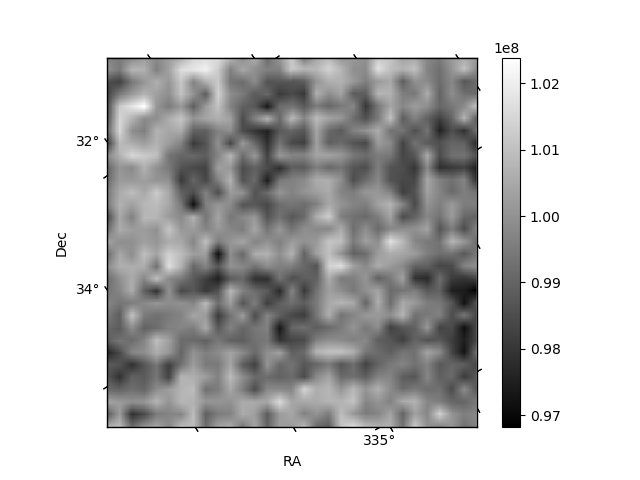
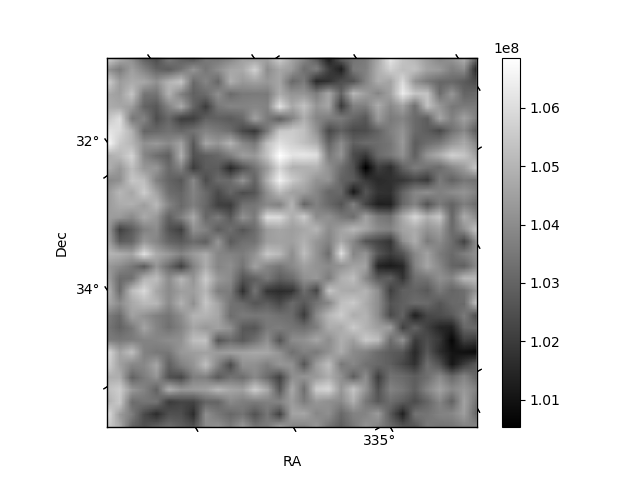
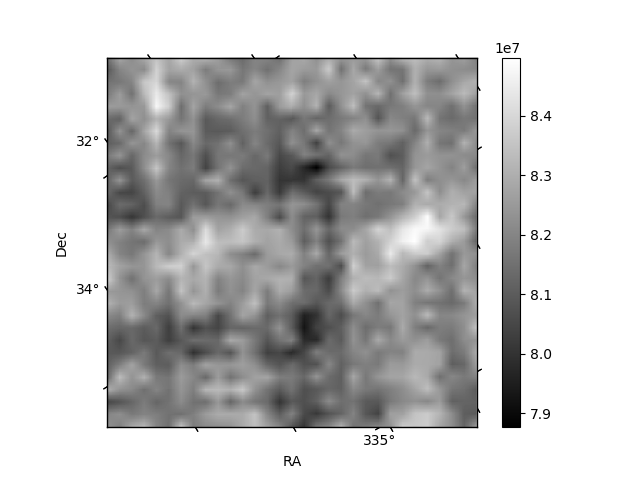
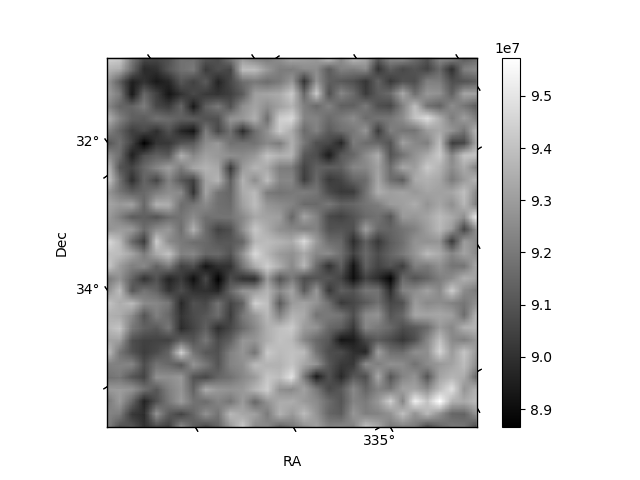
Histogram calculated using DETX and DETY for each event in the final _common_clean file
| Quadrant A | 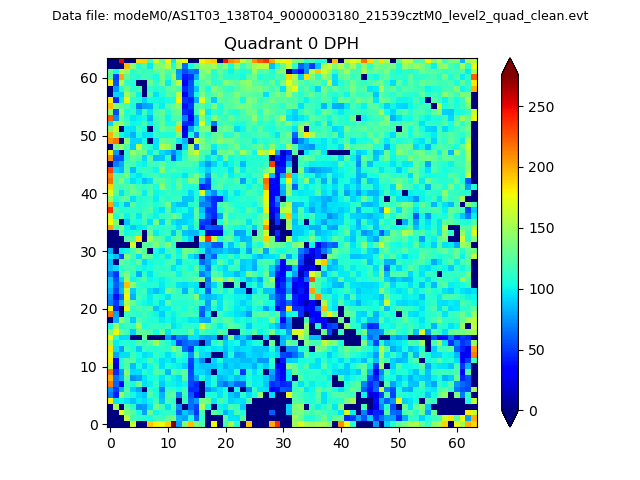 |
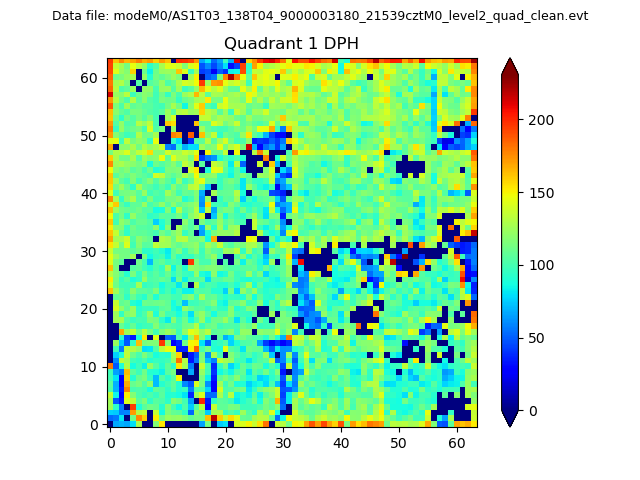 |
Quadrant B |
|---|---|---|---|
| Quadrant D | 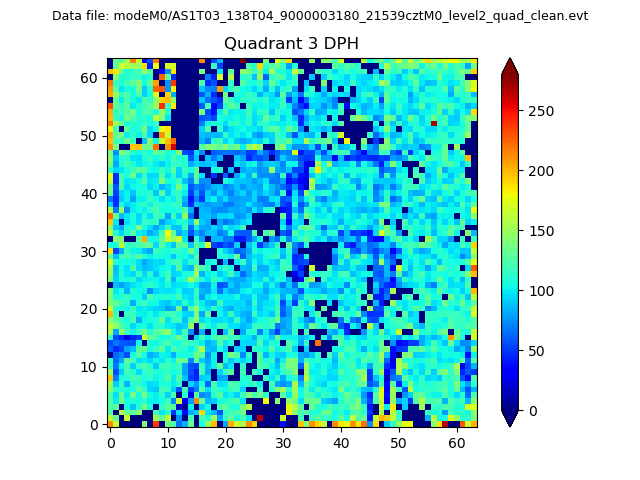 |
 |
Quadrant C |
| Plot type | Count rate plots | Images |
|---|---|---|
| Comparison with Poisson distribution Blue bars denote a histogram of data divided into 1 sec bins. Red curve is a Poisson curve with rate = median count rate of data. |
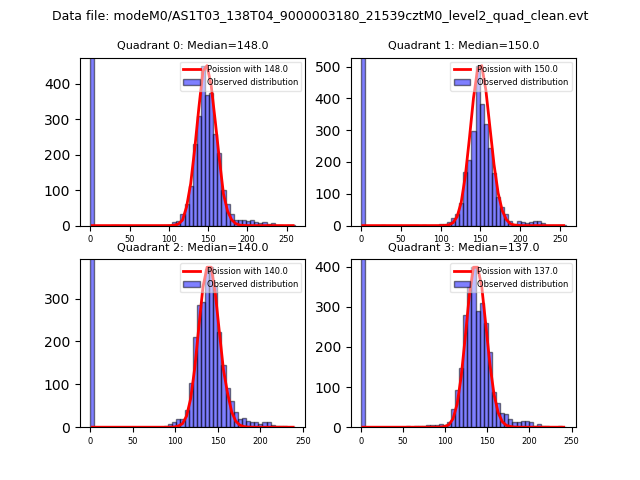 |
 |
| Quadrant-wise count rates Data is divided into 100 sec bins |
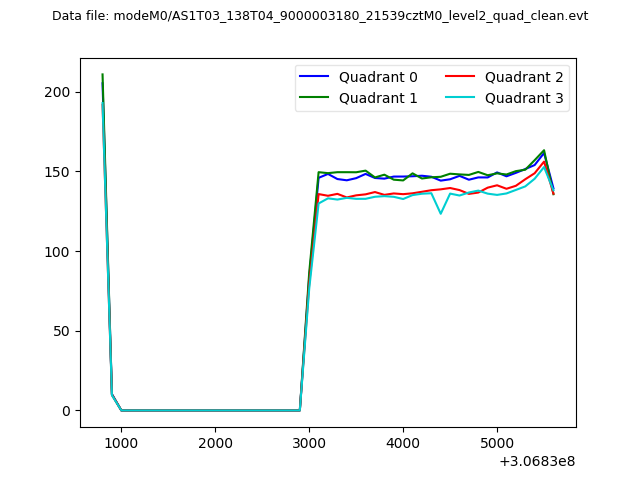 |
|
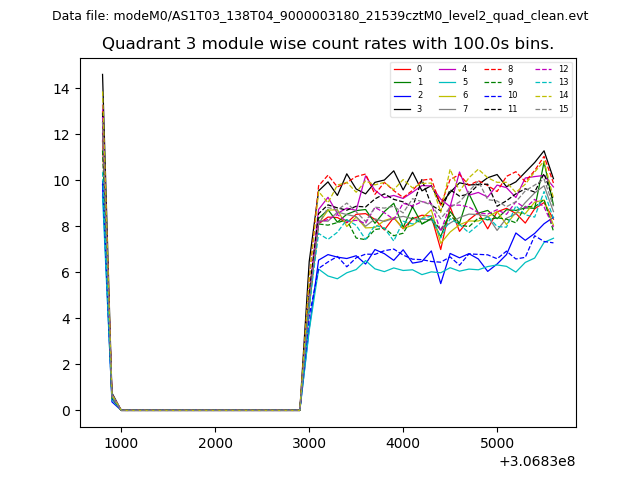
| Module-wise count rates for Quadrant A Data is divided into 100 sec bins |
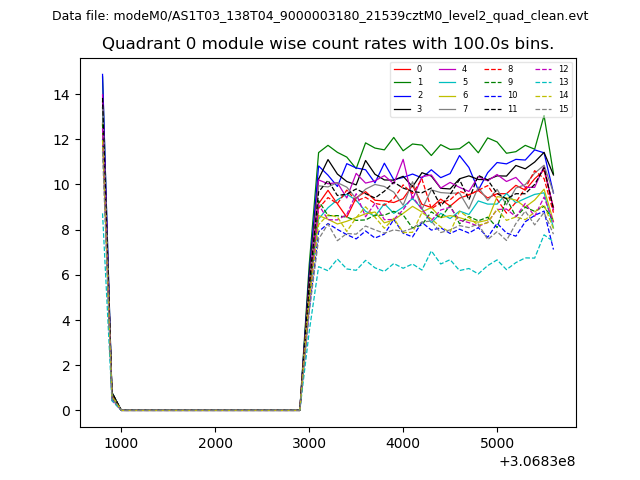 |
 |
| Module-wise count rates for Quadrant B Data is divided into 100 sec bins |
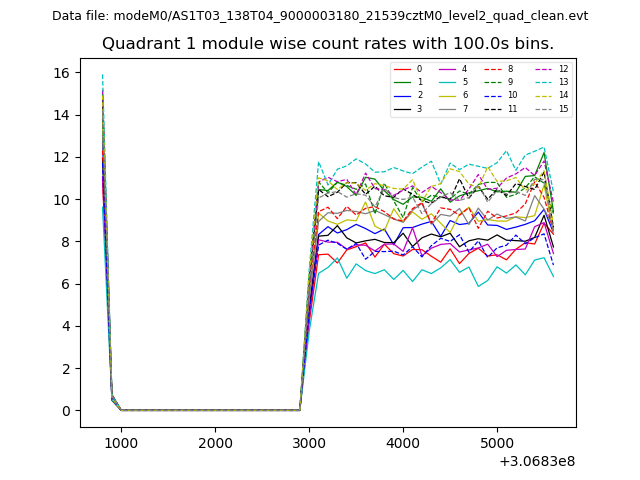 |
 |
| Module-wise count rates for Quadrant C Data is divided into 100 sec bins |
 |
 |
| Module-wise count rates for Quadrant D Data is divided into 100 sec bins |
 |
 |
| Parameter | Plot |
|---|---|
| CZT HV Monitor | 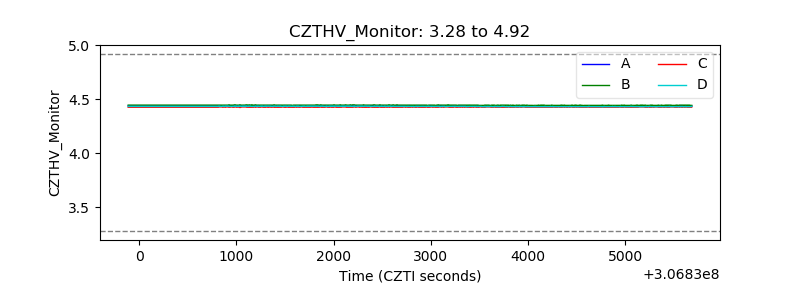 |
| D_VDD | 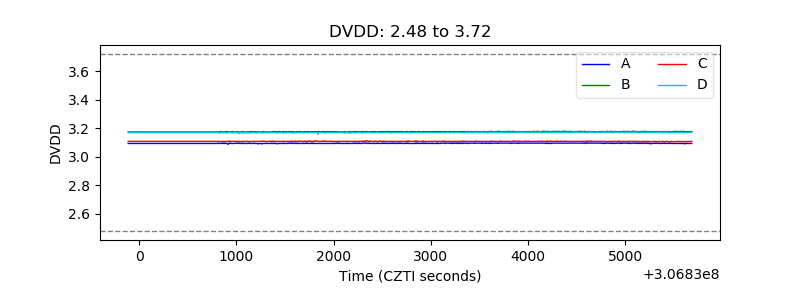 |
| Temperature 1 | 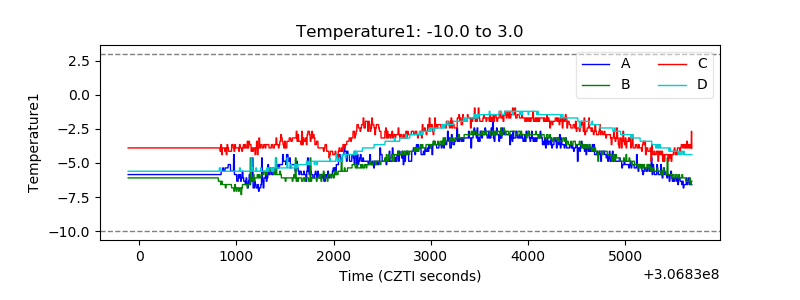 |
| Veto HV Monitor | 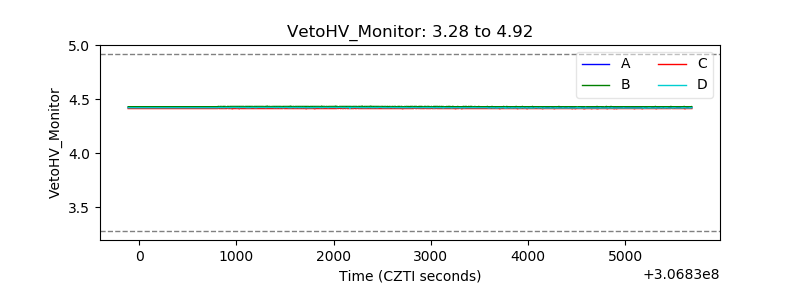 |
| Veto LLD | 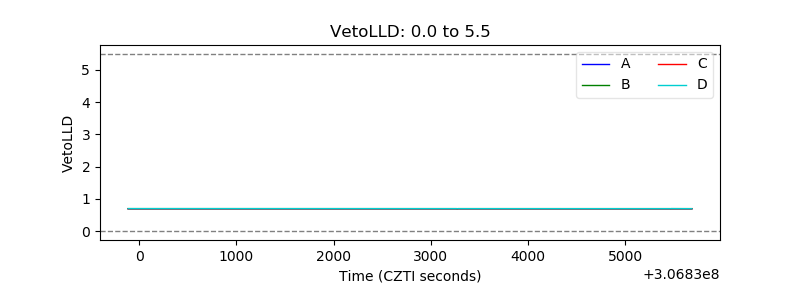 |
| Alpha Counter | 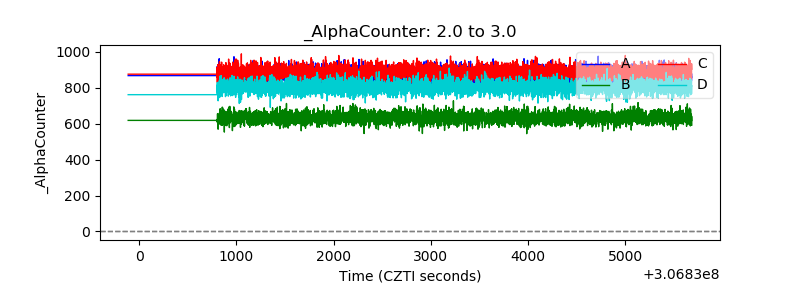 |
| _CPM_Rate | 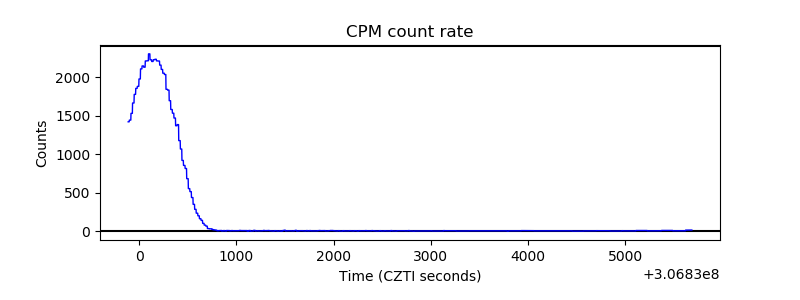 |
| CZT Counter |  |
| +2.5 Volts monitor |  |
| +5 Volts monitor | 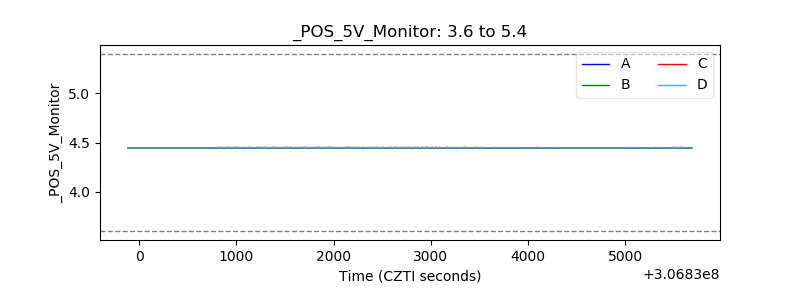 |
| _ROLL_ROT | 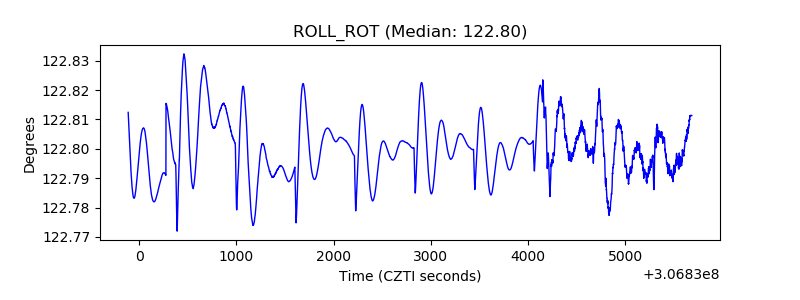 |
| _Roll_DEC | 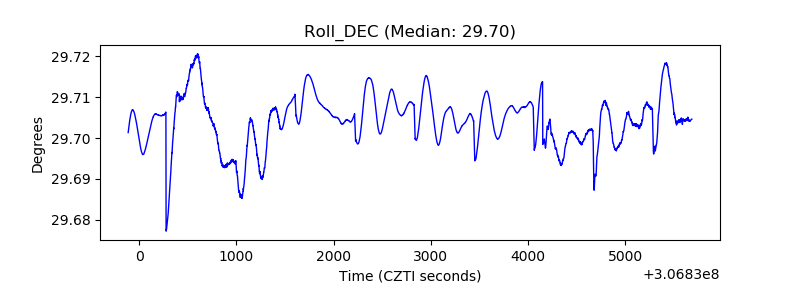 |
| _Roll_RA | 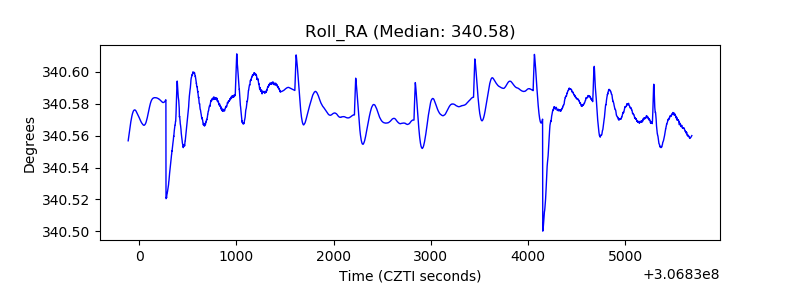 |
| Veto Counter | 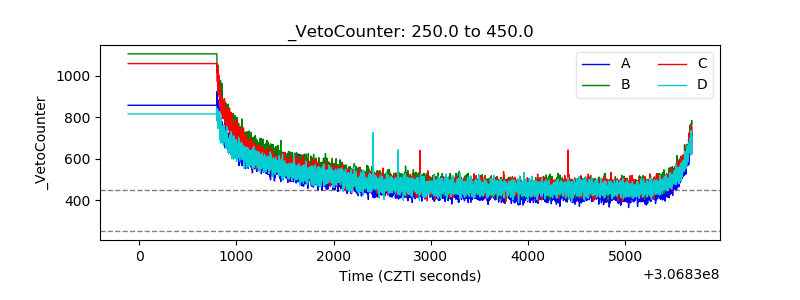 |