| Param | Original file | Final file |
|---|---|---|
| Filename | modeM0/AS1T03_138T05_9000003182cztM0_level2.fits | modeM0/AS1T03_138T05_9000003182cztM0_level2_quad_clean.evt |
| Size (bytes) | 51,744,960 | 43,652,160 |
| Size | 49.3 MB | 41.6 MB |
| Events in quadrant A | 342,628 | 297,490 |
| Events in quadrant B | 327,262 | 300,514 |
| Events in quadrant C | 326,242 | 277,397 |
| Events in quadrant D | 218,620 | 93,890 |
| Mode M0 | |||
|---|---|---|---|
| Quadrant | BADHDUFLAG | Total packets | Discarded packets |
| A | 0 | 10512 | 0 |
| B | 0 | 10509 | 0 |
| C | 0 | 10400 | 0 |
| D | 0 | 26066 | 0 |
| Mode SS | |||
|---|---|---|---|
| Quadrant | BADHDUFLAG | Total packets | Discarded packets |
| A | 0 | 100 | 0 |
| B | 0 | 100 | 0 |
| C | 0 | 100 | 0 |
| D | 0 | 100 | 0 |
| Mode M9 | |||
|---|---|---|---|
| Quadrant | BADHDUFLAG | Total packets | Discarded packets |
| A | 0 | 9 | 0 |
| B | 0 | 9 | 0 |
| C | 0 | 9 | 0 |
| D | 0 | 9 | 0 |
| Quadrant | Total seconds | Saturated seconds | Saturation percentage |
|---|---|---|---|
| A | 5018 | 8 | 0.159426% |
| B | 5018 | 20 | 0.398565% |
| C | 5018 | 25 | 0.498206% |
| D | 5018 | 1940 | 38.660821% |
Noise dominated data is calculated using 1-second bins in cleaned event files. If a bin has >2000 counts, and if more than 50% of those come from <1% of pixels, then it is considered to be noise-dominated and hence unusable.
| Quadrant | # 1 sec bins | Bins with >0 counts | Bins with >2000 counts | High rate bins dominated by noise | Noise dominated (total time) | Noise dominated (detector-on time) | Marked lightcurve |
|---|---|---|---|---|---|---|---|
| A | 5017 | 5017 | 0 | 0 | 0.00% | 0.00% | 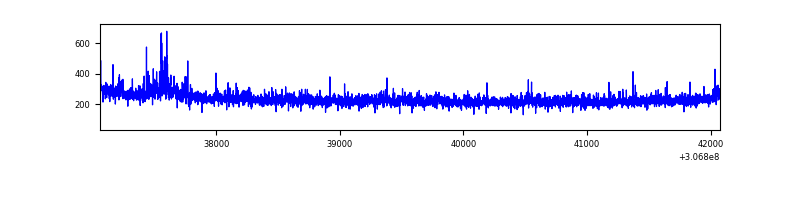 |
| B | 5017 | 5017 | 0 | 0 | 0.00% | 0.00% | 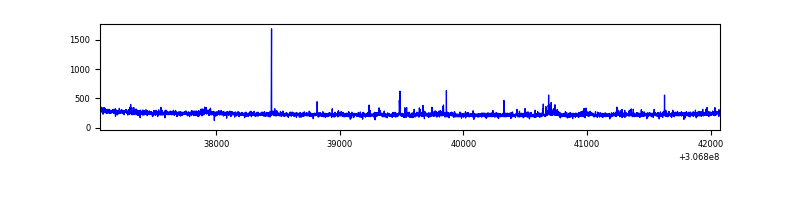 |
| C | 5017 | 5017 | 0 | 0 | 0.00% | 0.00% | 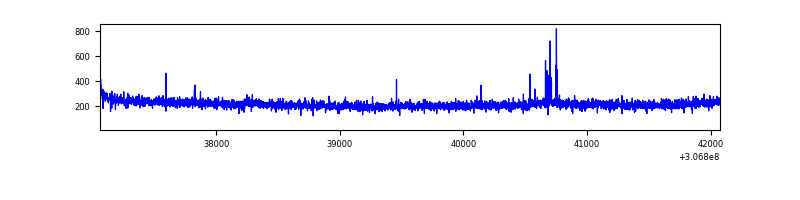 |
| D | 5017 | 4978 | 0 | 0 | 0.00% | 0.00% | 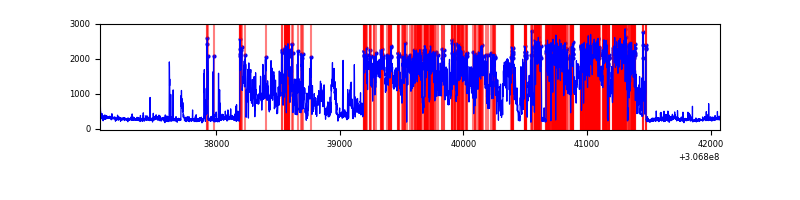 |
Top three noisy pixels from each quadrant. If the there are fewer than three noisy pixels in the level2.evt file, extra rows are filled as -1
| Pixel properties | Quadrant properties | ||||||
|---|---|---|---|---|---|---|---|
| Quadrant | DetID | PixID | Counts | Sigma | Mean | Median | Sigma |
| A | 0 | 29 | 315 | 9.71 | 89 | 84 | 23.8 |
| A | 7 | 110 | 265 | 7.61 | 89 | 84 | 23.8 |
| A | 9 | 19 | 261 | 7.44 | 89 | 84 | 23.8 |
| B | 2 | 9 | 246 | 8.46 | 86 | 83 | 19.3 |
| B | 5 | 225 | 219 | 7.06 | 86 | 83 | 19.3 |
| B | 5 | 255 | 214 | 6.8 | 86 | 83 | 19.3 |
| C | 3 | 126 | 253 | 7.23 | 86 | 81 | 23.8 |
| C | 1 | 80 | 250 | 7.1 | 86 | 81 | 23.8 |
| C | 1 | 81 | 248 | 7.02 | 86 | 81 | 23.8 |
| D | 6 | 231 | 177 | 6.74 | 62 | 57 | 17.8 |
| D | 6 | 67 | 163 | 5.95 | 62 | 57 | 17.8 |
| D | 6 | 83 | 162 | 5.9 | 62 | 57 | 17.8 |
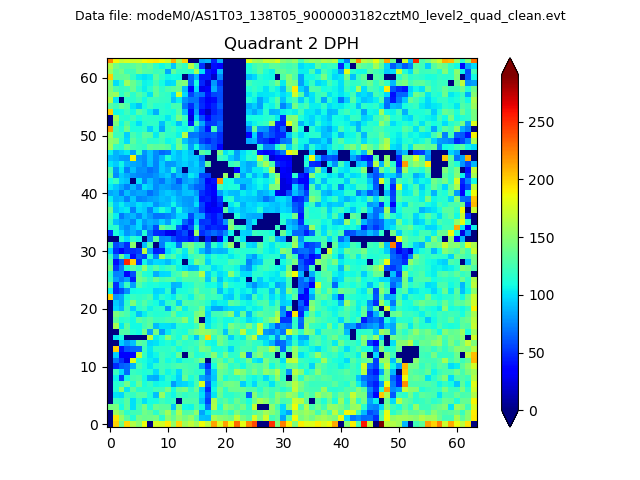
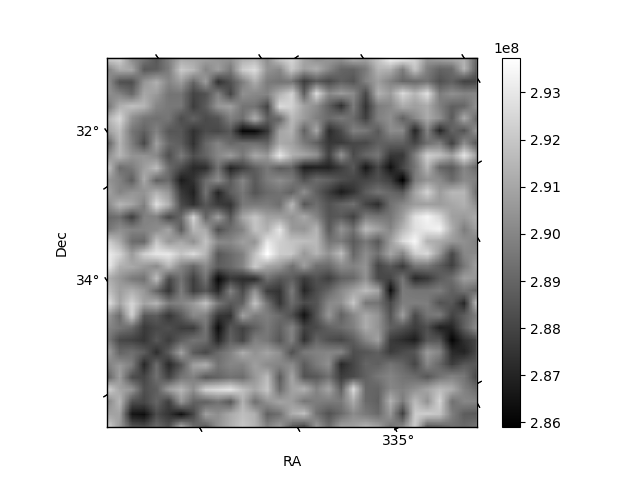
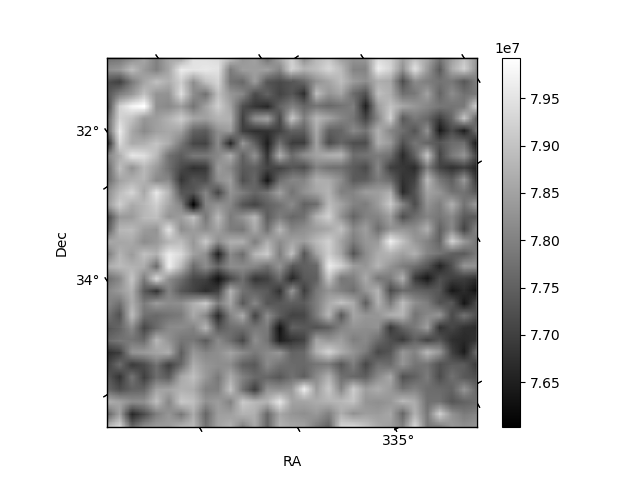
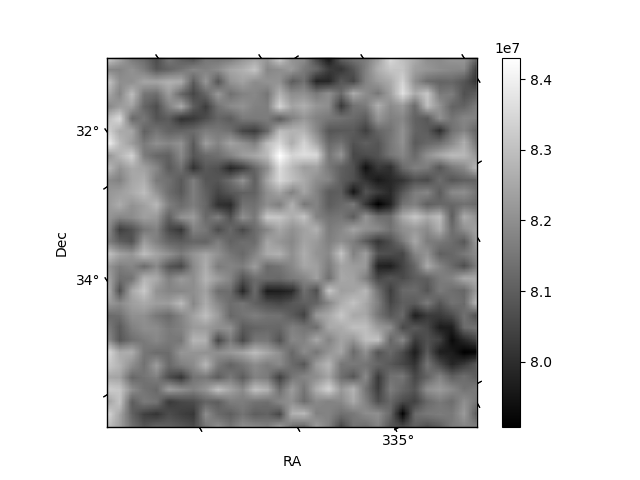
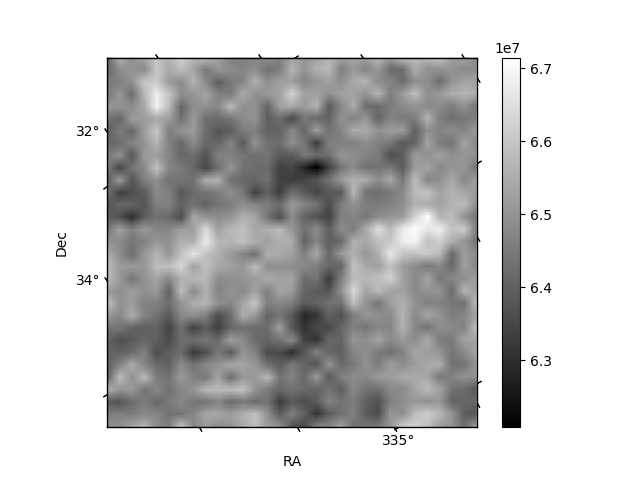
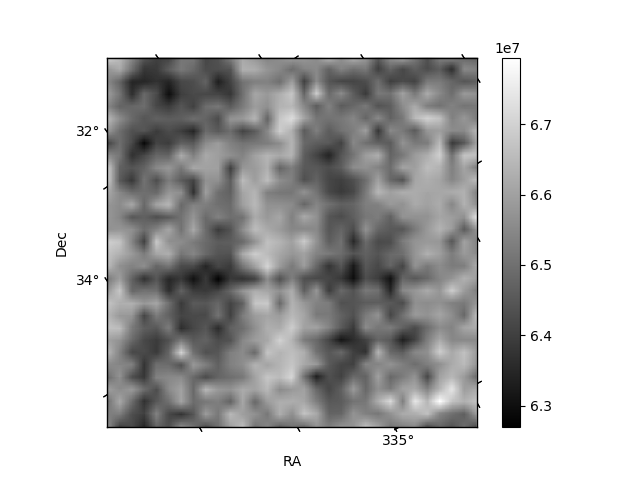
Histogram calculated using DETX and DETY for each event in the final _common_clean file
| Quadrant A | 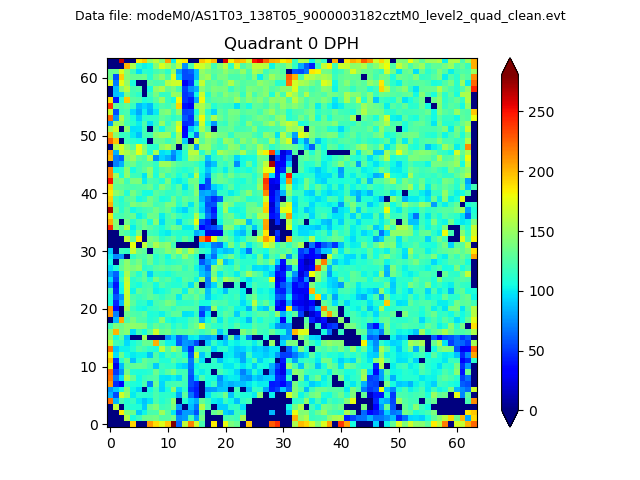 |
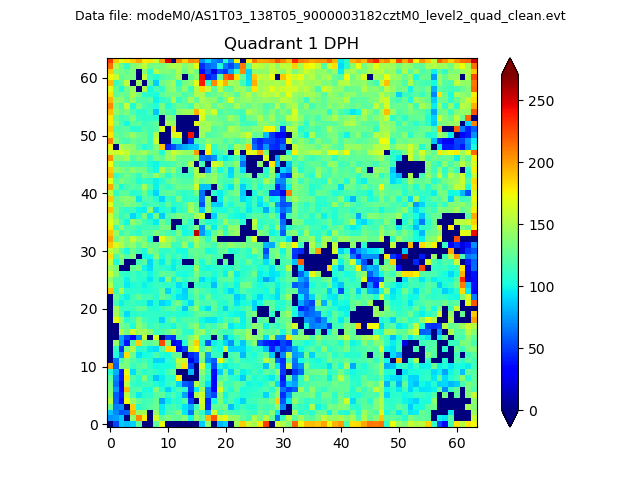 |
Quadrant B |
|---|---|---|---|
| Quadrant D | 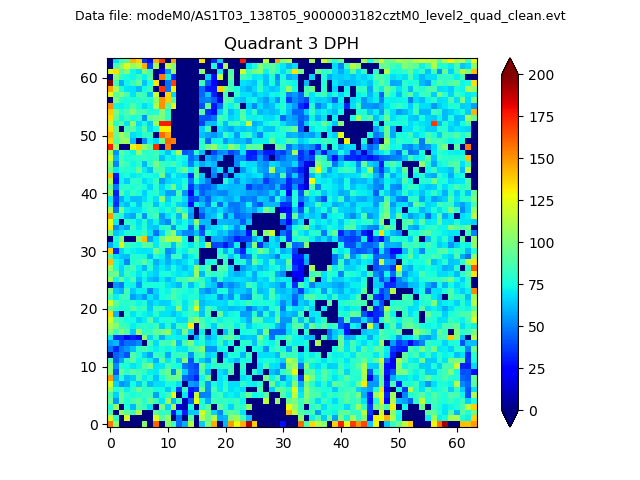 |
 |
Quadrant C |
| Plot type | Count rate plots | Images |
|---|---|---|
| Comparison with Poisson distribution Blue bars denote a histogram of data divided into 1 sec bins. Red curve is a Poisson curve with rate = median count rate of data. |
 |
 |
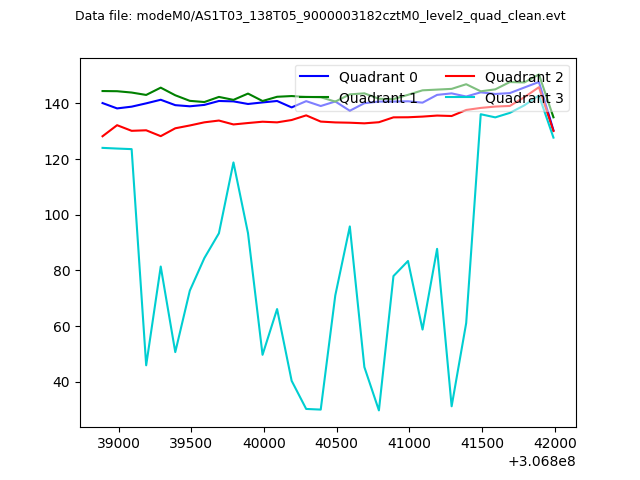
| Quadrant-wise count rates Data is divided into 100 sec bins |
 |
|
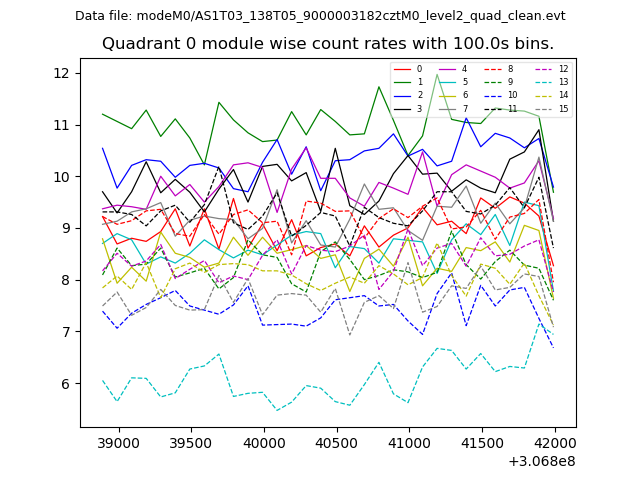
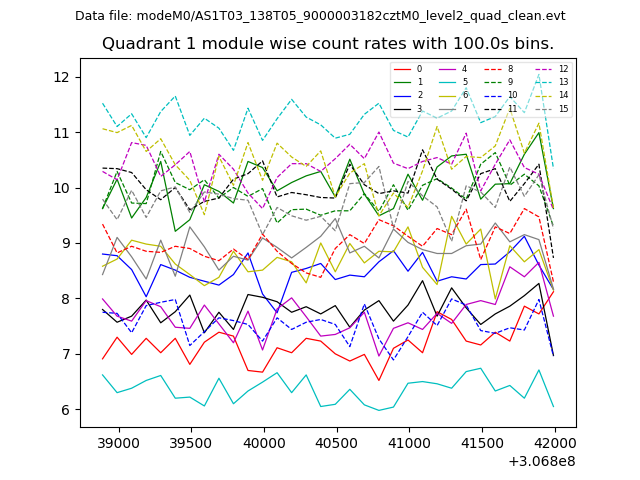
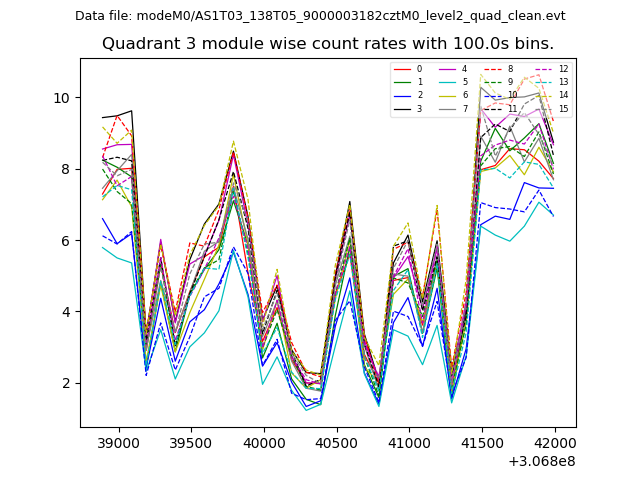
| Module-wise count rates for Quadrant A Data is divided into 100 sec bins |
 |
 |
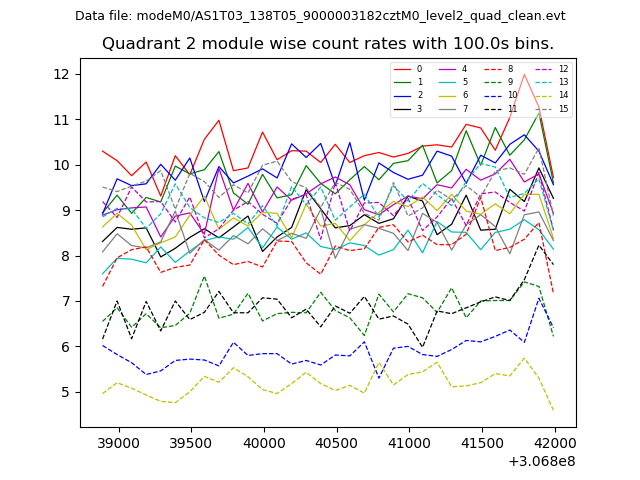
| Module-wise count rates for Quadrant B Data is divided into 100 sec bins |
 |
 |
| Module-wise count rates for Quadrant C Data is divided into 100 sec bins |
 |
 |
| Module-wise count rates for Quadrant D Data is divided into 100 sec bins |
 |
 |
| Parameter | Plot |
|---|---|
| CZT HV Monitor | 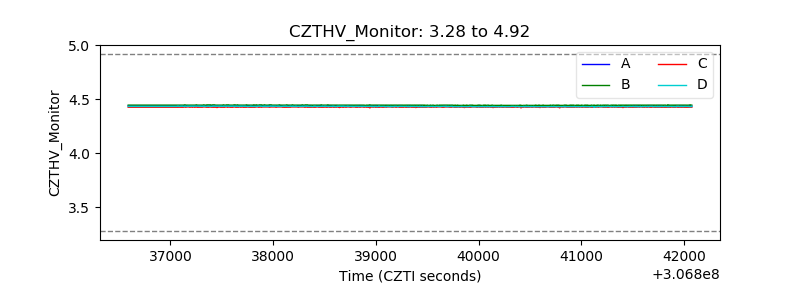 |
| D_VDD | 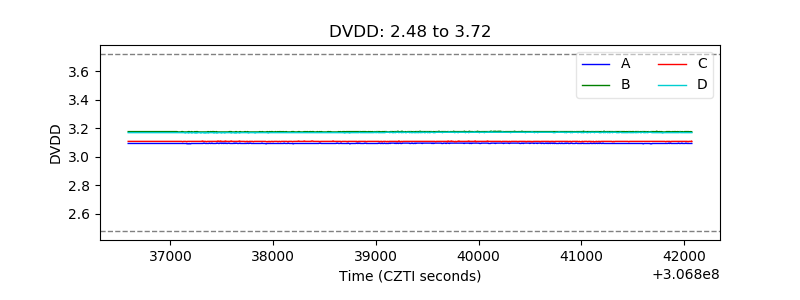 |
| Temperature 1 | 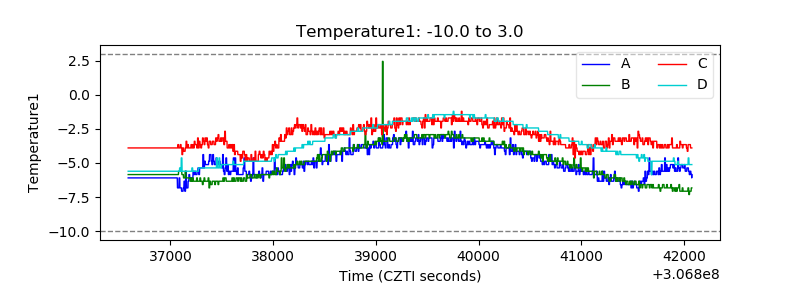 |
| Veto HV Monitor | 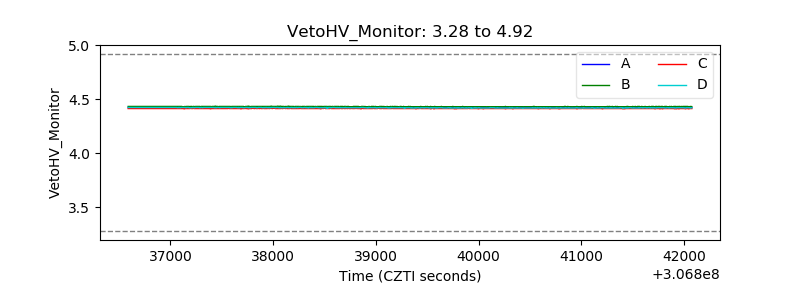 |
| Veto LLD | 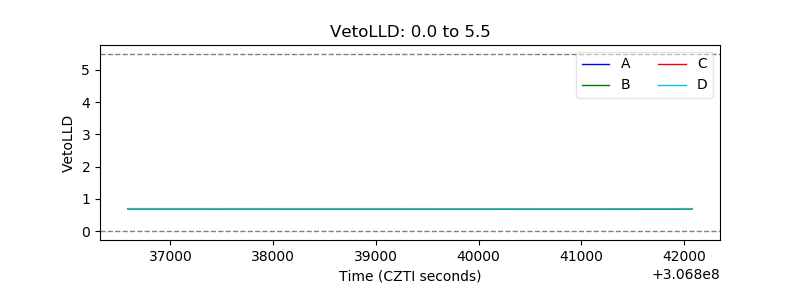 |
| Alpha Counter | 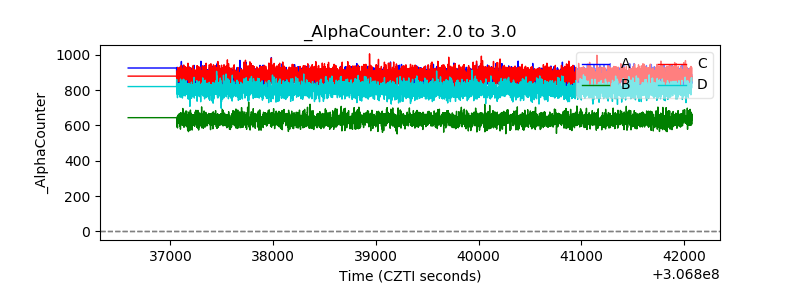 |
| _CPM_Rate | 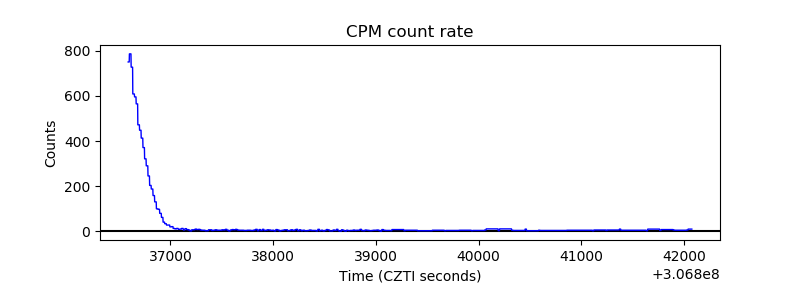 |
| CZT Counter | 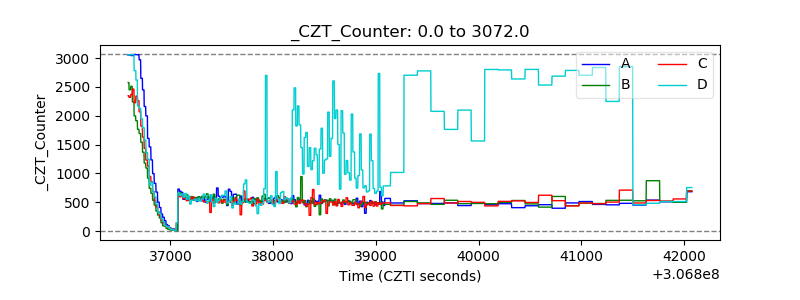 |
| +2.5 Volts monitor | 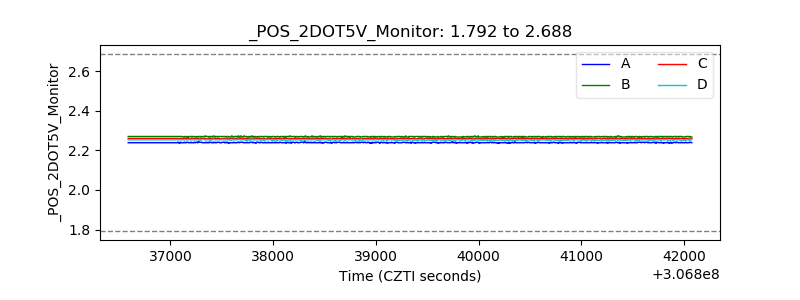 |
| +5 Volts monitor | 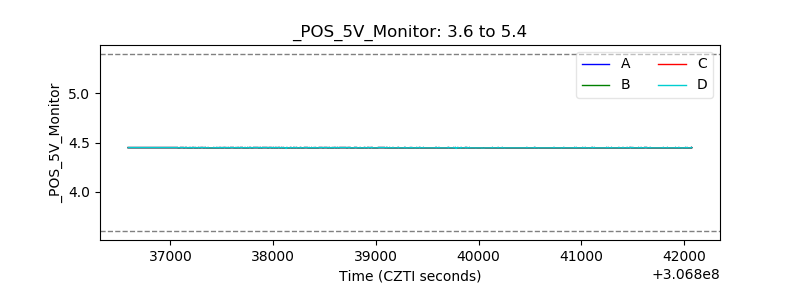 |
| _ROLL_ROT | 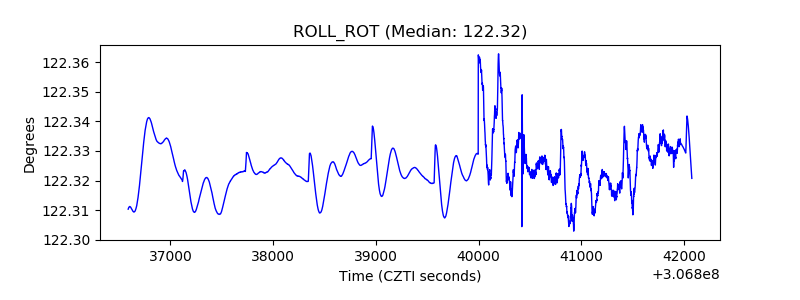 |
| _Roll_DEC | 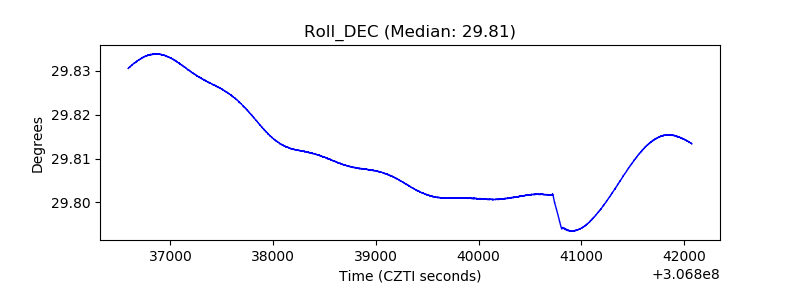 |
| _Roll_RA | 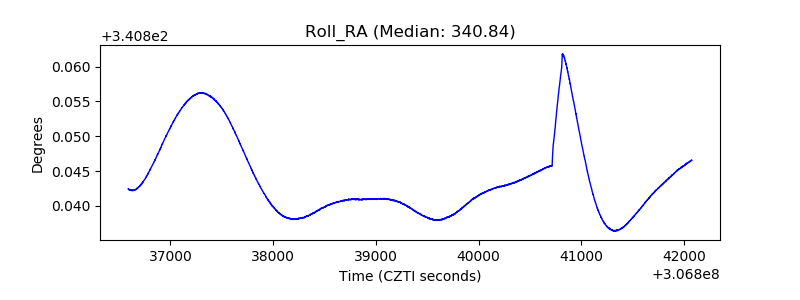 |
| Veto Counter | 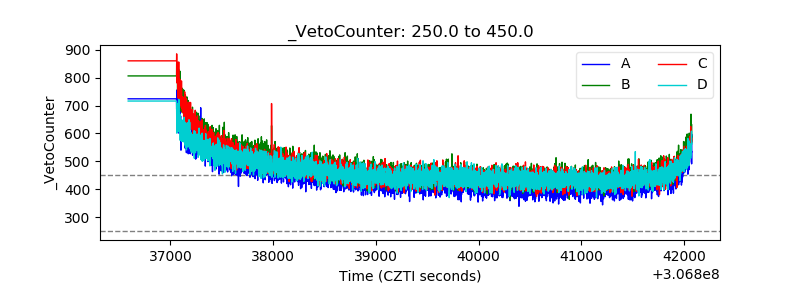 |