| Param | Original file | Final file |
|---|---|---|
| Filename | modeM0/AS1T03_138T05_9000003182_21539cztM0_level2.evt | modeM0/AS1T03_138T05_9000003182_21539cztM0_level2_quad_clean.evt |
| Size (bytes) | 97,214,400 | 28,022,400 |
| Size | 92.7 MB | 26.7 MB |
| Events in quadrant A | 686,433 | 193,054 |
| Events in quadrant B | 672,789 | 199,252 |
| Events in quadrant C | 651,751 | 185,293 |
| Events in quadrant D | 847,002 | 178,175 |
| Mode M0 | |||
|---|---|---|---|
| Quadrant | BADHDUFLAG | Total packets | Discarded packets |
| A | 0 | 2732 | 1 |
| B | 0 | 2664 | 1 |
| C | 0 | 2586 | 1 |
| D | 0 | 3250 | 1 |
| Mode SS | |||
|---|---|---|---|
| Quadrant | BADHDUFLAG | Total packets | Discarded packets |
| A | 0 | 24 | 0 |
| B | 0 | 24 | 0 |
| C | 0 | 24 | 0 |
| D | 0 | 24 | 0 |
| Mode M9 | |||
|---|---|---|---|
| Quadrant | BADHDUFLAG | Total packets | Discarded packets |
| A | 0 | 9 | 0 |
| B | 0 | 9 | 0 |
| C | 0 | 9 | 0 |
| D | 0 | 9 | 0 |
| Quadrant | Total seconds | Saturated seconds | Saturation percentage |
|---|---|---|---|
| A | 1226 | 4 | 0.326264% |
| B | 1226 | 4 | 0.326264% |
| C | 1226 | 13 | 1.060359% |
| D | 1226 | 45 | 3.670473% |
Noise dominated data is calculated using 1-second bins in cleaned event files. If a bin has >2000 counts, and if more than 50% of those come from <1% of pixels, then it is considered to be noise-dominated and hence unusable.
| Quadrant | # 1 sec bins | Bins with >0 counts | Bins with >2000 counts | High rate bins dominated by noise | Noise dominated (total time) | Noise dominated (detector-on time) | Marked lightcurve |
|---|---|---|---|---|---|---|---|
| A | 1226 | 1226 | 0 | 0 | 0.00% | 0.00% | 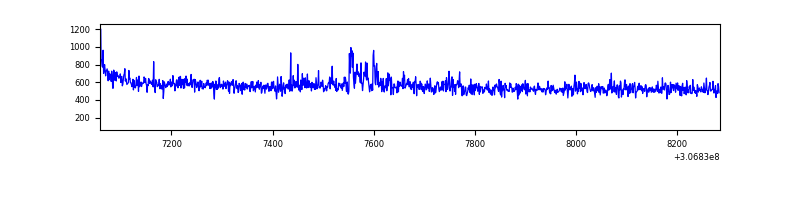 |
| B | 1226 | 1226 | 0 | 0 | 0.00% | 0.00% | 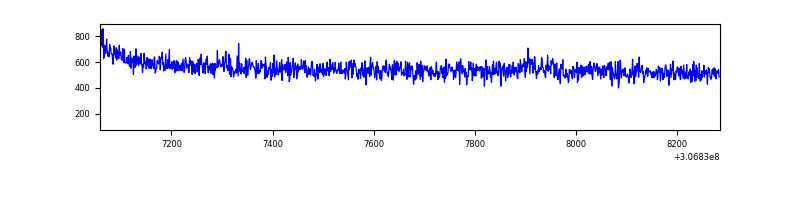 |
| C | 1226 | 1226 | 0 | 0 | 0.00% | 0.00% | 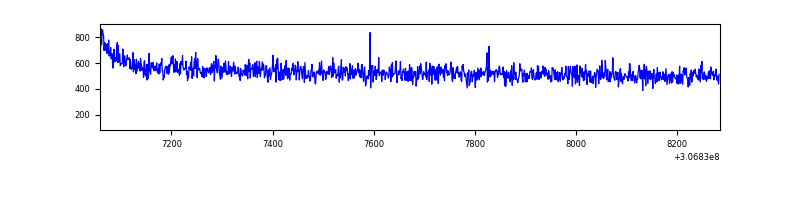 |
| D | 1226 | 1226 | 48 | 48 | 3.92% | 3.92% | 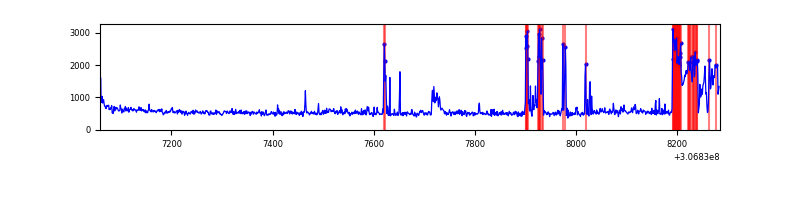 |
Top three noisy pixels from each quadrant. If the there are fewer than three noisy pixels in the level2.evt file, extra rows are filled as -1
| Pixel properties | Quadrant properties | ||||||
|---|---|---|---|---|---|---|---|
| Quadrant | DetID | PixID | Counts | Sigma | Mean | Median | Sigma |
| A | 6 | 16 | 25744 | 711.76 | 171 | 168 | 35.9 |
| A | 13 | 254 | 1936 | 49.2 | 171 | 168 | 35.9 |
| A | 0 | 226 | 1485 | 36.65 | 171 | 168 | 35.9 |
| B | 0 | 189 | 4005 | 112.92 | 171 | 167 | 34.0 |
| B | 12 | 111 | 3858 | 108.59 | 171 | 167 | 34.0 |
| B | 11 | 111 | 3256 | 90.88 | 171 | 167 | 34.0 |
| C | 14 | 238 | 26540 | 683.44 | 159 | 161 | 38.6 |
| C | 13 | 61 | 1140 | 25.36 | 159 | 161 | 38.6 |
| C | 0 | 10 | 1023 | 22.33 | 159 | 161 | 38.6 |
| D | 1 | 52 | 158264 | 3729.39 | 158 | 153 | 42.4 |
| D | 1 | 20 | 53982 | 1269.67 | 158 | 153 | 42.4 |
| D | 14 | 35 | 15127 | 353.18 | 158 | 153 | 42.4 |
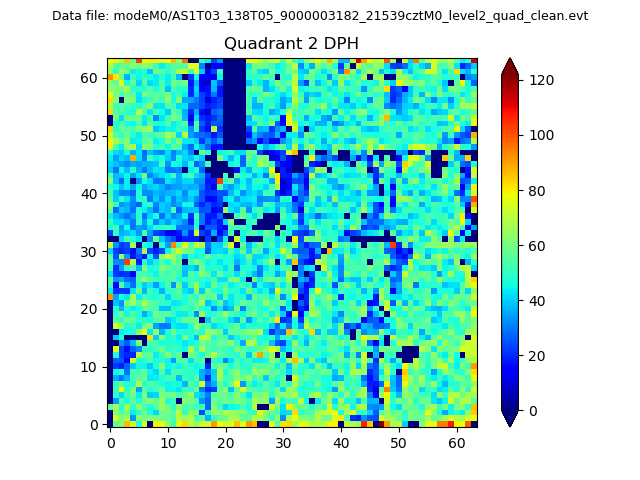
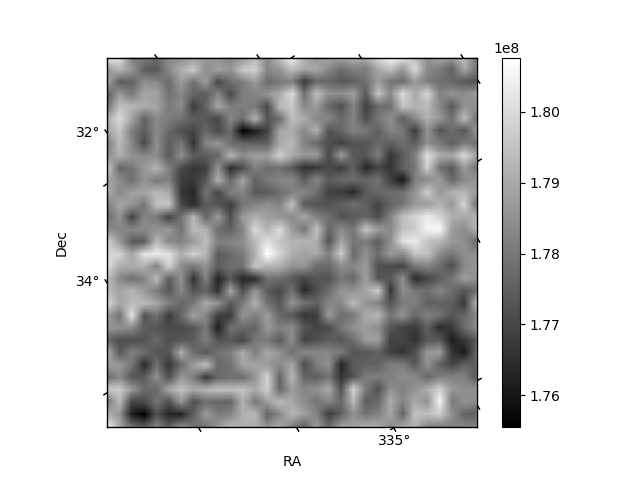
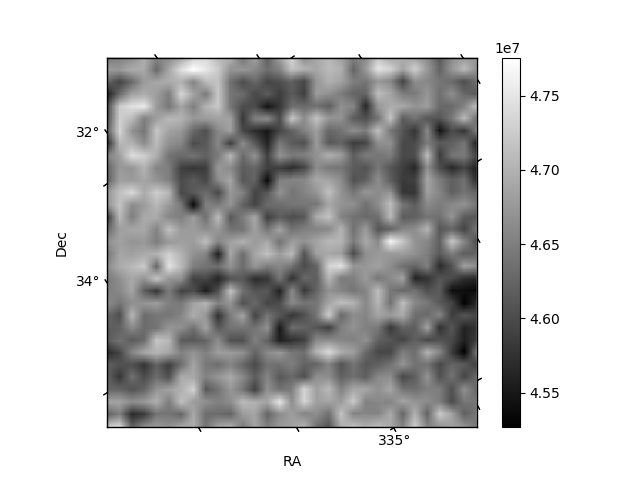
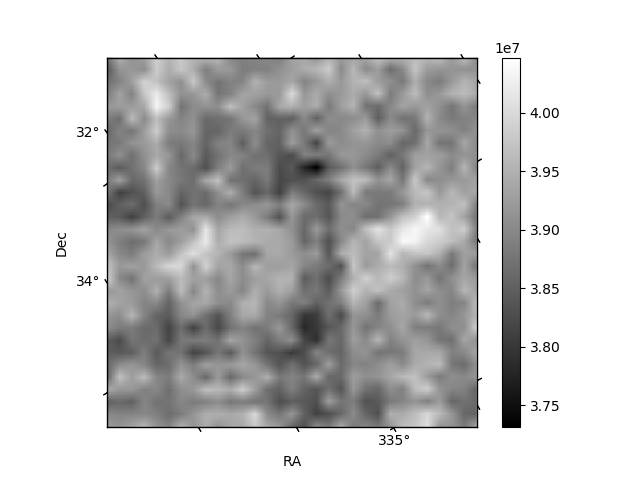
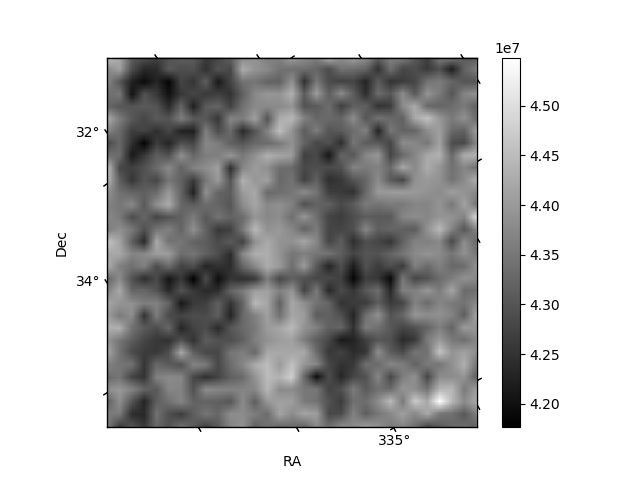
Histogram calculated using DETX and DETY for each event in the final _common_clean file
| Quadrant A | 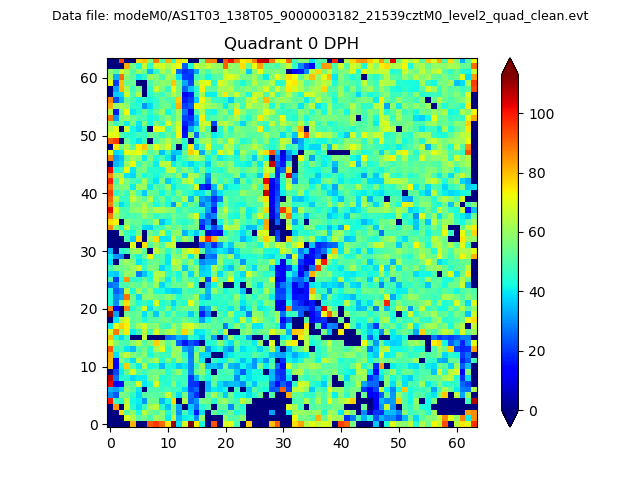 |
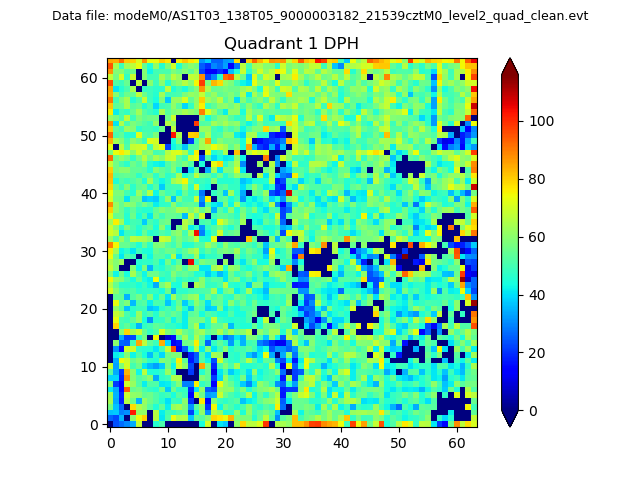 |
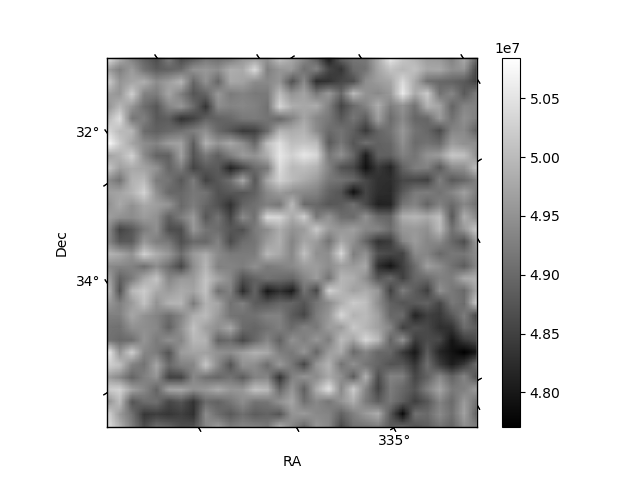
Quadrant B |
|---|---|---|---|
| Quadrant D | 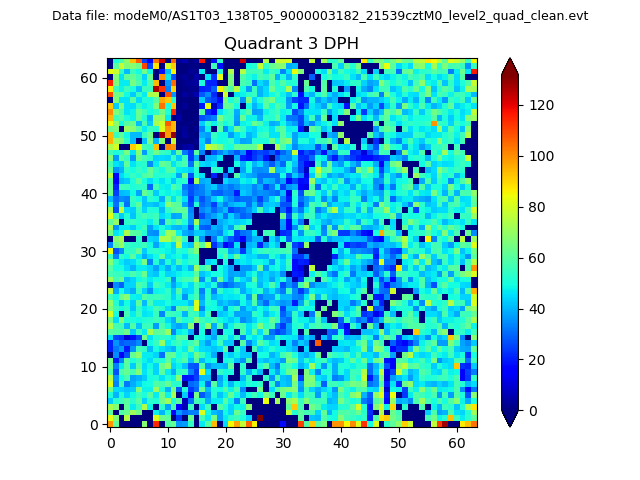 |
 |
Quadrant C |
| Plot type | Count rate plots | Images |
|---|---|---|
| Comparison with Poisson distribution Blue bars denote a histogram of data divided into 1 sec bins. Red curve is a Poisson curve with rate = median count rate of data. |
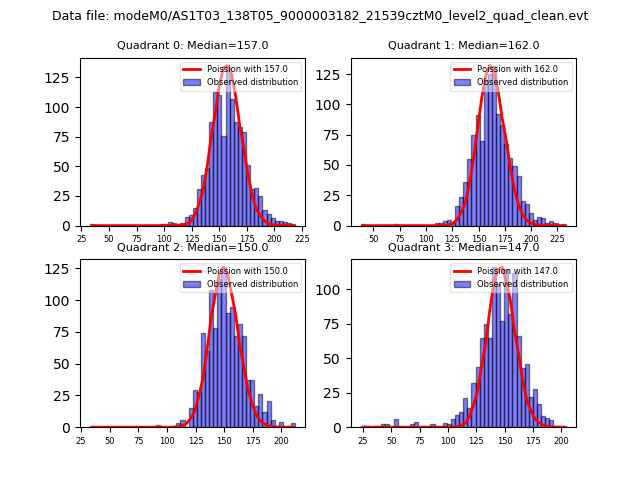 |
 |
| Quadrant-wise count rates Data is divided into 100 sec bins |
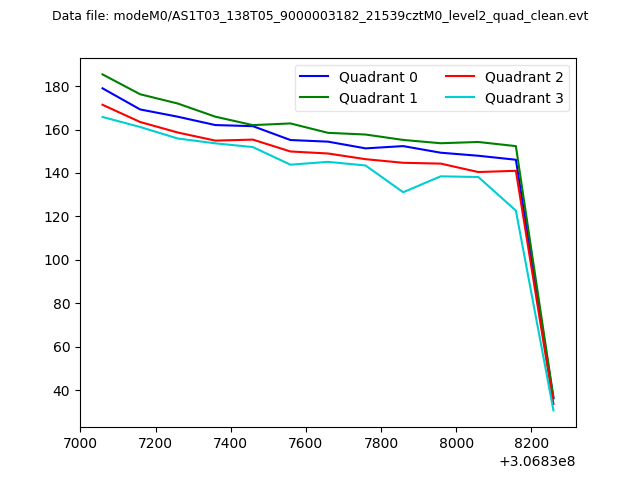 |
|
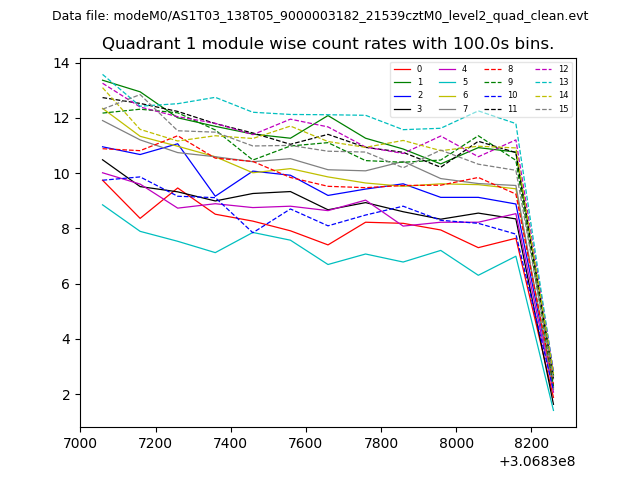
| Module-wise count rates for Quadrant A Data is divided into 100 sec bins |
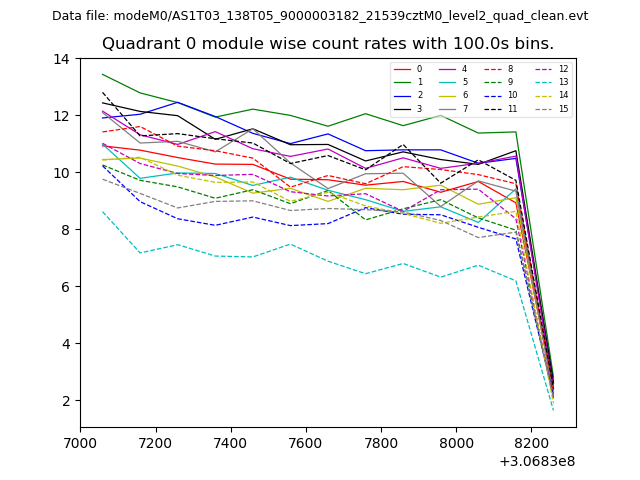 |
 |
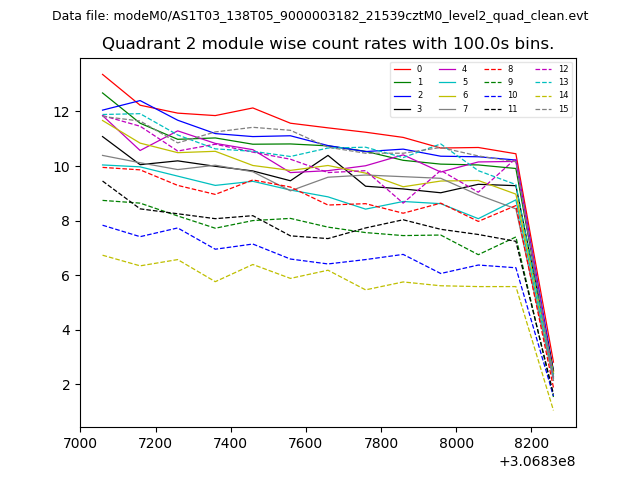
| Module-wise count rates for Quadrant B Data is divided into 100 sec bins |
 |
 |
| Module-wise count rates for Quadrant C Data is divided into 100 sec bins |
 |
 |
| Module-wise count rates for Quadrant D Data is divided into 100 sec bins |
 |
 |
| Parameter | Plot |
|---|---|
| CZT HV Monitor |  |
| D_VDD | 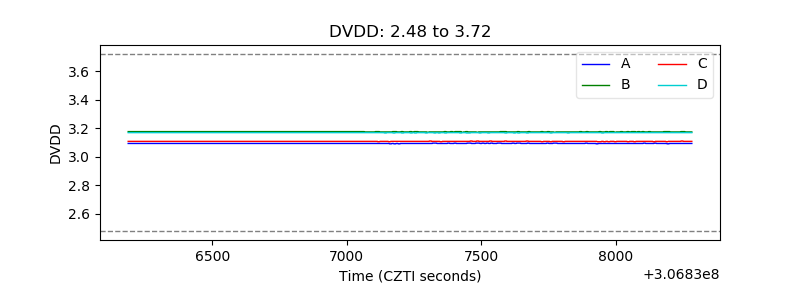 |
| Temperature 1 | 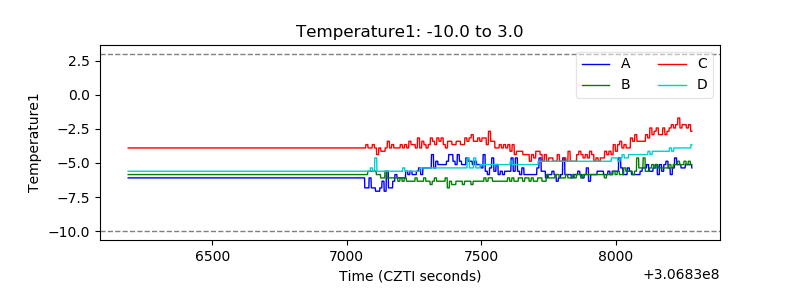 |
| Veto HV Monitor | 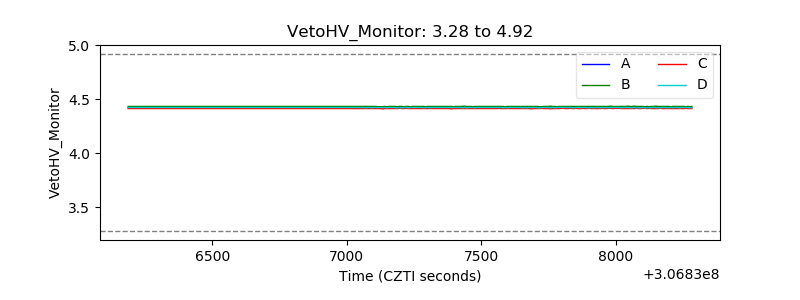 |
| Veto LLD |  |
| Alpha Counter | 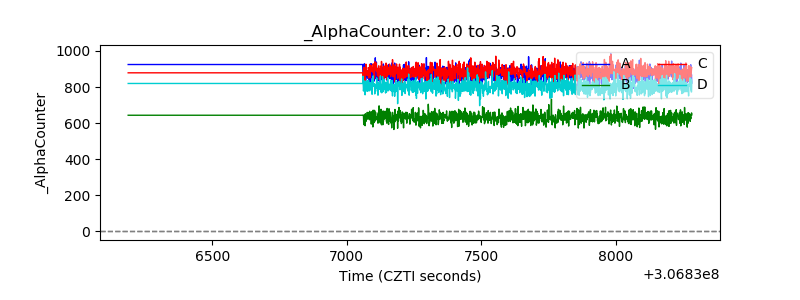 |
| _CPM_Rate | 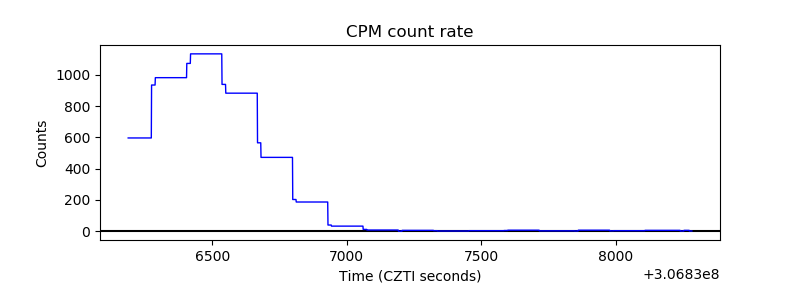 |
| CZT Counter | 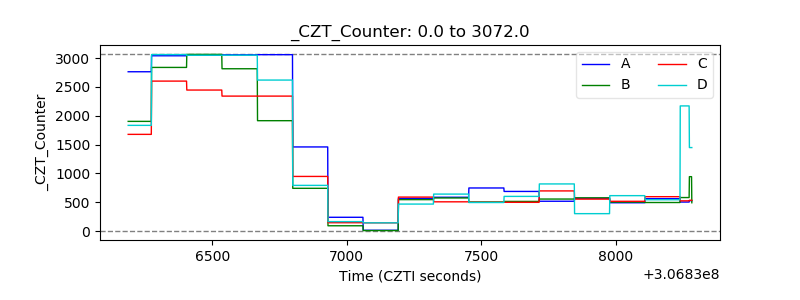 |
| +2.5 Volts monitor |  |
| +5 Volts monitor |  |
| _ROLL_ROT |  |
| _Roll_DEC | 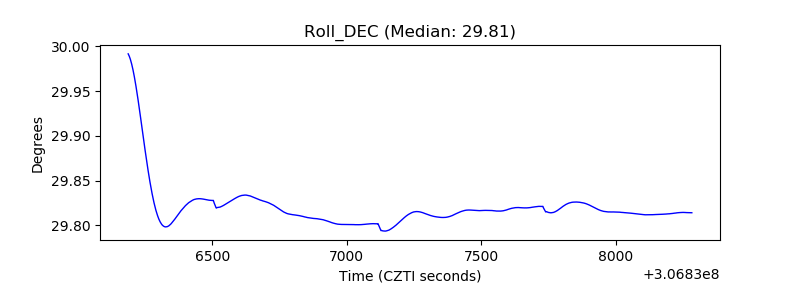 |
| _Roll_RA | 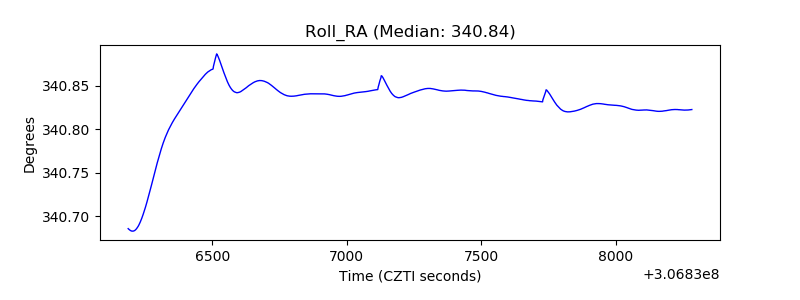 |
| Veto Counter | 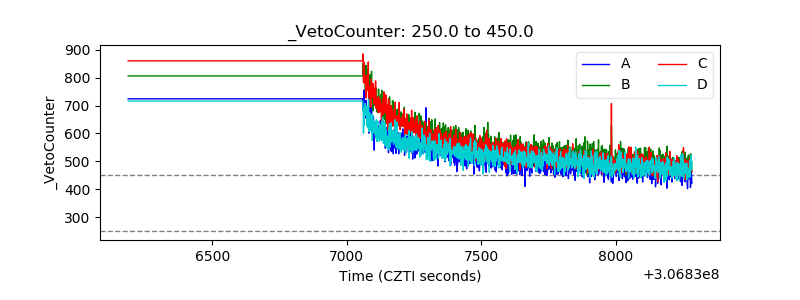 |