| Param | Original file | Final file |
|---|---|---|
| Filename | modeM0/AS1T03_138T06_9000003184cztM0_level2.fits | modeM0/AS1T03_138T06_9000003184cztM0_level2_quad_clean.evt |
| Size (bytes) | 51,465,600 | 56,563,200 |
| Size | 49.1 MB | 53.9 MB |
| Events in quadrant A | 318,374 | 354,050 |
| Events in quadrant B | 305,942 | 357,092 |
| Events in quadrant C | 306,868 | 333,832 |
| Events in quadrant D | 268,418 | 308,000 |
| Mode M9 | |||
|---|---|---|---|
| Quadrant | BADHDUFLAG | Total packets | Discarded packets |
| A | 0 | 8 | 0 |
| B | 0 | 8 | 0 |
| C | 0 | 8 | 0 |
| D | 0 | 8 | 0 |
| Mode M0 | |||
|---|---|---|---|
| Quadrant | BADHDUFLAG | Total packets | Discarded packets |
| A | 0 | 10406 | 0 |
| B | 0 | 10557 | 0 |
| C | 0 | 10396 | 0 |
| D | 0 | 11140 | 0 |
| Mode SS | |||
|---|---|---|---|
| Quadrant | BADHDUFLAG | Total packets | Discarded packets |
| A | 0 | 102 | 0 |
| B | 0 | 102 | 0 |
| C | 0 | 102 | 0 |
| D | 0 | 102 | 0 |
| Quadrant | Total seconds | Saturated seconds | Saturation percentage |
|---|---|---|---|
| A | 5128 | 24 | 0.468019% |
| B | 5128 | 35 | 0.682527% |
| C | 5128 | 35 | 0.682527% |
| D | 5128 | 22 | 0.429017% |
Noise dominated data is calculated using 1-second bins in cleaned event files. If a bin has >2000 counts, and if more than 50% of those come from <1% of pixels, then it is considered to be noise-dominated and hence unusable.
| Quadrant | # 1 sec bins | Bins with >0 counts | Bins with >2000 counts | High rate bins dominated by noise | Noise dominated (total time) | Noise dominated (detector-on time) | Marked lightcurve |
|---|---|---|---|---|---|---|---|
| A | 5127 | 5127 | 0 | 0 | 0.00% | 0.00% |  |
| B | 5127 | 5127 | 0 | 0 | 0.00% | 0.00% | 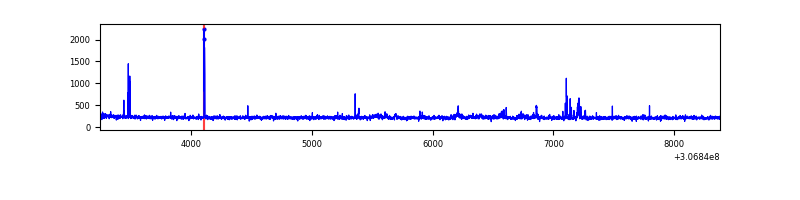 |
| C | 5127 | 5127 | 0 | 0 | 0.00% | 0.00% |  |
| D | 5127 | 5127 | 0 | 0 | 0.00% | 0.00% |  |
Top three noisy pixels from each quadrant. If the there are fewer than three noisy pixels in the level2.evt file, extra rows are filled as -1
| Pixel properties | Quadrant properties | ||||||
|---|---|---|---|---|---|---|---|
| Quadrant | DetID | PixID | Counts | Sigma | Mean | Median | Sigma |
| A | 0 | 29 | 279 | 9.0 | 83 | 78 | 22.3 |
| A | 0 | 30 | 230 | 6.81 | 83 | 78 | 22.3 |
| A | 9 | 19 | 225 | 6.58 | 83 | 78 | 22.3 |
| B | 2 | 9 | 267 | 10.62 | 80 | 77 | 17.9 |
| B | 14 | 254 | 219 | 7.93 | 80 | 77 | 17.9 |
| B | 2 | 8 | 215 | 7.71 | 80 | 77 | 17.9 |
| C | 1 | 81 | 245 | 7.37 | 81 | 76 | 22.9 |
| C | 1 | 80 | 245 | 7.37 | 81 | 76 | 22.9 |
| C | 3 | 202 | 242 | 7.24 | 81 | 76 | 22.9 |
| D | 4 | 246 | 202 | 5.98 | 76 | 70 | 22.1 |
| D | 3 | 159 | 202 | 5.98 | 76 | 70 | 22.1 |
| D | 7 | 3 | 198 | 5.8 | 76 | 70 | 22.1 |
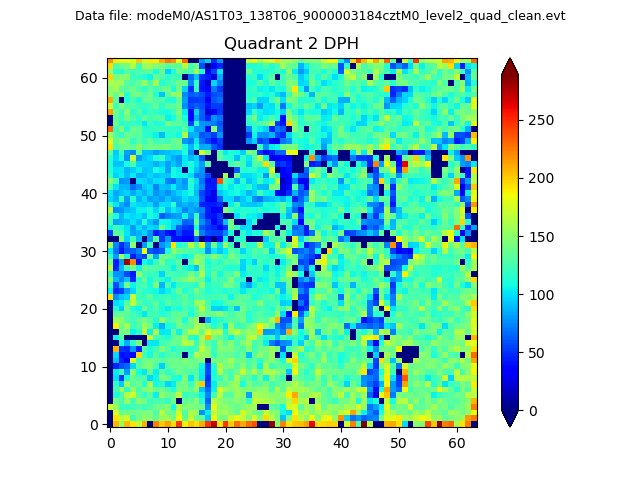
Histogram calculated using DETX and DETY for each event in the final _common_clean file
| Quadrant A |  |
 |
Quadrant B |
|---|---|---|---|
| Quadrant D | 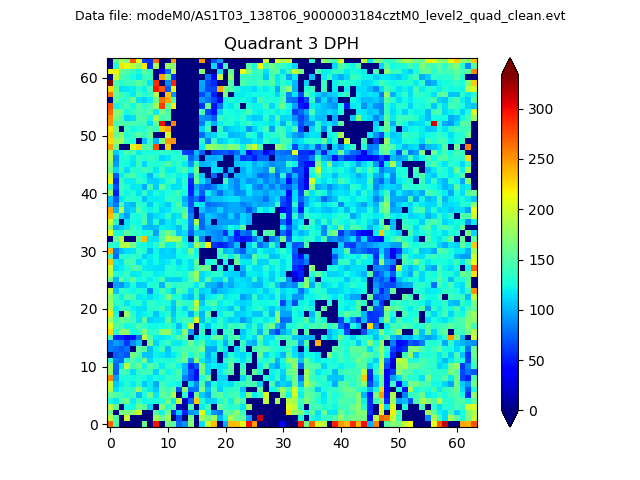 |
 |
Quadrant C |
| Plot type | Count rate plots | Images |
|---|---|---|
| Comparison with Poisson distribution Blue bars denote a histogram of data divided into 1 sec bins. Red curve is a Poisson curve with rate = median count rate of data. |
 |
 |
| Quadrant-wise count rates Data is divided into 100 sec bins |
 |
|
| Module-wise count rates for Quadrant A Data is divided into 100 sec bins |
 |
 |
| Module-wise count rates for Quadrant B Data is divided into 100 sec bins |
 |
 |
| Module-wise count rates for Quadrant C Data is divided into 100 sec bins |
 |
 |
| Module-wise count rates for Quadrant D Data is divided into 100 sec bins |
 |
 |
| Parameter | Plot |
|---|---|
| CZT HV Monitor |  |
| D_VDD | 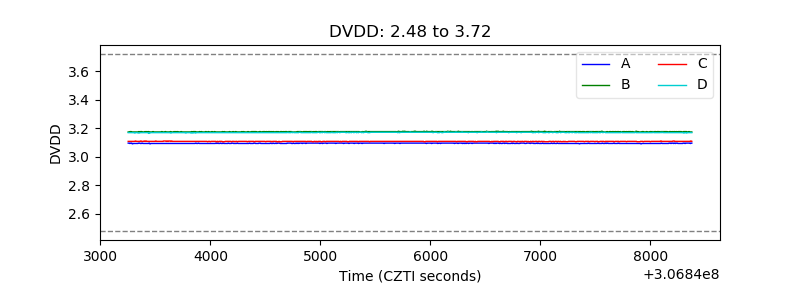 |
| Temperature 1 |  |
| Veto HV Monitor |  |
| Veto LLD |  |
| Alpha Counter |  |
| _CPM_Rate |  |
| CZT Counter |  |
| +2.5 Volts monitor |  |
| +5 Volts monitor |  |
| _ROLL_ROT |  |
| _Roll_DEC | 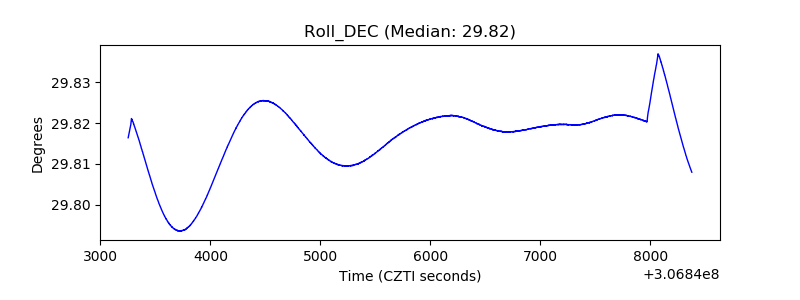 |
| _Roll_RA |  |
| Veto Counter |  |