| Param | Original file | Final file |
|---|---|---|
| Filename | modeM0/AS1T03_138T06_9000003184_21540cztM0_level2.evt | modeM0/AS1T03_138T06_9000003184_21540cztM0_level2_quad_clean.evt |
| Size (bytes) | 111,827,520 | 5,569,920 |
| Size | 106.6 MB | 5.3 MB |
| Events in quadrant A | 818,354 | 12,958 |
| Events in quadrant B | 836,981 | 13,634 |
| Events in quadrant C | 800,276 | 12,112 |
| Events in quadrant D | 820,725 | 12,243 |
| Mode M9 | |||
|---|---|---|---|
| Quadrant | BADHDUFLAG | Total packets | Discarded packets |
| A | 0 | 8 | 0 |
| B | 0 | 8 | 0 |
| C | 0 | 8 | 0 |
| D | 0 | 8 | 0 |
| Mode M0 | |||
|---|---|---|---|
| Quadrant | BADHDUFLAG | Total packets | Discarded packets |
| A | 0 | 3295 | 1 |
| B | 0 | 3360 | 1 |
| C | 0 | 3284 | 1 |
| D | 0 | 3371 | 1 |
| Mode SS | |||
|---|---|---|---|
| Quadrant | BADHDUFLAG | Total packets | Discarded packets |
| A | 0 | 32 | 0 |
| B | 0 | 32 | 0 |
| C | 0 | 32 | 0 |
| D | 0 | 32 | 0 |
| Quadrant | Total seconds | Saturated seconds | Saturation percentage |
|---|---|---|---|
| A | 1581 | 22 | 1.391524% |
| B | 1581 | 35 | 2.213789% |
| C | 1581 | 25 | 1.581278% |
| D | 1580 | 14 | 0.886076% |
Noise dominated data is calculated using 1-second bins in cleaned event files. If a bin has >2000 counts, and if more than 50% of those come from <1% of pixels, then it is considered to be noise-dominated and hence unusable.
| Quadrant | # 1 sec bins | Bins with >0 counts | Bins with >2000 counts | High rate bins dominated by noise | Noise dominated (total time) | Noise dominated (detector-on time) | Marked lightcurve |
|---|---|---|---|---|---|---|---|
| A | 1581 | 1581 | 0 | 0 | 0.00% | 0.00% | 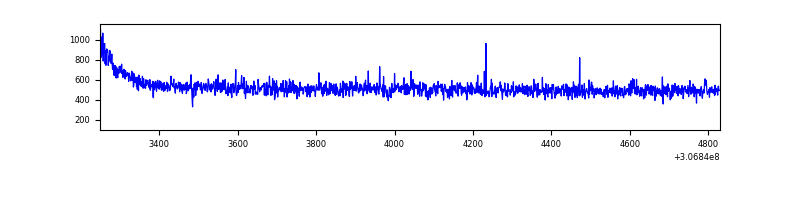 |
| B | 1581 | 1581 | 4 | 4 | 0.25% | 0.25% | 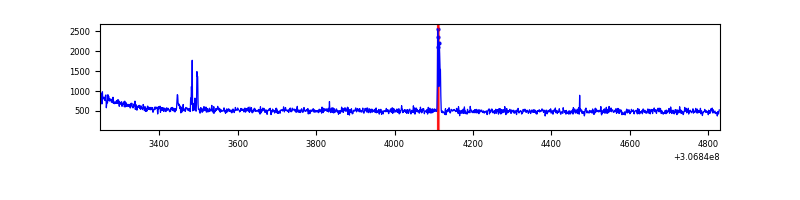 |
| C | 1581 | 1581 | 0 | 0 | 0.00% | 0.00% | 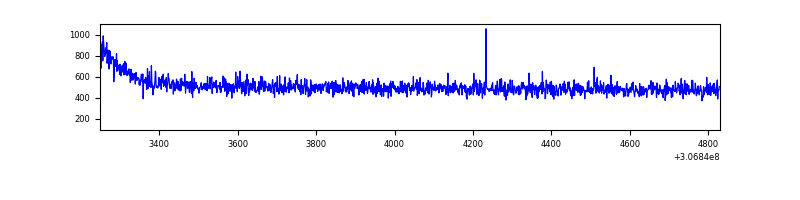 |
| D | 1580 | 1580 | 0 | 0 | 0.00% | 0.00% | 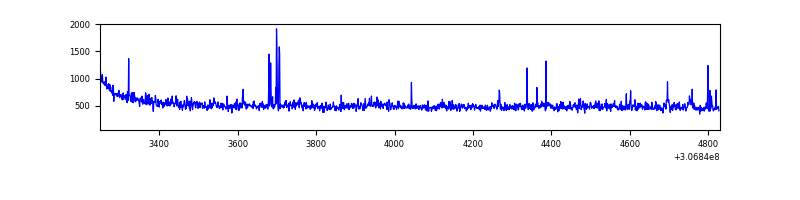 |
Top three noisy pixels from each quadrant. If the there are fewer than three noisy pixels in the level2.evt file, extra rows are filled as -1
| Pixel properties | Quadrant properties | ||||||
|---|---|---|---|---|---|---|---|
| Quadrant | DetID | PixID | Counts | Sigma | Mean | Median | Sigma |
| A | 13 | 254 | 2360 | 49.21 | 211 | 207 | 43.7 |
| A | 6 | 16 | 2243 | 46.54 | 211 | 207 | 43.7 |
| A | 0 | 226 | 1858 | 37.74 | 211 | 207 | 43.7 |
| B | 3 | 64 | 21159 | 502.29 | 208 | 203 | 41.7 |
| B | 12 | 111 | 4956 | 113.92 | 208 | 203 | 41.7 |
| B | 11 | 111 | 4421 | 101.1 | 208 | 203 | 41.7 |
| C | 14 | 238 | 31518 | 651.94 | 196 | 197 | 48.0 |
| C | 13 | 61 | 1356 | 24.12 | 196 | 197 | 48.0 |
| C | 4 | 175 | 840 | 13.38 | 196 | 197 | 48.0 |
| D | 14 | 35 | 34854 | 636.99 | 198 | 192 | 54.4 |
| D | 12 | 235 | 8136 | 145.99 | 198 | 192 | 54.4 |
| D | 1 | 52 | 7494 | 134.19 | 198 | 192 | 54.4 |
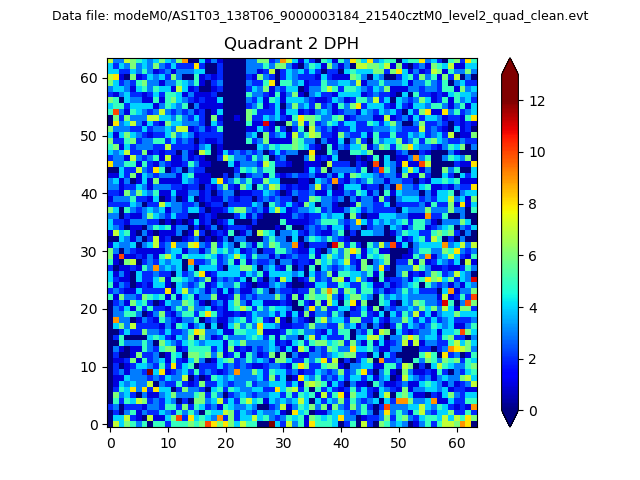
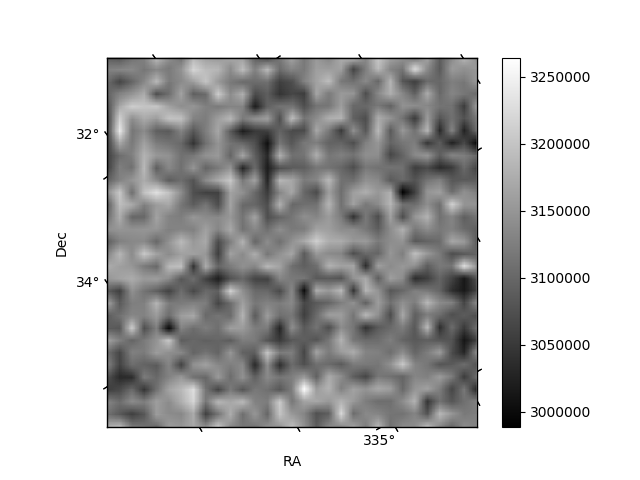
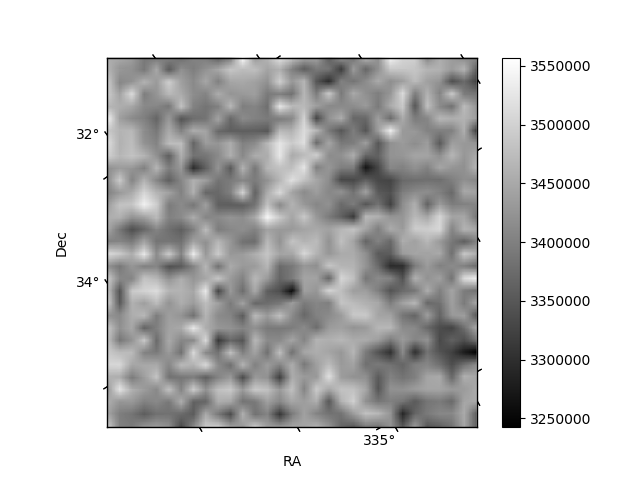
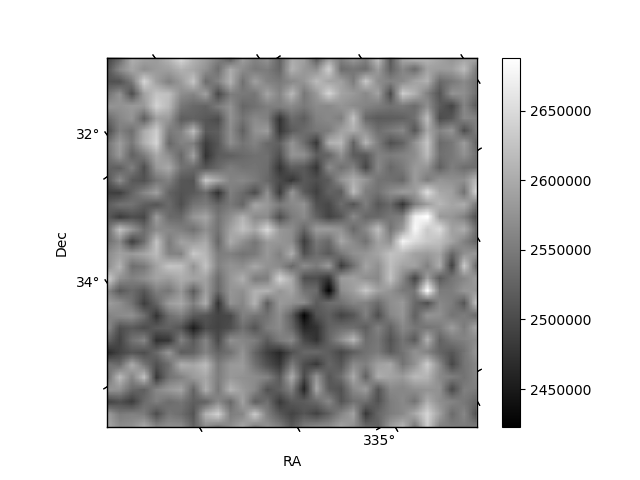
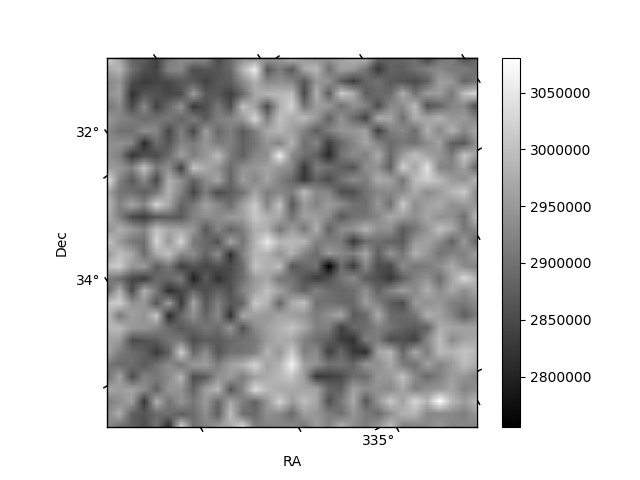
Histogram calculated using DETX and DETY for each event in the final _common_clean file
| Quadrant A | 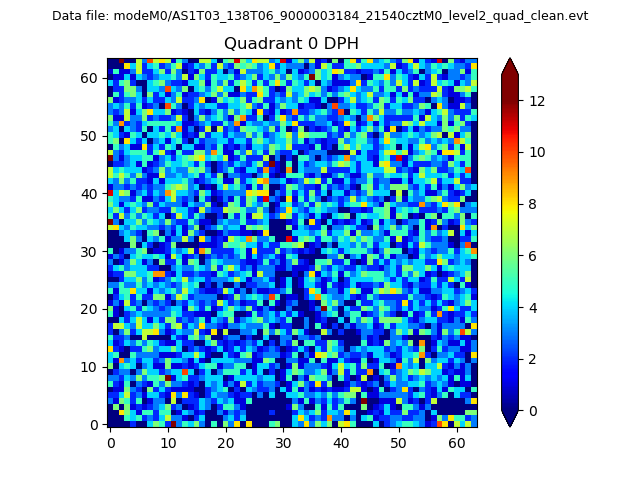 |
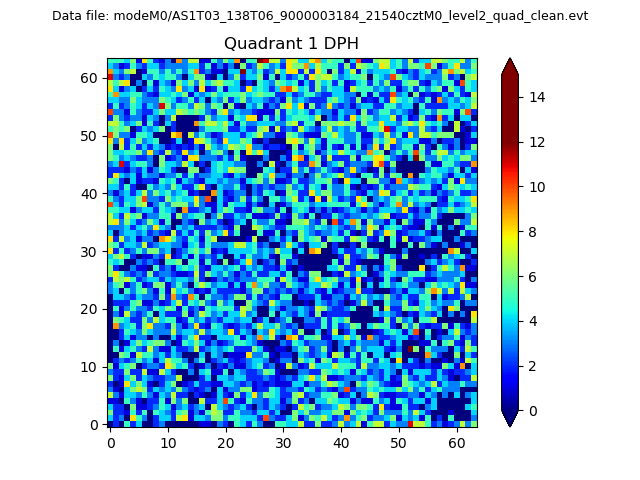 |
Quadrant B |
|---|---|---|---|
| Quadrant D | 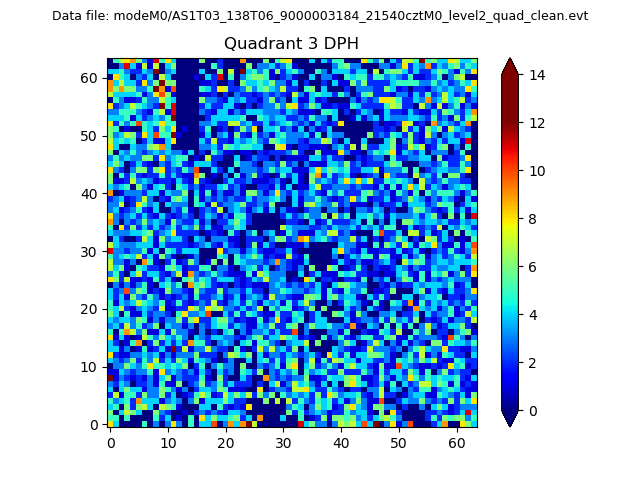 |
 |
Quadrant C |
| Plot type | Count rate plots | Images |
|---|---|---|
| Comparison with Poisson distribution Blue bars denote a histogram of data divided into 1 sec bins. Red curve is a Poisson curve with rate = median count rate of data. |
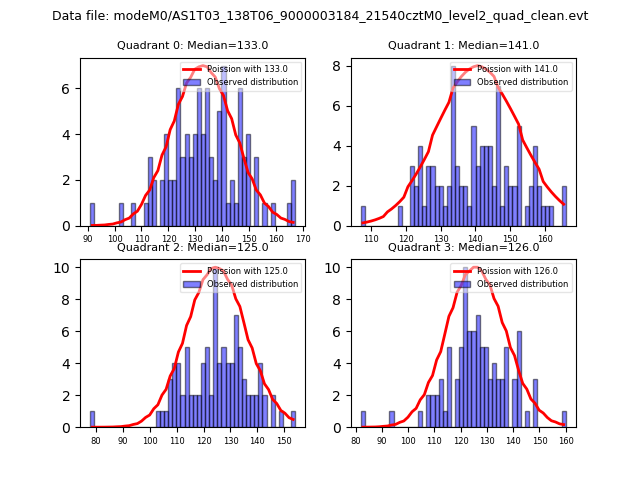 |
 |
| Quadrant-wise count rates Data is divided into 100 sec bins |
 |
|
| Module-wise count rates for Quadrant A Data is divided into 100 sec bins |
 |
 |
| Module-wise count rates for Quadrant B Data is divided into 100 sec bins |
 |
 |
| Module-wise count rates for Quadrant C Data is divided into 100 sec bins |
 |
 |
| Module-wise count rates for Quadrant D Data is divided into 100 sec bins |
 |
 |
| Parameter | Plot |
|---|---|
| CZT HV Monitor | 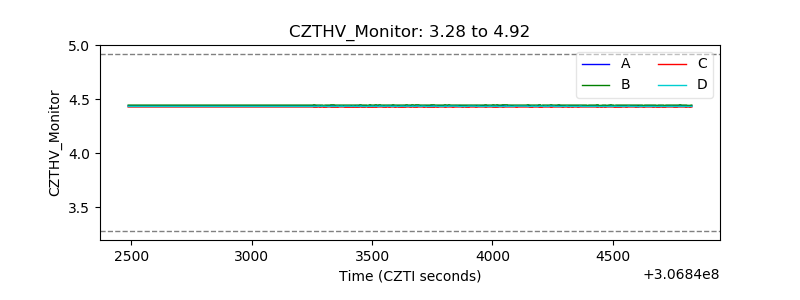 |
| D_VDD | 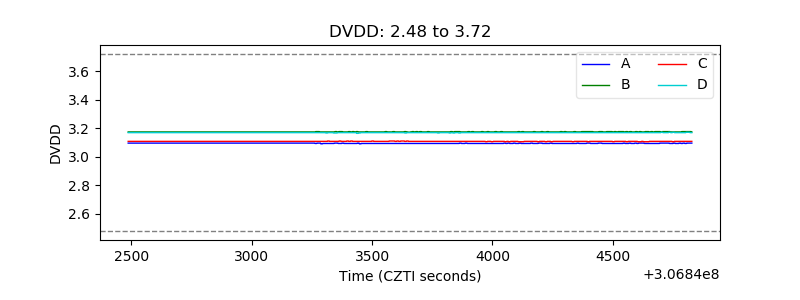 |
| Temperature 1 | 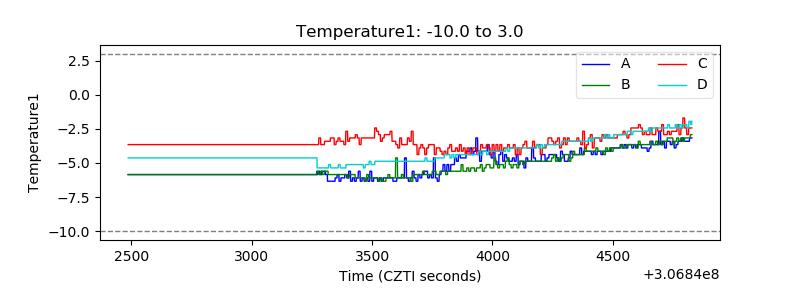 |
| Veto HV Monitor | 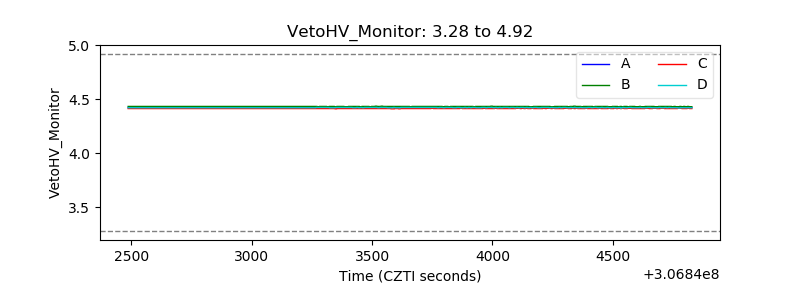 |
| Veto LLD | 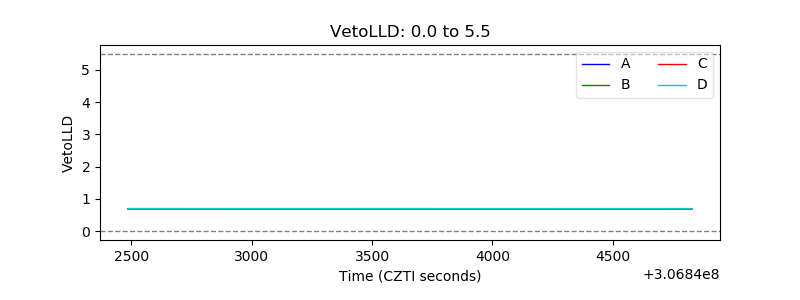 |
| Alpha Counter | 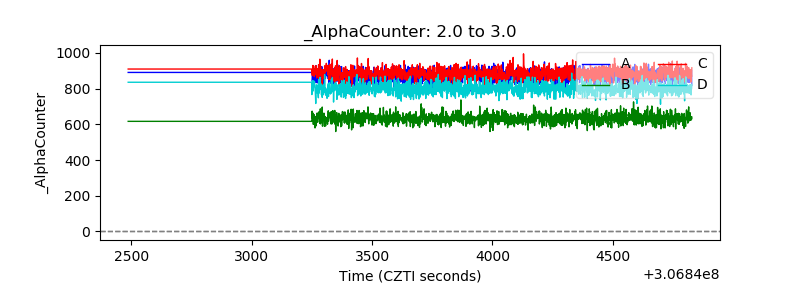 |
| _CPM_Rate | 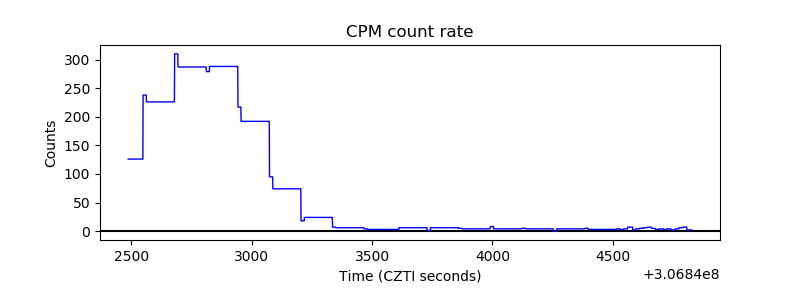 |
| CZT Counter |  |
| +2.5 Volts monitor | 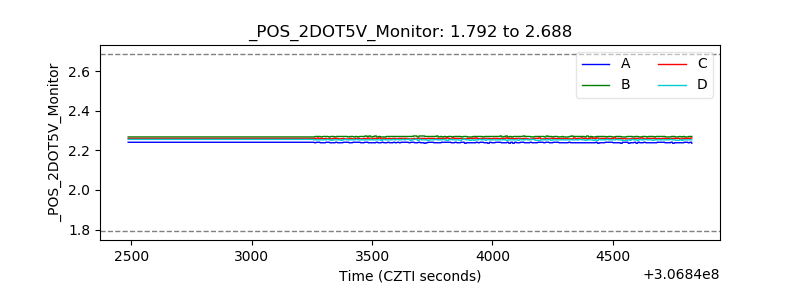 |
| +5 Volts monitor |  |
| _ROLL_ROT | 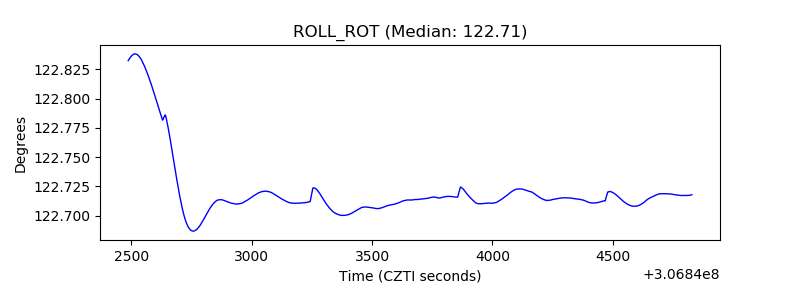 |
| _Roll_DEC | 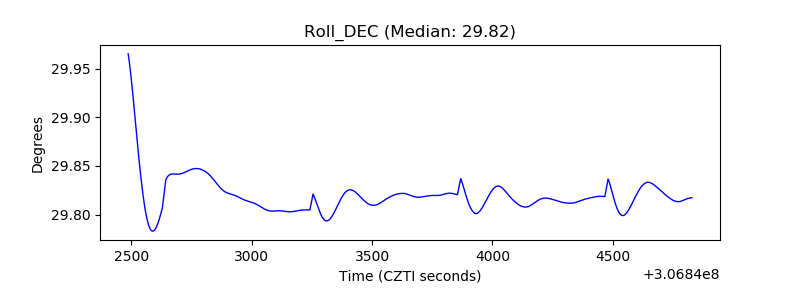 |
| _Roll_RA |  |
| Veto Counter | 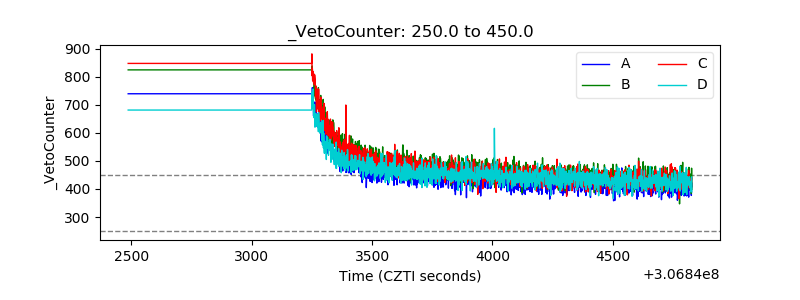 |