| Param | Original file | Final file |
|---|---|---|
| Filename | modeM0/AS1T03_138T07_9000003186cztM0_level2.fits | modeM0/AS1T03_138T07_9000003186cztM0_level2_quad_clean.evt |
| Size (bytes) | 46,811,520 | 21,035,520 |
| Size | 44.6 MB | 20.1 MB |
| Events in quadrant A | 286,102 | 75,862 |
| Events in quadrant B | 273,550 | 76,458 |
| Events in quadrant C | 275,252 | 73,245 |
| Events in quadrant D | 240,660 | 67,647 |
| Mode M0 | |||
|---|---|---|---|
| Quadrant | BADHDUFLAG | Total packets | Discarded packets |
| A | 0 | 10021 | 0 |
| B | 0 | 10173 | 0 |
| C | 0 | 9980 | 0 |
| D | 0 | 13052 | 0 |
| Mode SS | |||
|---|---|---|---|
| Quadrant | BADHDUFLAG | Total packets | Discarded packets |
| A | 0 | 98 | 0 |
| B | 0 | 98 | 0 |
| C | 0 | 98 | 0 |
| D | 0 | 98 | 0 |
| Mode M9 | |||
|---|---|---|---|
| Quadrant | BADHDUFLAG | Total packets | Discarded packets |
| A | 0 | 7 | 0 |
| B | 0 | 7 | 0 |
| C | 0 | 7 | 0 |
| D | 0 | 7 | 0 |
| Quadrant | Total seconds | Saturated seconds | Saturation percentage |
|---|---|---|---|
| A | 4884 | 105 | 2.149877% |
| B | 4884 | 116 | 2.375102% |
| C | 4884 | 116 | 2.375102% |
| D | 4884 | 118 | 2.416052% |
Noise dominated data is calculated using 1-second bins in cleaned event files. If a bin has >2000 counts, and if more than 50% of those come from <1% of pixels, then it is considered to be noise-dominated and hence unusable.
| Quadrant | # 1 sec bins | Bins with >0 counts | Bins with >2000 counts | High rate bins dominated by noise | Noise dominated (total time) | Noise dominated (detector-on time) | Marked lightcurve |
|---|---|---|---|---|---|---|---|
| A | 5584 | 4884 | 0 | 0 | 0.00% | 0.00% |  |
| B | 5584 | 4884 | 0 | 0 | 0.00% | 0.00% |  |
| C | 5584 | 4884 | 0 | 0 | 0.00% | 0.00% |  |
| D | 5584 | 4884 | 0 | 0 | 0.00% | 0.00% |  |
Top three noisy pixels from each quadrant. If the there are fewer than three noisy pixels in the level2.evt file, extra rows are filled as -1
| Pixel properties | Quadrant properties | ||||||
|---|---|---|---|---|---|---|---|
| Quadrant | DetID | PixID | Counts | Sigma | Mean | Median | Sigma |
| A | 0 | 29 | 257 | 9.24 | 74 | 70 | 20.2 |
| A | 7 | 110 | 231 | 7.95 | 74 | 70 | 20.2 |
| A | 9 | 19 | 219 | 7.36 | 74 | 70 | 20.2 |
| B | 2 | 9 | 215 | 8.71 | 72 | 69 | 16.8 |
| B | 3 | 17 | 195 | 7.52 | 72 | 69 | 16.8 |
| B | 2 | 8 | 190 | 7.22 | 72 | 69 | 16.8 |
| C | 1 | 80 | 213 | 7.18 | 72 | 68 | 20.2 |
| C | 9 | 209 | 209 | 6.98 | 72 | 68 | 20.2 |
| C | 1 | 81 | 199 | 6.48 | 72 | 68 | 20.2 |
| D | 15 | 46 | 196 | 6.85 | 68 | 63 | 19.4 |
| D | 6 | 38 | 178 | 5.92 | 68 | 63 | 19.4 |
| D | 7 | 3 | 175 | 5.77 | 68 | 63 | 19.4 |
Histogram calculated using DETX and DETY for each event in the final _common_clean file
| Quadrant A | 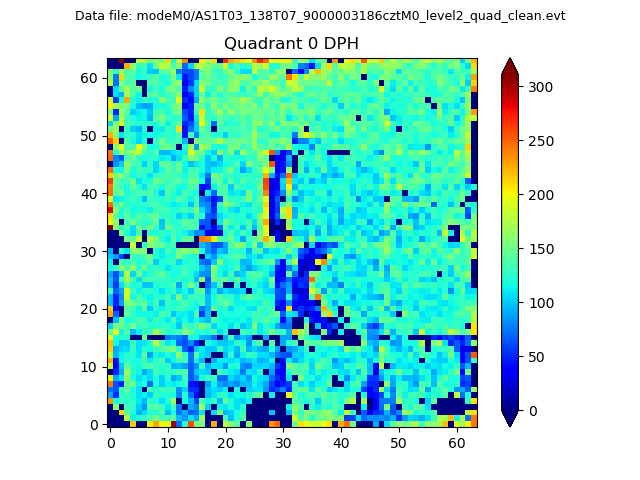 |
 |
Quadrant B |
|---|---|---|---|
| Quadrant D | 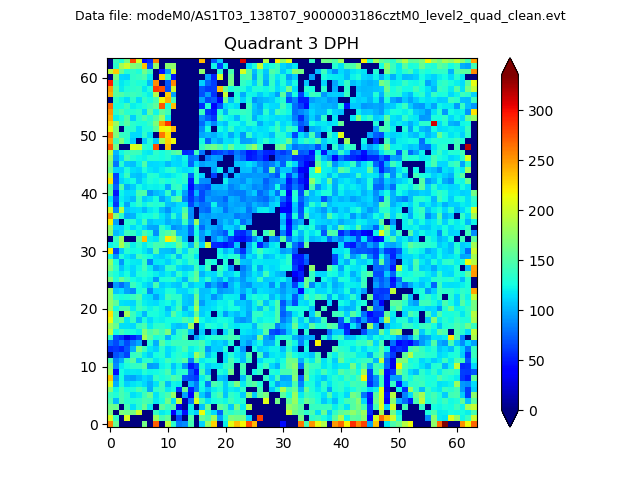 |
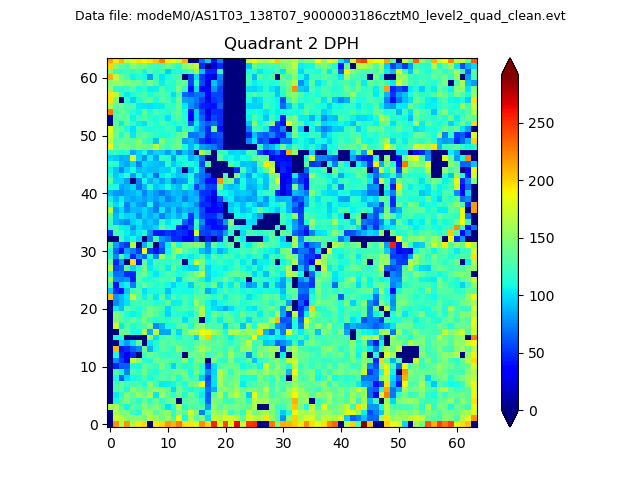 |
Quadrant C |
| Plot type | Count rate plots | Images |
|---|---|---|
| Comparison with Poisson distribution Blue bars denote a histogram of data divided into 1 sec bins. Red curve is a Poisson curve with rate = median count rate of data. |
 |
 |
| Quadrant-wise count rates Data is divided into 100 sec bins |
 |
|
| Module-wise count rates for Quadrant A Data is divided into 100 sec bins |
 |
 |
| Module-wise count rates for Quadrant B Data is divided into 100 sec bins |
 |
 |
| Module-wise count rates for Quadrant C Data is divided into 100 sec bins |
 |
 |
| Module-wise count rates for Quadrant D Data is divided into 100 sec bins |
 |
 |
| Parameter | Plot |
|---|---|
| CZT HV Monitor |  |
| D_VDD | 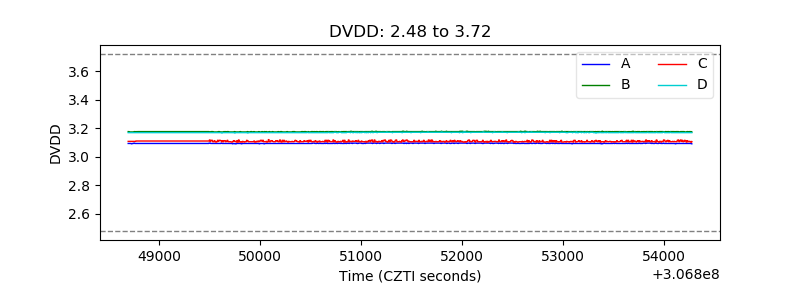 |
| Temperature 1 |  |
| Veto HV Monitor |  |
| Veto LLD |  |
| Alpha Counter |  |
| _CPM_Rate |  |
| CZT Counter |  |
| +2.5 Volts monitor |  |
| +5 Volts monitor |  |
| _ROLL_ROT |  |
| _Roll_DEC |  |
| _Roll_RA |  |
| Veto Counter |  |