| Param | Original file | Final file |
|---|---|---|
| Filename | modeM0/AS1T03_138T07_9000003186_21541cztM0_level2.evt | modeM0/AS1T03_138T07_9000003186_21541cztM0_level2_quad_clean.evt |
| Size (bytes) | 124,266,240 | 12,752,640 |
| Size | 118.5 MB | 12.2 MB |
| Events in quadrant A | 895,241 | 66,936 |
| Events in quadrant B | 914,475 | 69,235 |
| Events in quadrant C | 887,870 | 62,743 |
| Events in quadrant D | 947,221 | 61,329 |
| Mode M0 | |||
|---|---|---|---|
| Quadrant | BADHDUFLAG | Total packets | Discarded packets |
| A | 0 | 3629 | 1 |
| B | 0 | 3704 | 2 |
| C | 0 | 3610 | 1 |
| D | 0 | 3863 | 1 |
| Mode SS | |||
|---|---|---|---|
| Quadrant | BADHDUFLAG | Total packets | Discarded packets |
| A | 0 | 36 | 0 |
| B | 0 | 36 | 0 |
| C | 0 | 36 | 0 |
| D | 0 | 36 | 0 |
| Mode M9 | |||
|---|---|---|---|
| Quadrant | BADHDUFLAG | Total packets | Discarded packets |
| A | 0 | 7 | 0 |
| B | 0 | 7 | 0 |
| C | 0 | 7 | 0 |
| D | 0 | 7 | 0 |
| Quadrant | Total seconds | Saturated seconds | Saturation percentage |
|---|---|---|---|
| A | 1707 | 100 | 5.858231% |
| B | 1706 | 112 | 6.565064% |
| C | 1706 | 113 | 6.623681% |
| D | 1706 | 85 | 4.982415% |
Noise dominated data is calculated using 1-second bins in cleaned event files. If a bin has >2000 counts, and if more than 50% of those come from <1% of pixels, then it is considered to be noise-dominated and hence unusable.
| Quadrant | # 1 sec bins | Bins with >0 counts | Bins with >2000 counts | High rate bins dominated by noise | Noise dominated (total time) | Noise dominated (detector-on time) | Marked lightcurve |
|---|---|---|---|---|---|---|---|
| A | 2407 | 1708 | 0 | 0 | 0.00% | 0.00% | 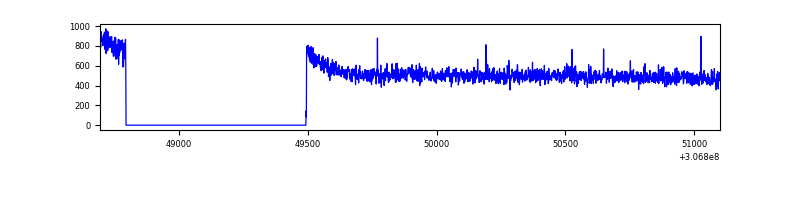 |
| B | 2406 | 1707 | 3 | 3 | 0.12% | 0.18% | 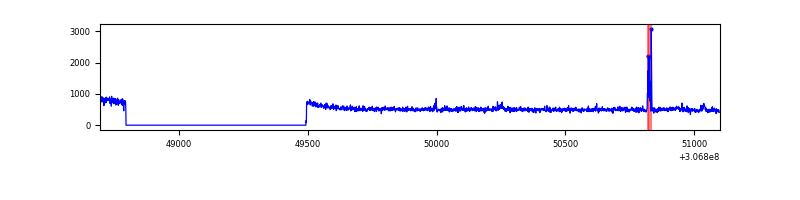 |
| C | 2406 | 1707 | 0 | 0 | 0.00% | 0.00% | 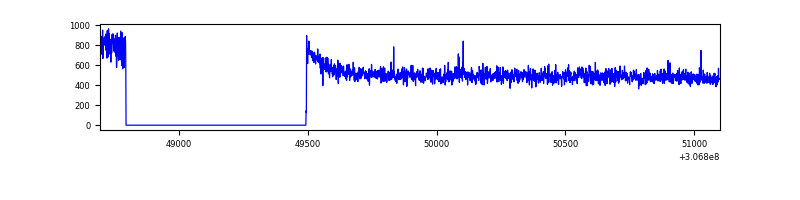 |
| D | 2406 | 1707 | 1 | 1 | 0.04% | 0.06% | 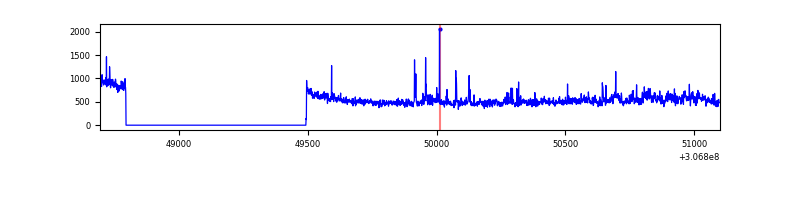 |
Top three noisy pixels from each quadrant. If the there are fewer than three noisy pixels in the level2.evt file, extra rows are filled as -1
| Pixel properties | Quadrant properties | ||||||
|---|---|---|---|---|---|---|---|
| Quadrant | DetID | PixID | Counts | Sigma | Mean | Median | Sigma |
| A | 12 | 96 | 5466 | 106.38 | 230 | 224 | 49.3 |
| A | 13 | 254 | 2563 | 47.47 | 230 | 224 | 49.3 |
| A | 2 | 79 | 2230 | 40.71 | 230 | 224 | 49.3 |
| B | 4 | 190 | 16301 | 343.78 | 226 | 220 | 46.8 |
| B | 12 | 111 | 5681 | 116.75 | 226 | 220 | 46.8 |
| B | 11 | 111 | 5188 | 106.21 | 226 | 220 | 46.8 |
| C | 14 | 238 | 33985 | 645.74 | 215 | 214 | 52.3 |
| C | 8 | 128 | 4948 | 90.52 | 215 | 214 | 52.3 |
| C | 3 | 233 | 4167 | 75.59 | 215 | 214 | 52.3 |
| D | 14 | 35 | 66024 | 1202.31 | 221 | 213 | 54.7 |
| D | 1 | 52 | 18860 | 340.67 | 221 | 213 | 54.7 |
| D | 13 | 104 | 10859 | 194.49 | 221 | 213 | 54.7 |
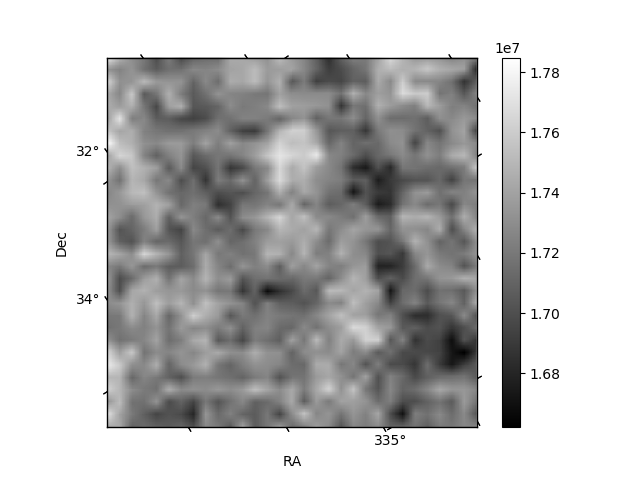
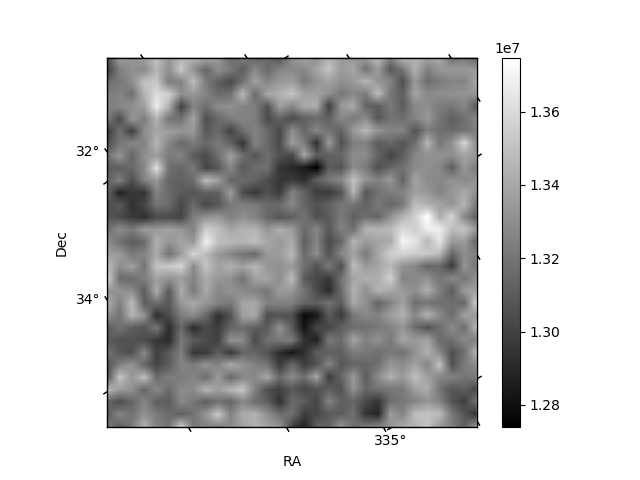
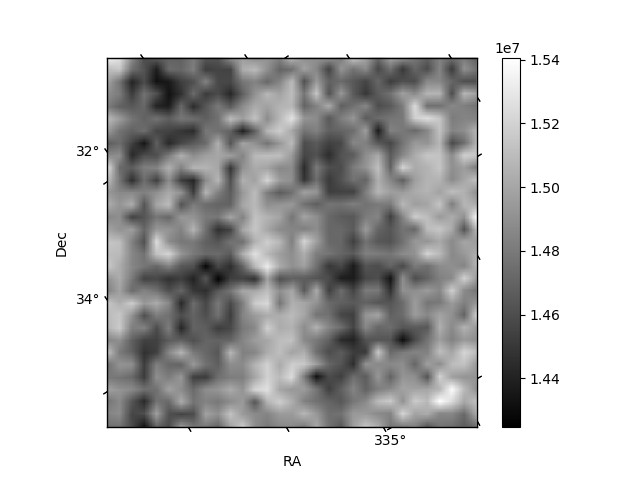
Histogram calculated using DETX and DETY for each event in the final _common_clean file
| Quadrant A | 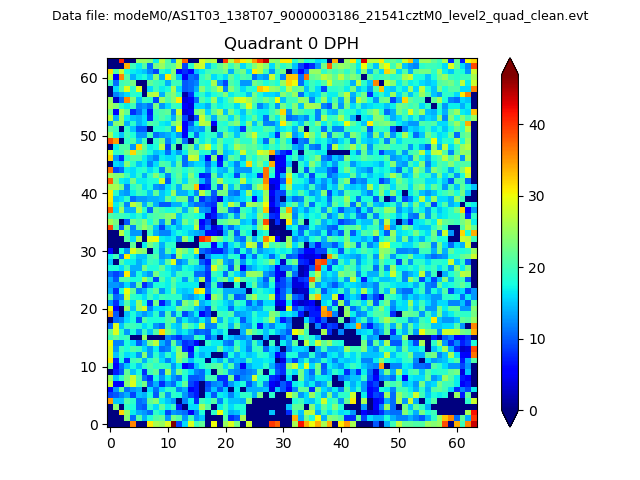 |
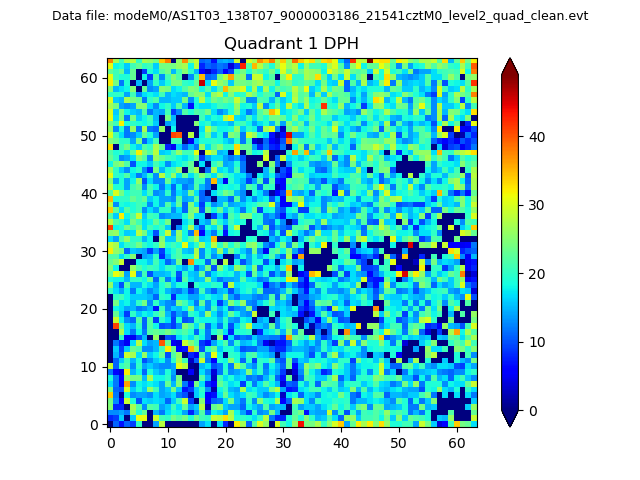 |
Quadrant B |
|---|---|---|---|
| Quadrant D | 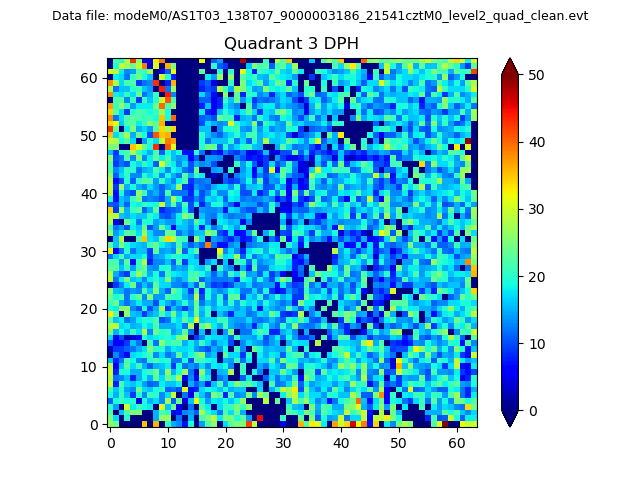 |
 |
Quadrant C |
| Plot type | Count rate plots | Images |
|---|---|---|
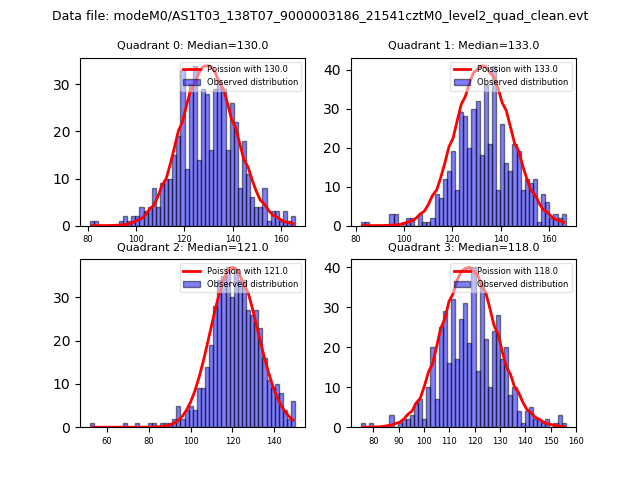
| Comparison with Poisson distribution Blue bars denote a histogram of data divided into 1 sec bins. Red curve is a Poisson curve with rate = median count rate of data. |
 |
 |
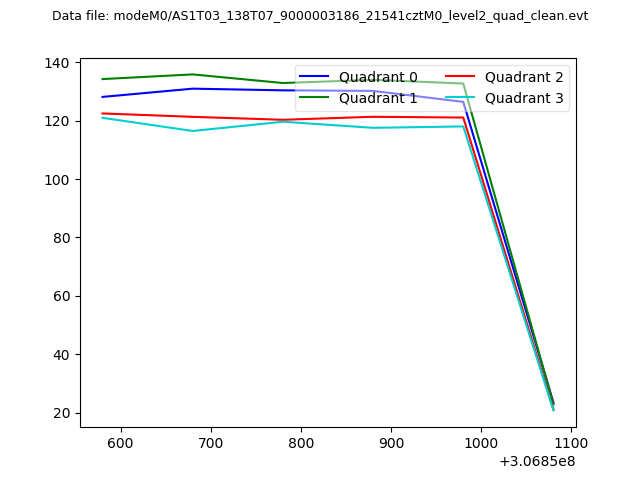
| Quadrant-wise count rates Data is divided into 100 sec bins |
 |
|
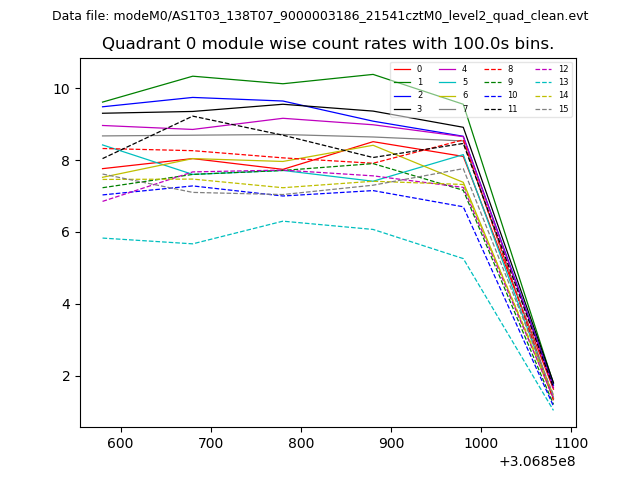
| Module-wise count rates for Quadrant A Data is divided into 100 sec bins |
 |
 |
| Module-wise count rates for Quadrant B Data is divided into 100 sec bins |
 |
 |
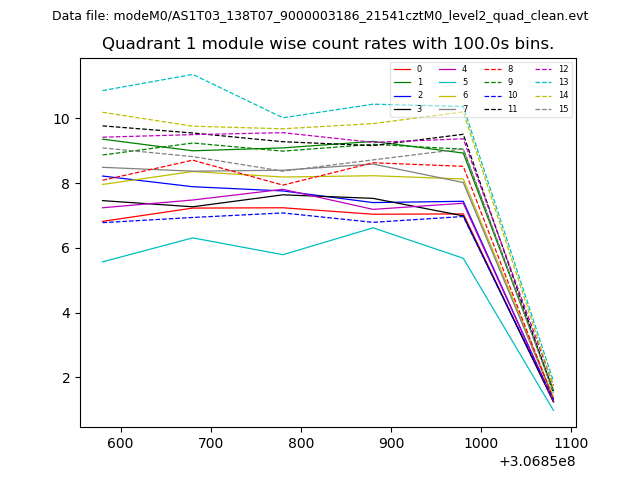
| Module-wise count rates for Quadrant C Data is divided into 100 sec bins |
 |
 |
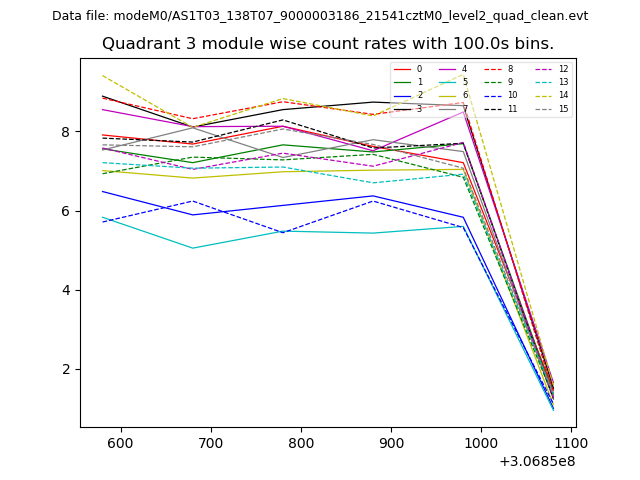
| Module-wise count rates for Quadrant D Data is divided into 100 sec bins |
 |
 |
| Parameter | Plot |
|---|---|
| CZT HV Monitor | 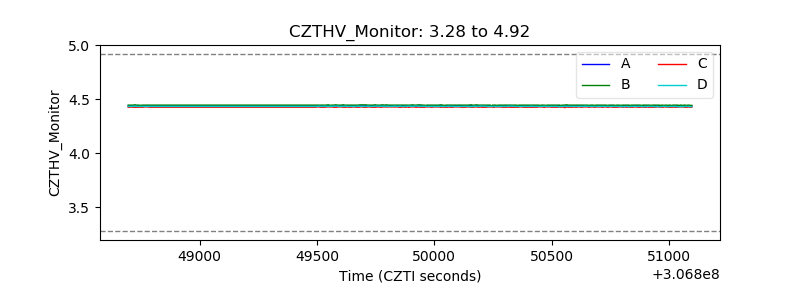 |
| D_VDD | 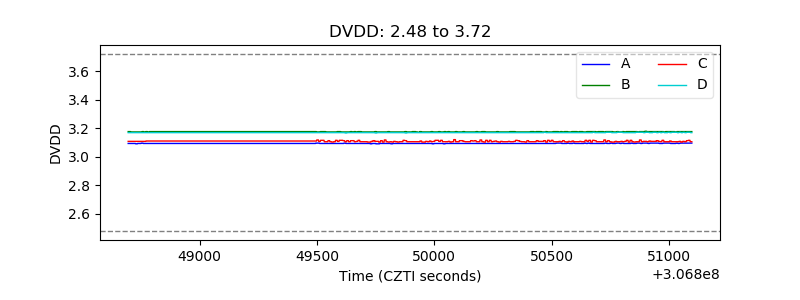 |
| Temperature 1 | 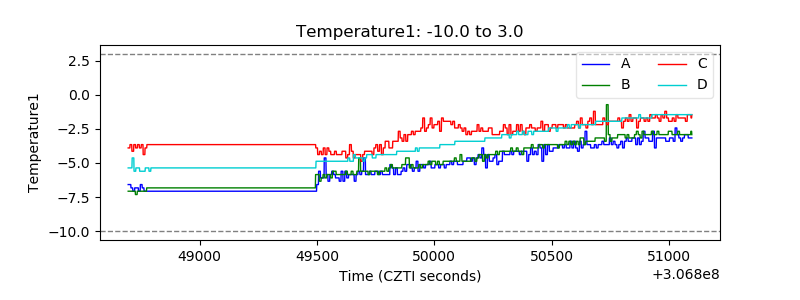 |
| Veto HV Monitor | 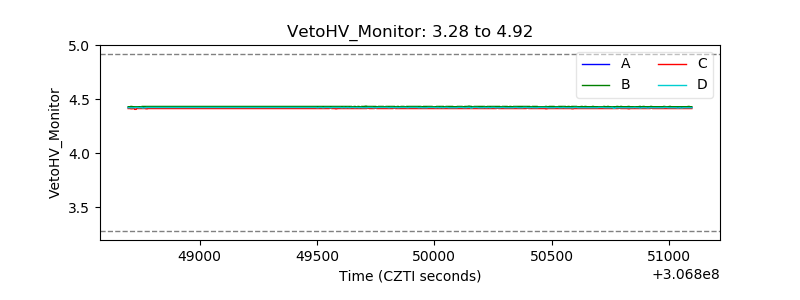 |
| Veto LLD | 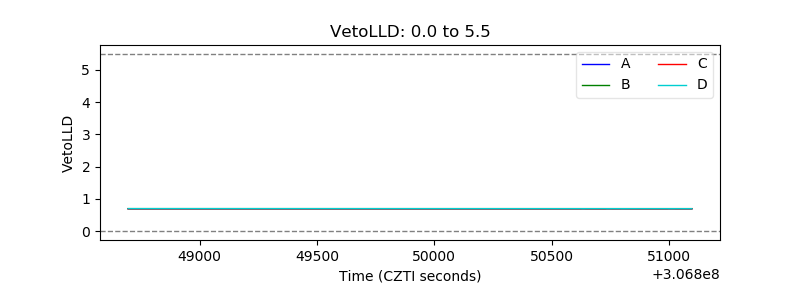 |
| Alpha Counter | 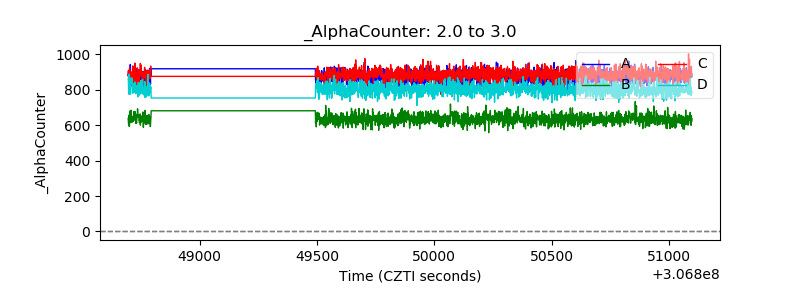 |
| _CPM_Rate | 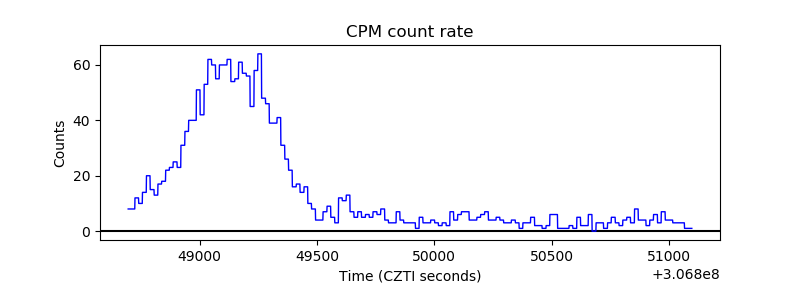 |
| CZT Counter |  |
| +2.5 Volts monitor | 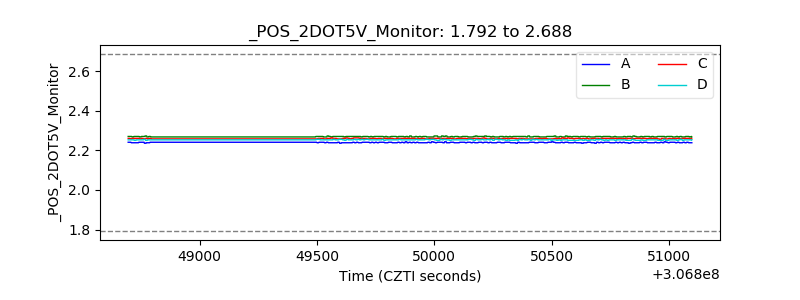 |
| +5 Volts monitor |  |
| _ROLL_ROT | 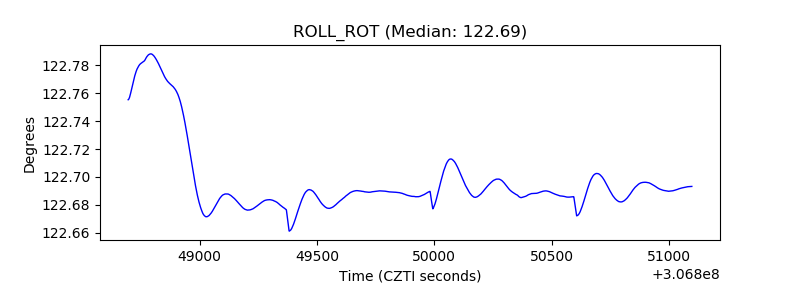 |
| _Roll_DEC | 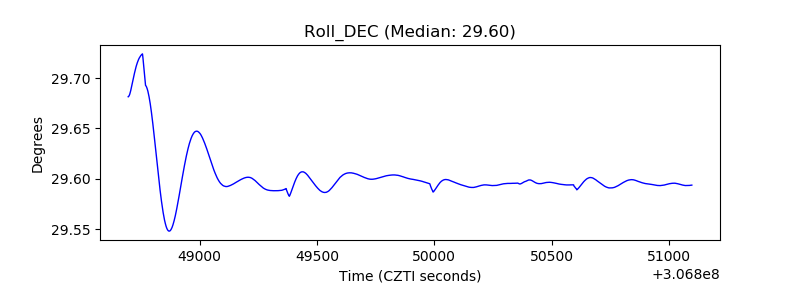 |
| _Roll_RA | 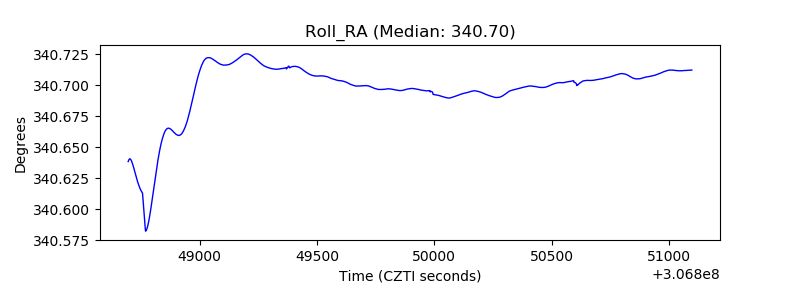 |
| Veto Counter | 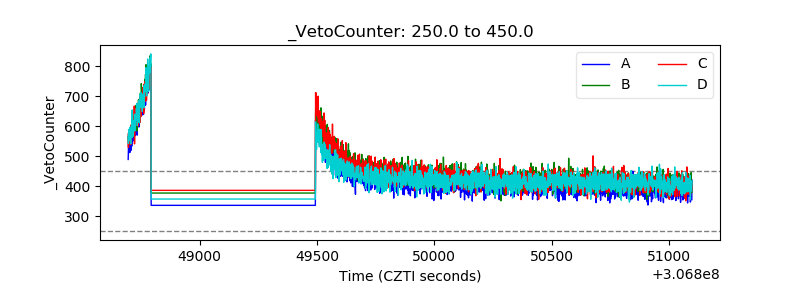 |