| Param | Original file | Final file |
|---|---|---|
| Filename | modeM0/AS1T03_138T07_9000003186_21542cztM0_level2.evt | modeM0/AS1T03_138T07_9000003186_21542cztM0_level2_quad_clean.evt |
| Size (bytes) | 343,284,480 | 72,120,960 |
| Size | 327.4 MB | 68.8 MB |
| Events in quadrant A | 2,235,356 | 472,970 |
| Events in quadrant B | 2,318,594 | 480,383 |
| Events in quadrant C | 2,262,051 | 452,904 |
| Events in quadrant D | 3,252,380 | 439,604 |
| Mode M0 | |||
|---|---|---|---|
| Quadrant | BADHDUFLAG | Total packets | Discarded packets |
| A | 0 | 9811 | 1 |
| B | 0 | 9967 | 1 |
| C | 0 | 9777 | 1 |
| D | 0 | 12823 | 1 |
| Mode SS | |||
|---|---|---|---|
| Quadrant | BADHDUFLAG | Total packets | Discarded packets |
| A | 0 | 98 | 0 |
| B | 0 | 98 | 0 |
| C | 0 | 98 | 0 |
| D | 0 | 98 | 0 |
| Mode M9 | |||
|---|---|---|---|
| Quadrant | BADHDUFLAG | Total packets | Discarded packets |
| A | 0 | 7 | 0 |
| B | 0 | 7 | 0 |
| C | 0 | 7 | 0 |
| D | 0 | 7 | 0 |
| Quadrant | Total seconds | Saturated seconds | Saturation percentage |
|---|---|---|---|
| A | 4815 | 45 | 0.934579% |
| B | 4815 | 54 | 1.121495% |
| C | 4816 | 60 | 1.245847% |
| D | 4816 | 71 | 1.474252% |
Noise dominated data is calculated using 1-second bins in cleaned event files. If a bin has >2000 counts, and if more than 50% of those come from <1% of pixels, then it is considered to be noise-dominated and hence unusable.
| Quadrant | # 1 sec bins | Bins with >0 counts | Bins with >2000 counts | High rate bins dominated by noise | Noise dominated (total time) | Noise dominated (detector-on time) | Marked lightcurve |
|---|---|---|---|---|---|---|---|
| A | 5515 | 4816 | 3 | 3 | 0.05% | 0.06% | 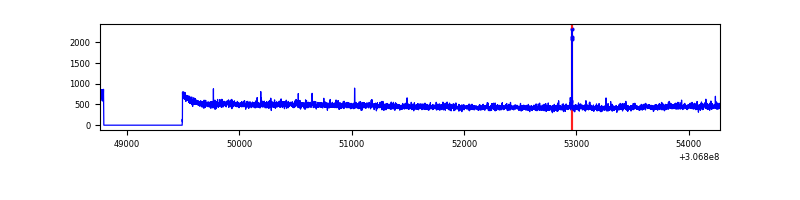 |
| B | 5515 | 4816 | 4 | 4 | 0.07% | 0.08% | 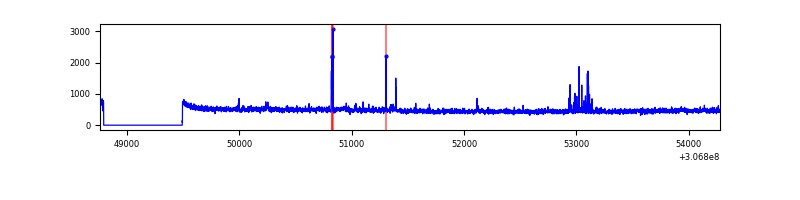 |
| C | 5516 | 4817 | 0 | 0 | 0.00% | 0.00% | 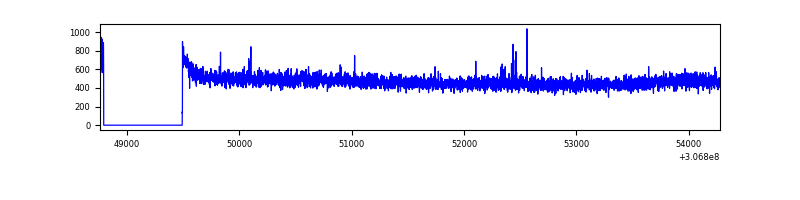 |
| D | 5516 | 4817 | 33 | 33 | 0.60% | 0.69% | 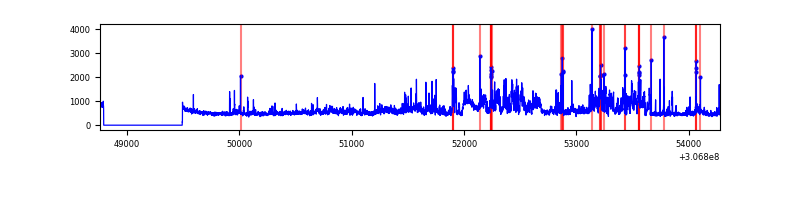 |
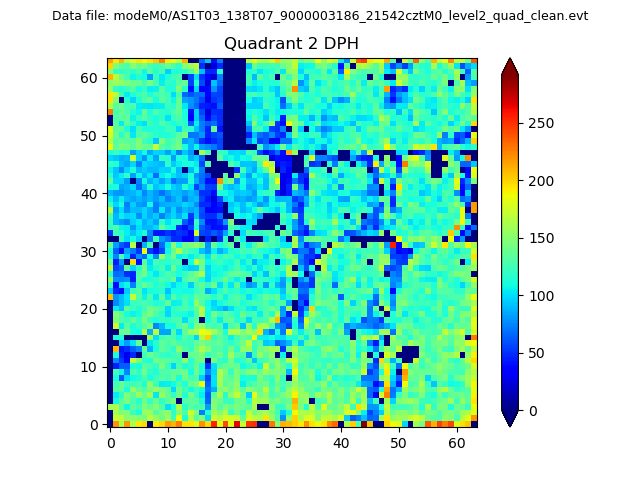
Top three noisy pixels from each quadrant. If the there are fewer than three noisy pixels in the level2.evt file, extra rows are filled as -1
| Pixel properties | Quadrant properties | ||||||
|---|---|---|---|---|---|---|---|
| Quadrant | DetID | PixID | Counts | Sigma | Mean | Median | Sigma |
| A | 12 | 96 | 17496 | 145.68 | 574 | 561 | 116.2 |
| A | 13 | 254 | 7595 | 60.51 | 574 | 561 | 116.2 |
| A | 0 | 226 | 4968 | 37.91 | 574 | 561 | 116.2 |
| B | 0 | 230 | 37868 | 338.48 | 570 | 557 | 110.2 |
| B | 4 | 190 | 16668 | 146.16 | 570 | 557 | 110.2 |
| B | 12 | 111 | 13319 | 115.77 | 570 | 557 | 110.2 |
| C | 14 | 238 | 87544 | 674.16 | 548 | 551 | 129.0 |
| C | 8 | 128 | 11479 | 84.68 | 548 | 551 | 129.0 |
| C | 8 | 112 | 5458 | 38.02 | 548 | 551 | 129.0 |
| D | 1 | 52 | 703267 | 5268.63 | 555 | 541 | 133.4 |
| D | 14 | 35 | 352686 | 2640.18 | 555 | 541 | 133.4 |
| D | 13 | 153 | 34073 | 251.4 | 555 | 541 | 133.4 |
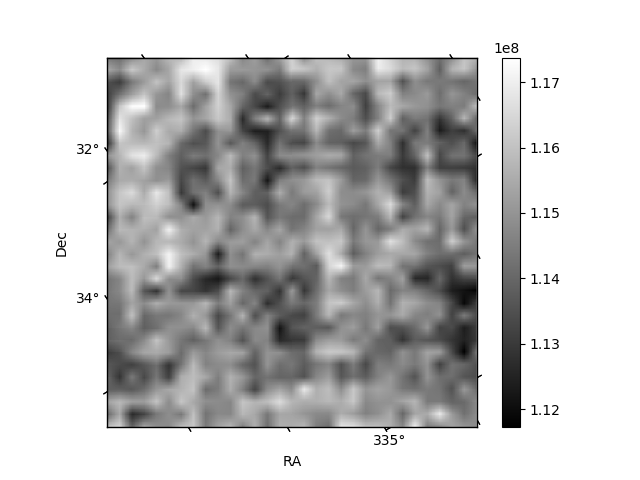
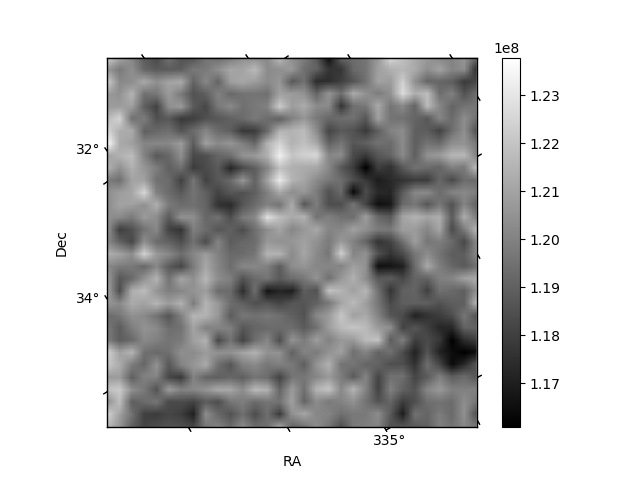
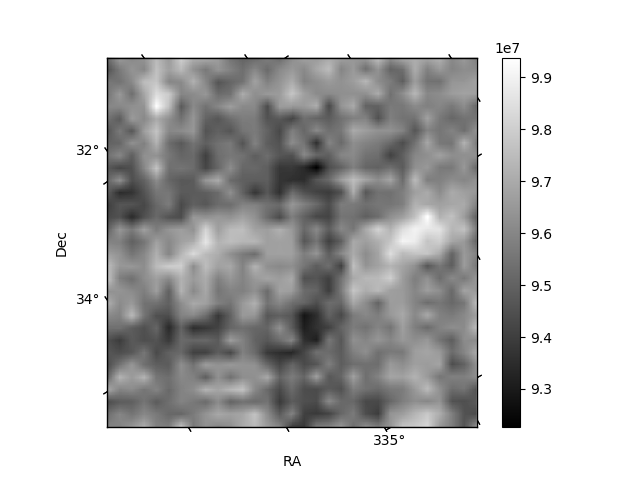
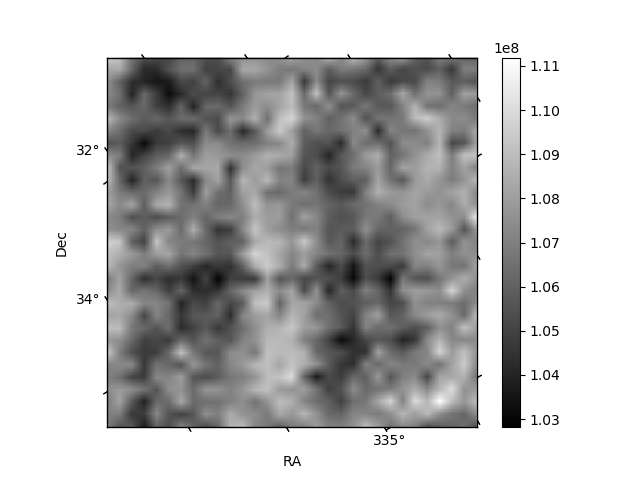
Histogram calculated using DETX and DETY for each event in the final _common_clean file
| Quadrant A | 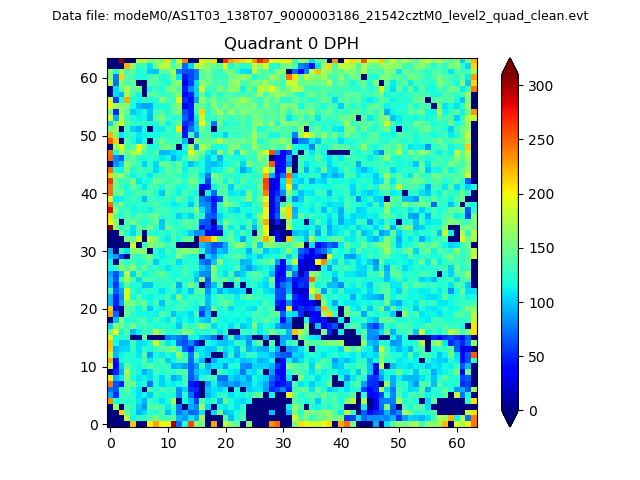 |
 |
Quadrant B |
|---|---|---|---|
| Quadrant D | 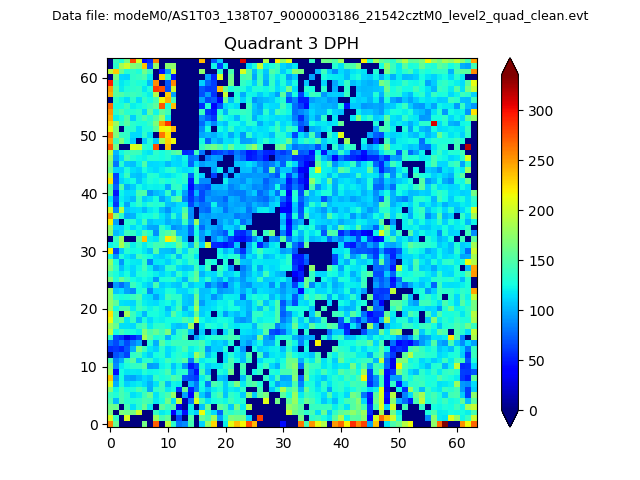 |
 |
Quadrant C |
| Plot type | Count rate plots | Images |
|---|---|---|
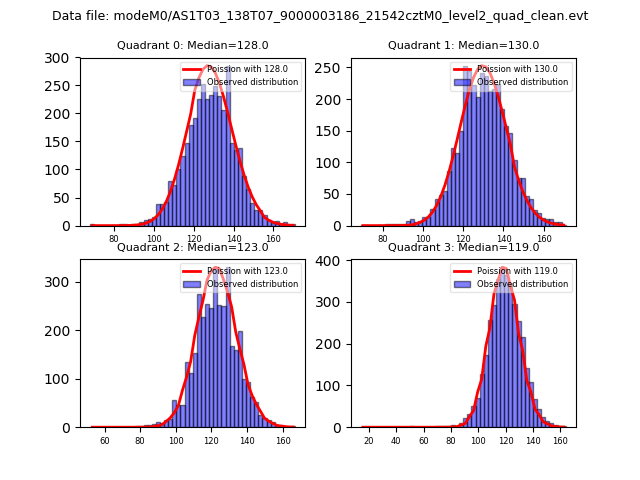
| Comparison with Poisson distribution Blue bars denote a histogram of data divided into 1 sec bins. Red curve is a Poisson curve with rate = median count rate of data. |
 |
 |
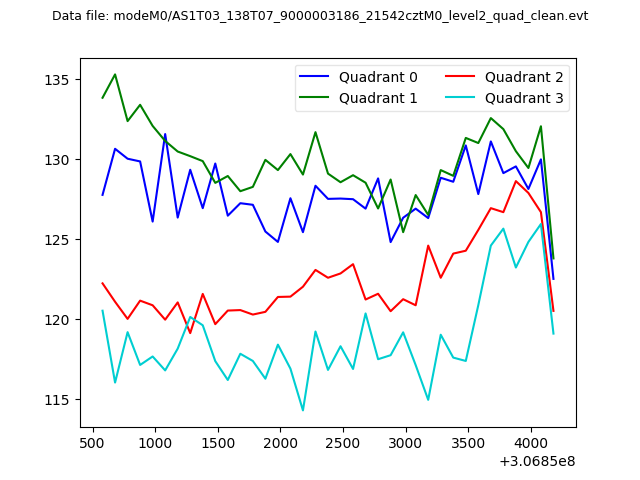
| Quadrant-wise count rates Data is divided into 100 sec bins |
 |
|
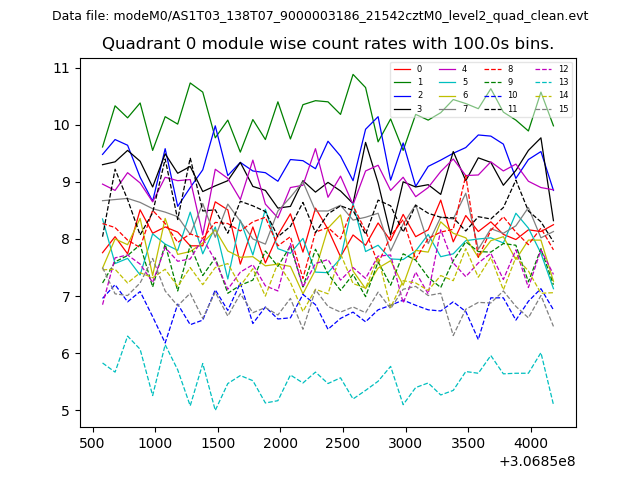
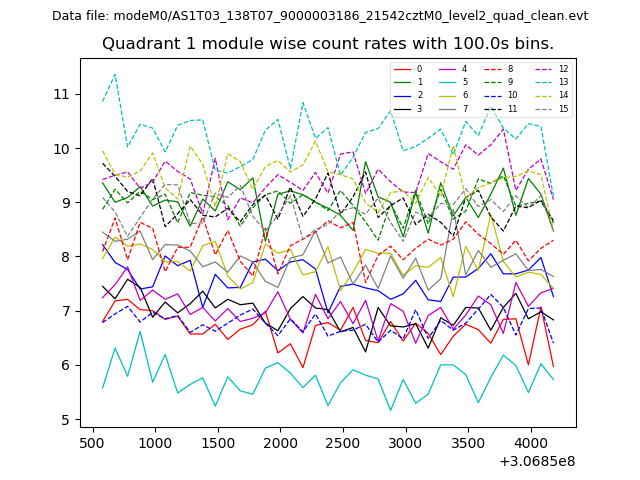
| Module-wise count rates for Quadrant A Data is divided into 100 sec bins |
 |
 |
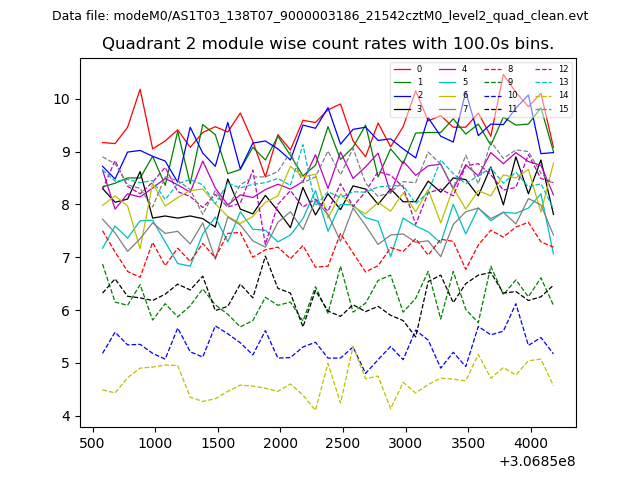
| Module-wise count rates for Quadrant B Data is divided into 100 sec bins |
 |
 |
| Module-wise count rates for Quadrant C Data is divided into 100 sec bins |
 |
 |
| Module-wise count rates for Quadrant D Data is divided into 100 sec bins |
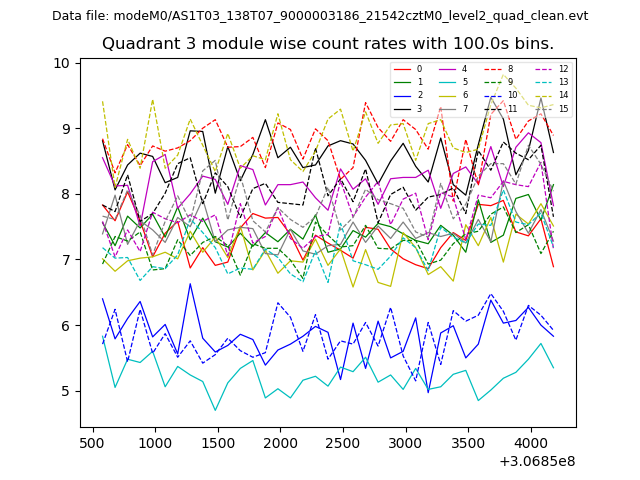 |
 |
| Parameter | Plot |
|---|---|
| CZT HV Monitor | 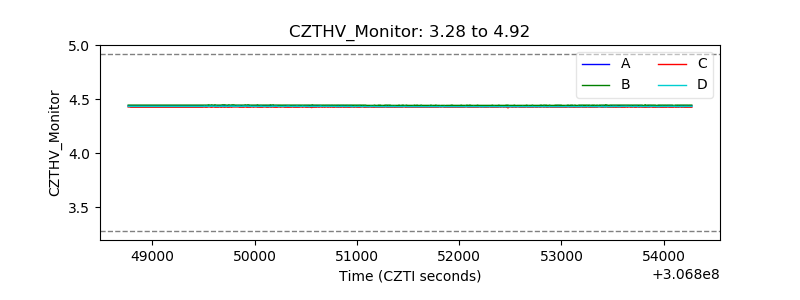 |
| D_VDD | 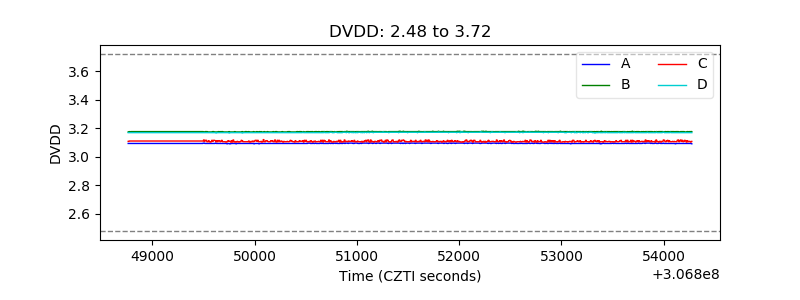 |
| Temperature 1 | 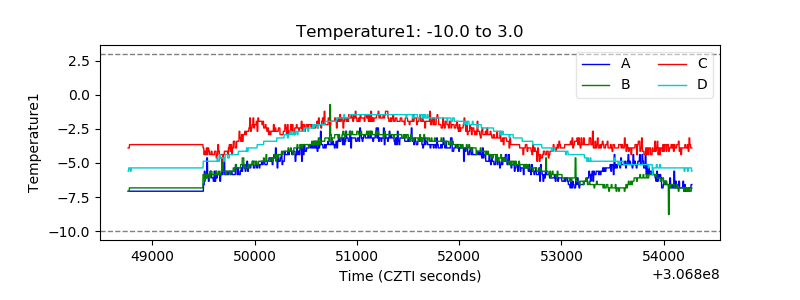 |
| Veto HV Monitor | 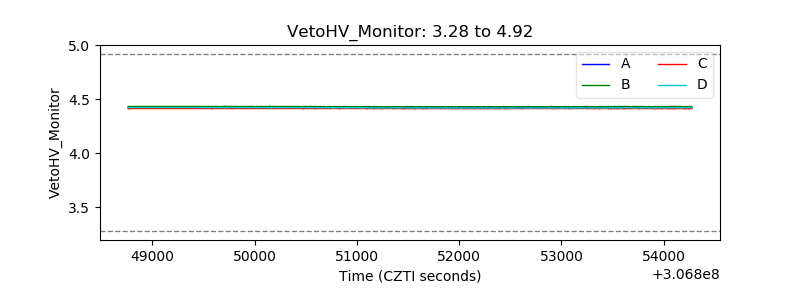 |
| Veto LLD | 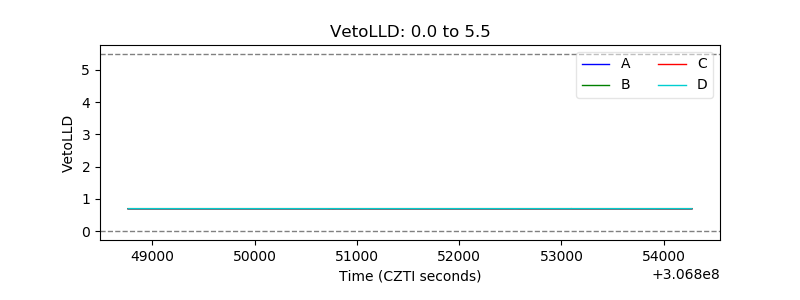 |
| Alpha Counter | 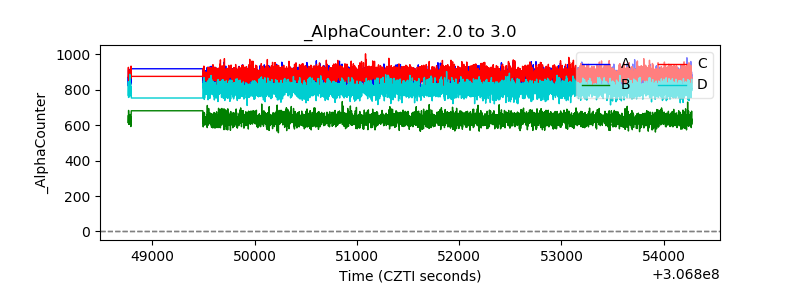 |
| _CPM_Rate | 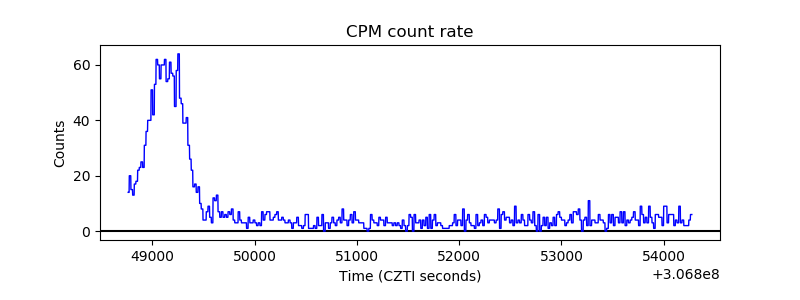 |
| CZT Counter |  |
| +2.5 Volts monitor |  |
| +5 Volts monitor | 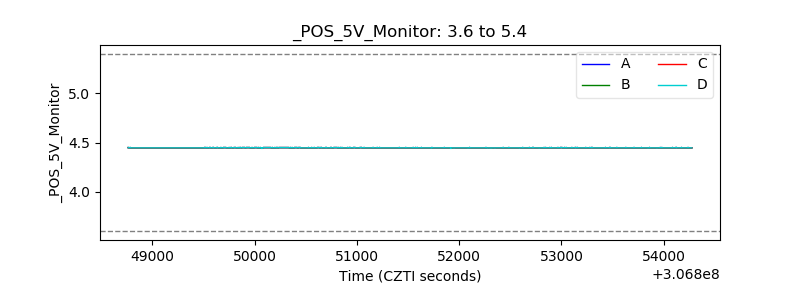 |
| _ROLL_ROT | 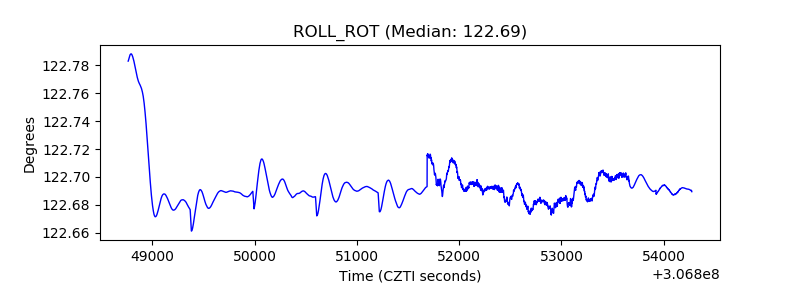 |
| _Roll_DEC | 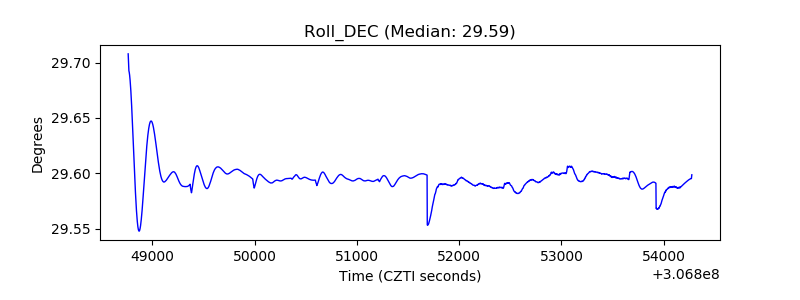 |
| _Roll_RA |  |
| Veto Counter | 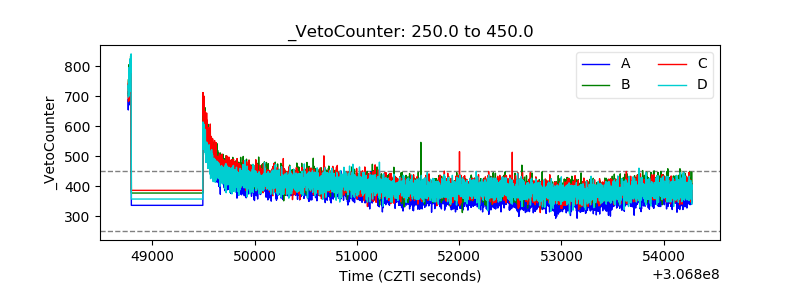 |