| Param | Original file | Final file |
|---|---|---|
| Filename | modeM0/AS1T03_138T08_9000003188cztM0_level2.fits | modeM0/AS1T03_138T08_9000003188cztM0_level2_quad_clean.evt |
| Size (bytes) | 50,947,200 | 46,221,120 |
| Size | 48.6 MB | 44.1 MB |
| Events in quadrant A | 310,642 | 270,331 |
| Events in quadrant B | 298,924 | 272,298 |
| Events in quadrant C | 299,368 | 258,126 |
| Events in quadrant D | 259,642 | 223,892 |
| Mode M9 | |||
|---|---|---|---|
| Quadrant | BADHDUFLAG | Total packets | Discarded packets |
| A | 0 | 2 | 0 |
| B | 0 | 2 | 0 |
| C | 0 | 2 | 0 |
| D | 0 | 2 | 0 |
| Mode M0 | |||
|---|---|---|---|
| Quadrant | BADHDUFLAG | Total packets | Discarded packets |
| A | 0 | 11160 | 0 |
| B | 0 | 11138 | 0 |
| C | 0 | 11214 | 0 |
| D | 0 | 13790 | 0 |
| Mode SS | |||
|---|---|---|---|
| Quadrant | BADHDUFLAG | Total packets | Discarded packets |
| A | 0 | 108 | 0 |
| B | 0 | 108 | 0 |
| C | 0 | 108 | 0 |
| D | 0 | 108 | 0 |
| Quadrant | Total seconds | Saturated seconds | Saturation percentage |
|---|---|---|---|
| A | 5347 | 135 | 2.524780% |
| B | 5347 | 147 | 2.749205% |
| C | 5347 | 165 | 3.085843% |
| D | 5347 | 305 | 5.704133% |
Noise dominated data is calculated using 1-second bins in cleaned event files. If a bin has >2000 counts, and if more than 50% of those come from <1% of pixels, then it is considered to be noise-dominated and hence unusable.
| Quadrant | # 1 sec bins | Bins with >0 counts | Bins with >2000 counts | High rate bins dominated by noise | Noise dominated (total time) | Noise dominated (detector-on time) | Marked lightcurve |
|---|---|---|---|---|---|---|---|
| A | 5582 | 5347 | 0 | 0 | 0.00% | 0.00% | 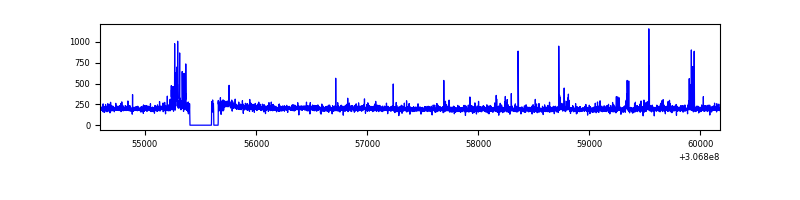 |
| B | 5582 | 5347 | 0 | 0 | 0.00% | 0.00% |  |
| C | 5582 | 5347 | 0 | 0 | 0.00% | 0.00% |  |
| D | 5582 | 5347 | 0 | 0 | 0.00% | 0.00% | 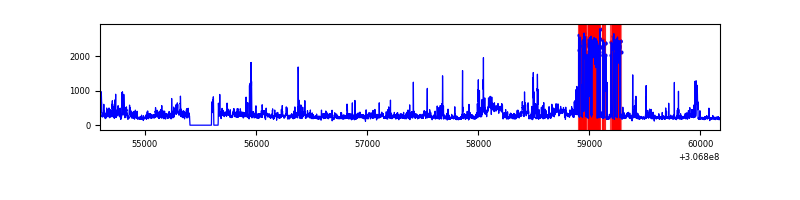 |
Top three noisy pixels from each quadrant. If the there are fewer than three noisy pixels in the level2.evt file, extra rows are filled as -1
| Pixel properties | Quadrant properties | ||||||
|---|---|---|---|---|---|---|---|
| Quadrant | DetID | PixID | Counts | Sigma | Mean | Median | Sigma |
| A | 14 | 188 | 297 | 10.07 | 80 | 75 | 22.0 |
| A | 14 | 204 | 275 | 9.08 | 80 | 75 | 22.0 |
| A | 0 | 29 | 273 | 8.98 | 80 | 75 | 22.0 |
| B | 2 | 9 | 221 | 8.25 | 78 | 75 | 17.7 |
| B | 5 | 232 | 209 | 7.57 | 78 | 75 | 17.7 |
| B | 2 | 8 | 209 | 7.57 | 78 | 75 | 17.7 |
| C | 3 | 126 | 238 | 7.52 | 79 | 74 | 21.8 |
| C | 3 | 235 | 211 | 6.28 | 79 | 74 | 21.8 |
| C | 12 | 242 | 208 | 6.14 | 79 | 74 | 21.8 |
| D | 10 | 113 | 195 | 6.07 | 74 | 67 | 21.1 |
| D | 1 | 19 | 193 | 5.98 | 74 | 67 | 21.1 |
| D | 10 | 189 | 189 | 5.79 | 74 | 67 | 21.1 |
Histogram calculated using DETX and DETY for each event in the final _common_clean file
| Quadrant A | 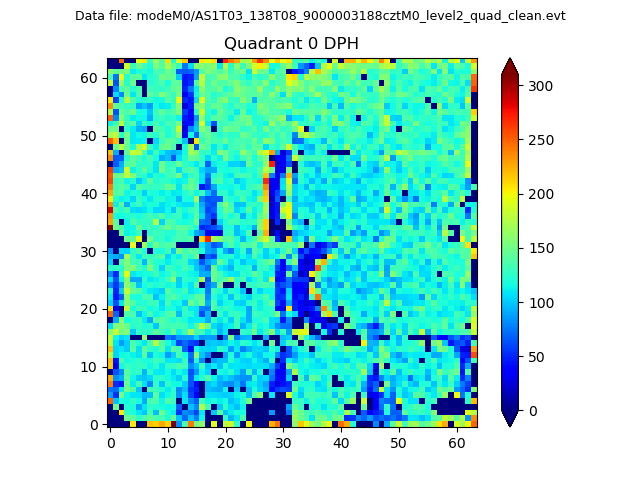 |
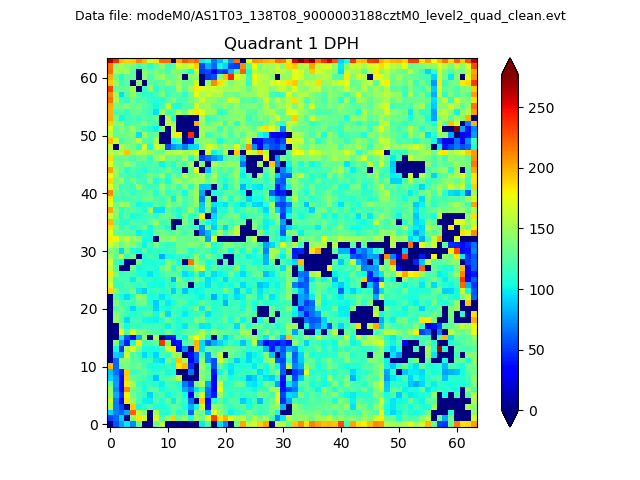 |
Quadrant B |
|---|---|---|---|
| Quadrant D | 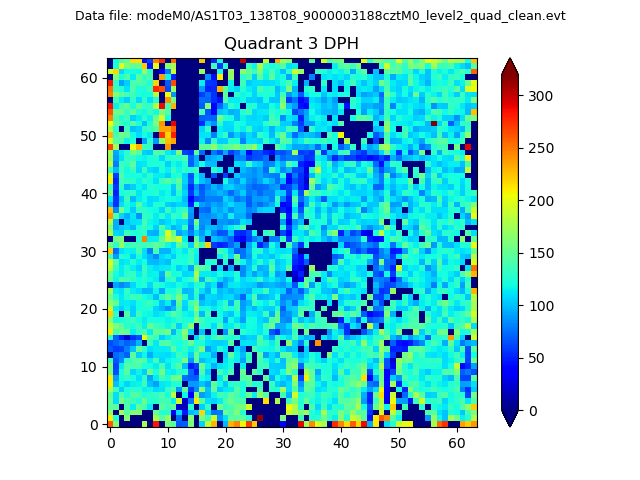 |
 |
Quadrant C |
| Plot type | Count rate plots | Images |
|---|---|---|
| Comparison with Poisson distribution Blue bars denote a histogram of data divided into 1 sec bins. Red curve is a Poisson curve with rate = median count rate of data. |
 |
 |
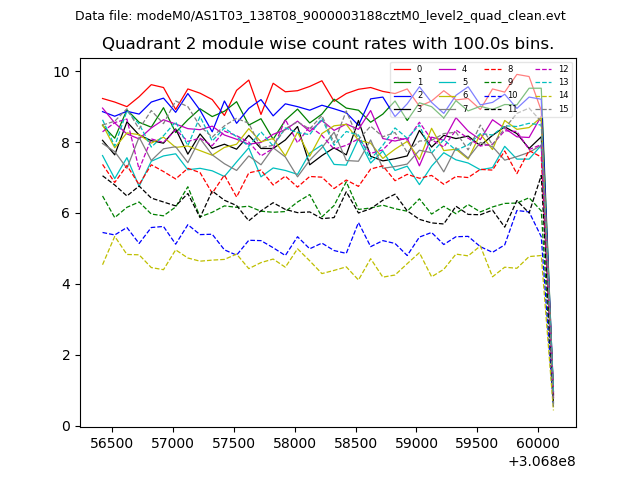
| Quadrant-wise count rates Data is divided into 100 sec bins |
 |
|
| Module-wise count rates for Quadrant A Data is divided into 100 sec bins |
 |
 |
| Module-wise count rates for Quadrant B Data is divided into 100 sec bins |
 |
 |
| Module-wise count rates for Quadrant C Data is divided into 100 sec bins |
 |
 |
| Module-wise count rates for Quadrant D Data is divided into 100 sec bins |
 |
 |
| Parameter | Plot |
|---|---|
| CZT HV Monitor | 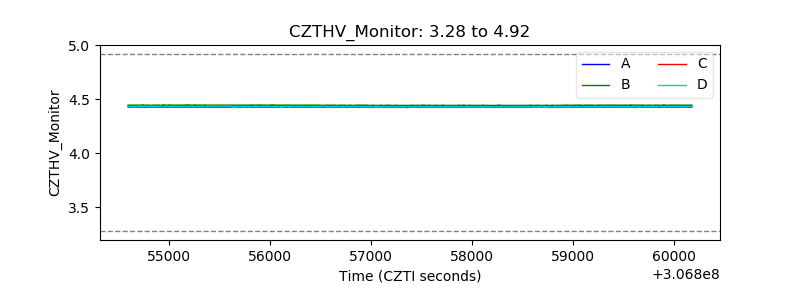 |
| D_VDD |  |
| Temperature 1 |  |
| Veto HV Monitor |  |
| Veto LLD |  |
| Alpha Counter |  |
| _CPM_Rate |  |
| CZT Counter |  |
| +2.5 Volts monitor |  |
| +5 Volts monitor |  |
| _ROLL_ROT |  |
| _Roll_DEC |  |
| _Roll_RA |  |
| Veto Counter | 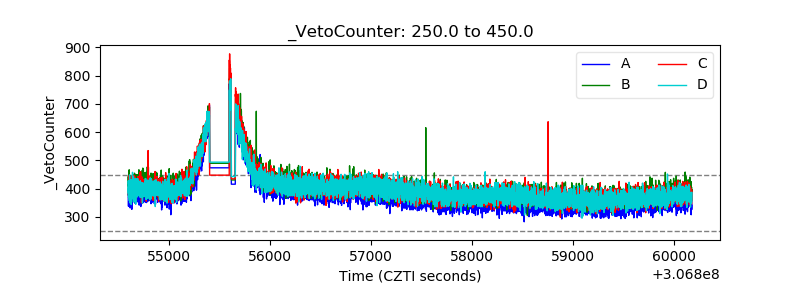 |