| Param | Original file | Final file |
|---|---|---|
| Filename | modeM0/AS1T03_138T08_9000003188_21543cztM0_level2.evt | modeM0/AS1T03_138T08_9000003188_21543cztM0_level2_quad_clean.evt |
| Size (bytes) | 258,638,400 | 68,630,400 |
| Size | 246.7 MB | 65.5 MB |
| Events in quadrant A | 1,680,037 | 462,981 |
| Events in quadrant B | 1,711,944 | 471,568 |
| Events in quadrant C | 1,725,497 | 447,316 |
| Events in quadrant D | 2,457,786 | 430,405 |
| Mode M0 | |||
|---|---|---|---|
| Quadrant | BADHDUFLAG | Total packets | Discarded packets |
| A | 0 | 7595 | 0 |
| B | 0 | 7631 | 0 |
| C | 0 | 7638 | 0 |
| D | 0 | 9741 | 0 |
| Mode SS | |||
|---|---|---|---|
| Quadrant | BADHDUFLAG | Total packets | Discarded packets |
| A | 0 | 74 | 0 |
| B | 0 | 74 | 0 |
| C | 0 | 74 | 0 |
| D | 0 | 74 | 0 |
| Quadrant | Total seconds | Saturated seconds | Saturation percentage |
|---|---|---|---|
| A | 3766 | 1 | 0.026553% |
| B | 3767 | 3 | 0.079639% |
| C | 3767 | 10 | 0.265463% |
| D | 3767 | 183 | 4.857977% |
Noise dominated data is calculated using 1-second bins in cleaned event files. If a bin has >2000 counts, and if more than 50% of those come from <1% of pixels, then it is considered to be noise-dominated and hence unusable.
| Quadrant | # 1 sec bins | Bins with >0 counts | Bins with >2000 counts | High rate bins dominated by noise | Noise dominated (total time) | Noise dominated (detector-on time) | Marked lightcurve |
|---|---|---|---|---|---|---|---|
| A | 3766 | 3766 | 0 | 0 | 0.00% | 0.00% | 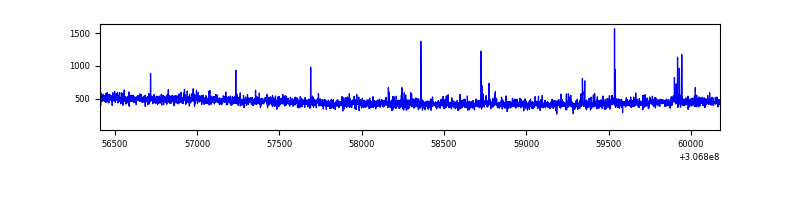 |
| B | 3767 | 3767 | 0 | 0 | 0.00% | 0.00% | 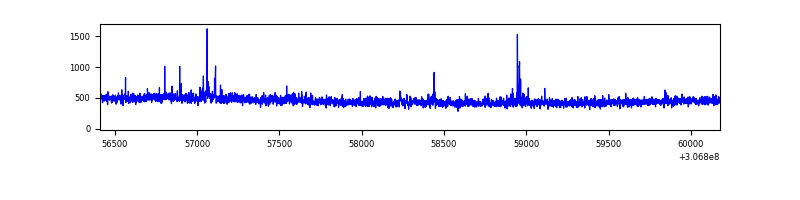 |
| C | 3767 | 3767 | 0 | 0 | 0.00% | 0.00% | 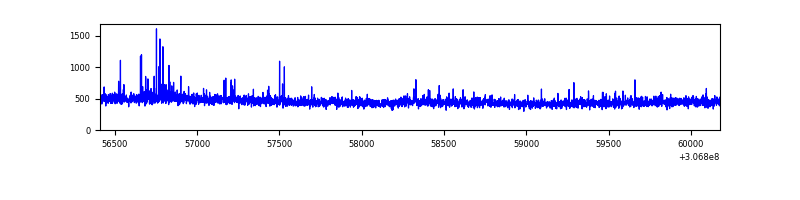 |
| D | 3767 | 3767 | 198 | 198 | 5.26% | 5.26% | 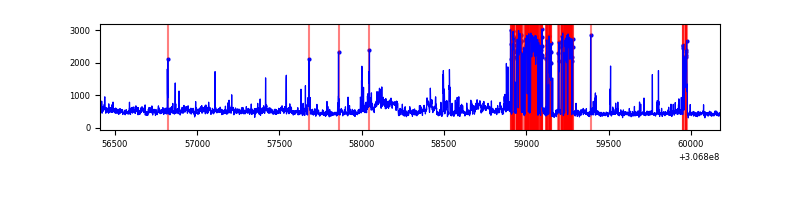 |
Top three noisy pixels from each quadrant. If the there are fewer than three noisy pixels in the level2.evt file, extra rows are filled as -1
| Pixel properties | Quadrant properties | ||||||
|---|---|---|---|---|---|---|---|
| Quadrant | DetID | PixID | Counts | Sigma | Mean | Median | Sigma |
| A | 4 | 2 | 24935 | 279.69 | 427 | 418 | 87.7 |
| A | 13 | 254 | 5350 | 56.26 | 427 | 418 | 87.7 |
| A | 12 | 96 | 5337 | 56.12 | 427 | 418 | 87.7 |
| B | 0 | 230 | 22470 | 268.37 | 425 | 415 | 82.2 |
| B | 0 | 190 | 12426 | 146.15 | 425 | 415 | 82.2 |
| B | 12 | 111 | 9660 | 112.5 | 425 | 415 | 82.2 |
| C | 14 | 238 | 64670 | 652.36 | 413 | 416 | 98.5 |
| C | 0 | 239 | 34505 | 346.1 | 413 | 416 | 98.5 |
| C | 8 | 128 | 7430 | 71.21 | 413 | 416 | 98.5 |
| D | 1 | 52 | 584694 | 5843.49 | 412 | 400 | 100.0 |
| D | 14 | 35 | 140598 | 1402.11 | 412 | 400 | 100.0 |
| D | 13 | 153 | 140158 | 1397.71 | 412 | 400 | 100.0 |
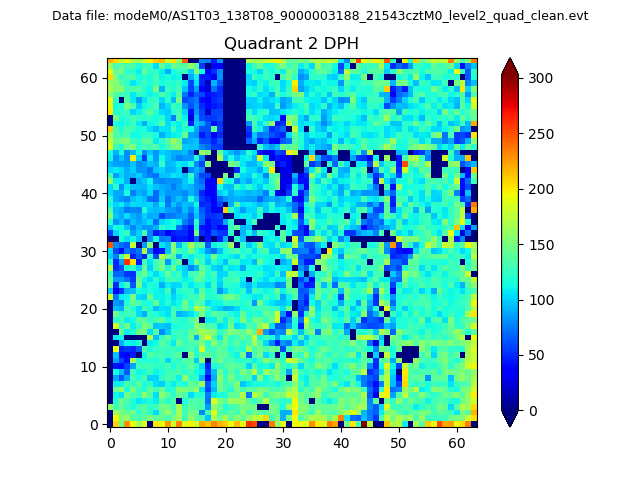
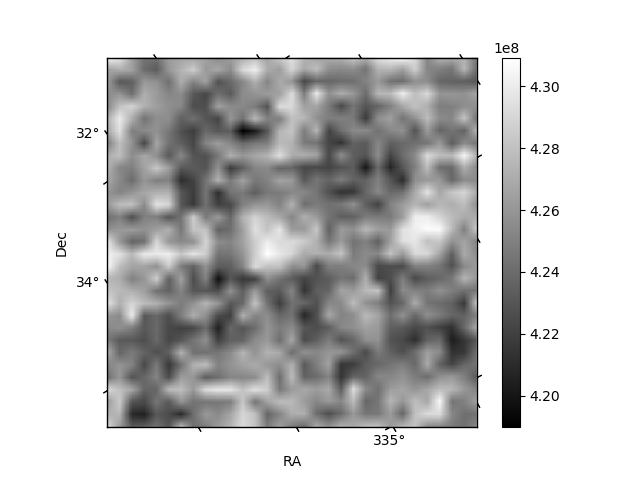
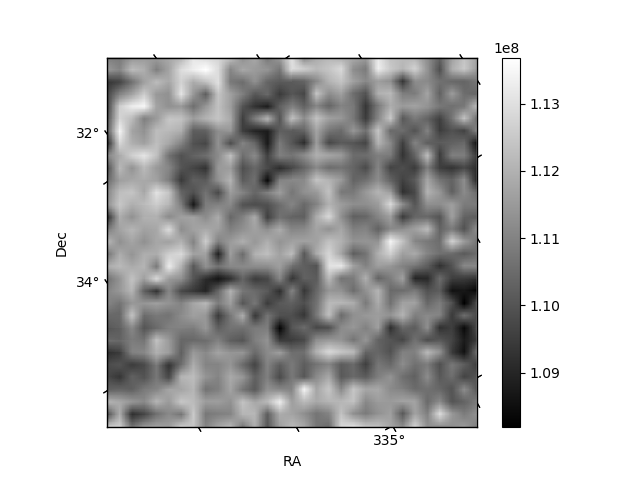
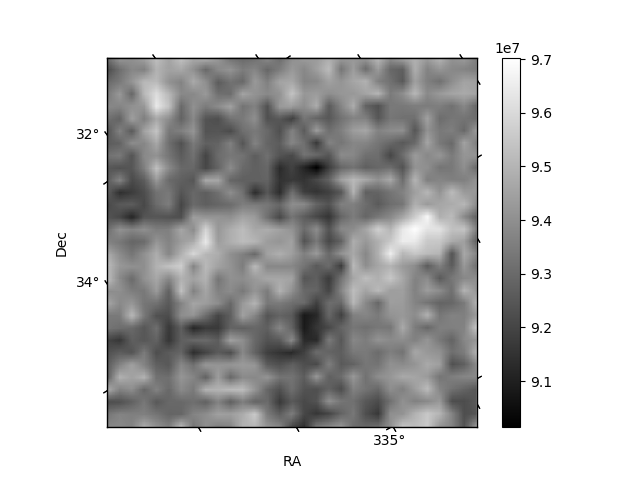
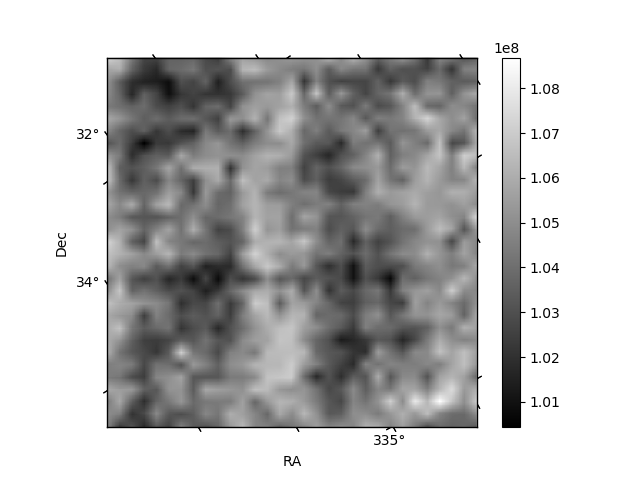
Histogram calculated using DETX and DETY for each event in the final _common_clean file
| Quadrant A | 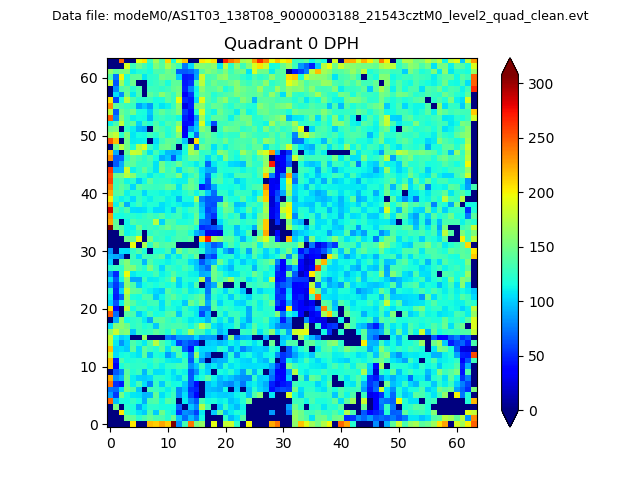 |
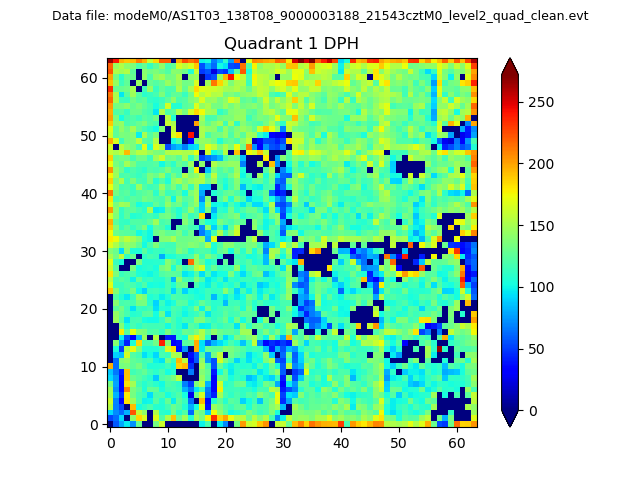 |
Quadrant B |
|---|---|---|---|
| Quadrant D | 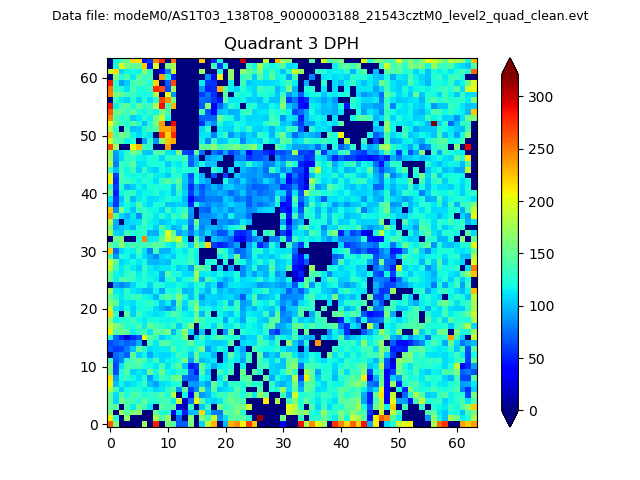 |
 |
Quadrant C |
| Plot type | Count rate plots | Images |
|---|---|---|
| Comparison with Poisson distribution Blue bars denote a histogram of data divided into 1 sec bins. Red curve is a Poisson curve with rate = median count rate of data. |
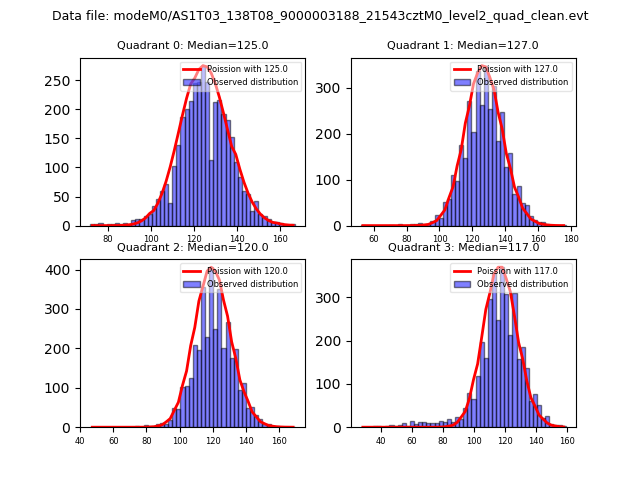 |
 |
| Quadrant-wise count rates Data is divided into 100 sec bins |
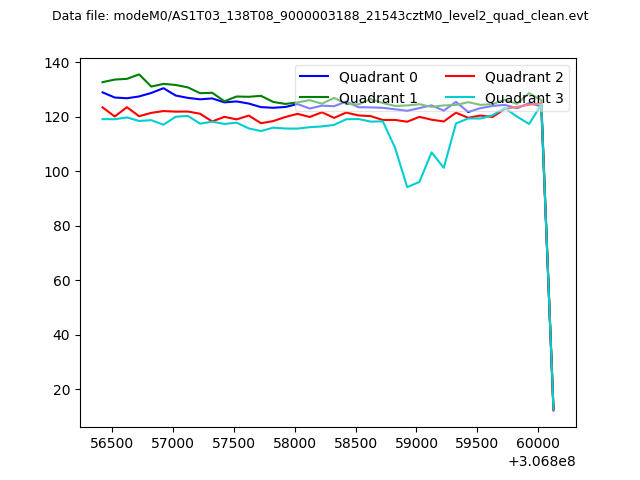 |
|
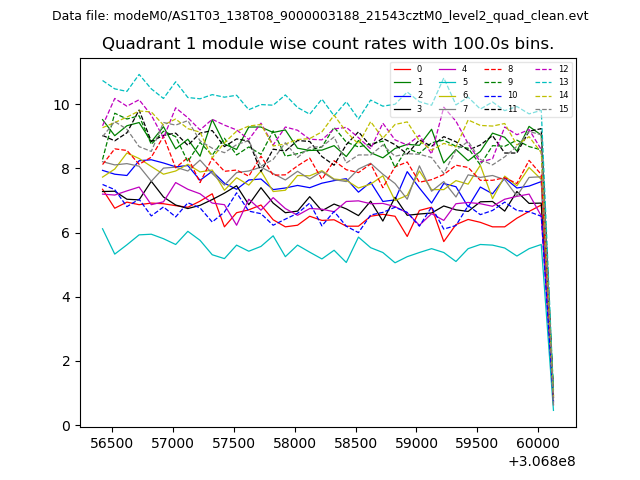
| Module-wise count rates for Quadrant A Data is divided into 100 sec bins |
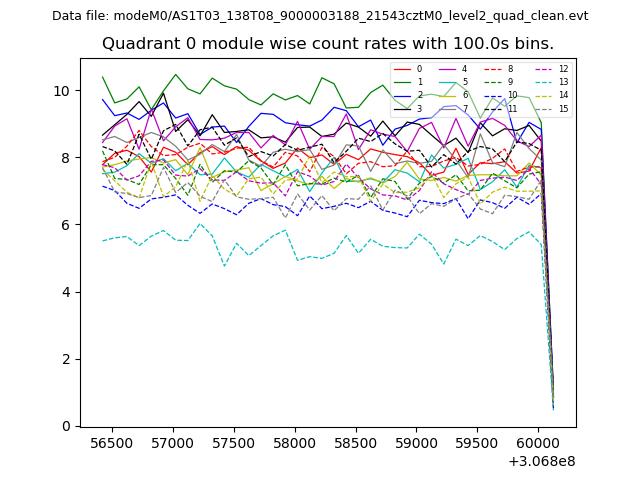 |
 |
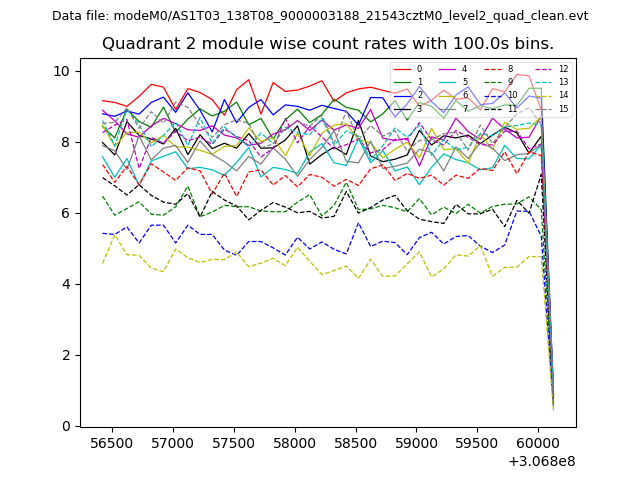
| Module-wise count rates for Quadrant B Data is divided into 100 sec bins |
 |
 |
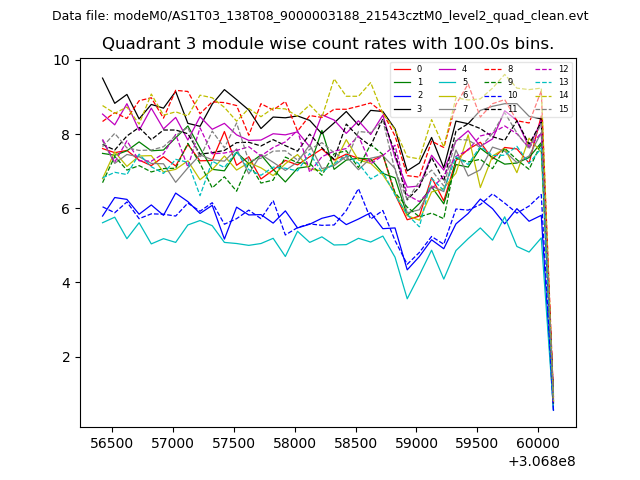
| Module-wise count rates for Quadrant C Data is divided into 100 sec bins |
 |
 |
| Module-wise count rates for Quadrant D Data is divided into 100 sec bins |
 |
 |
| Parameter | Plot |
|---|---|
| CZT HV Monitor | 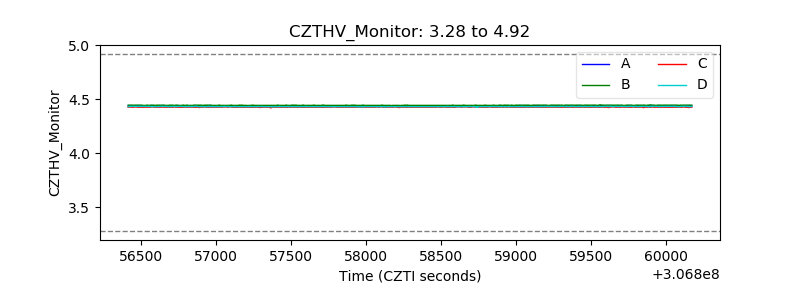 |
| D_VDD | 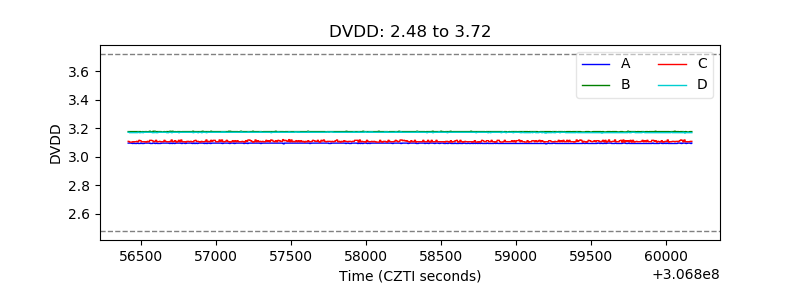 |
| Temperature 1 |  |
| Veto HV Monitor | 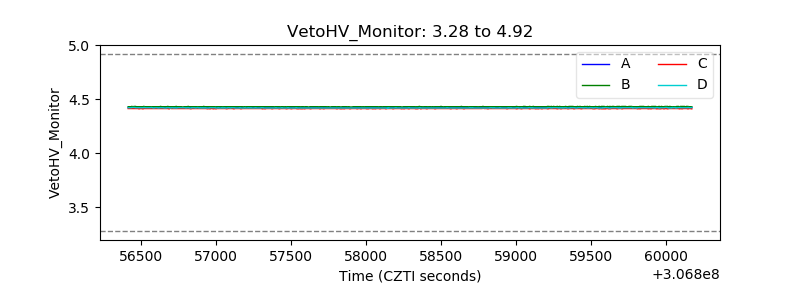 |
| Veto LLD | 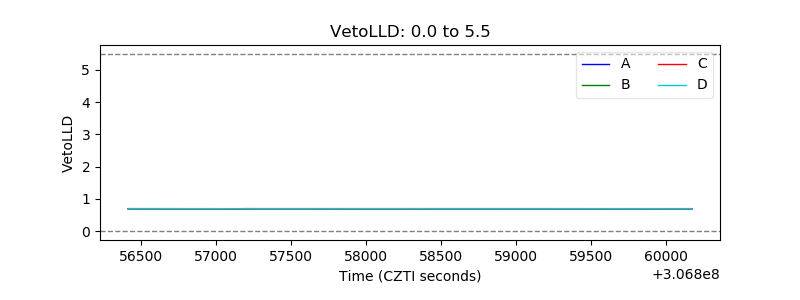 |
| Alpha Counter | 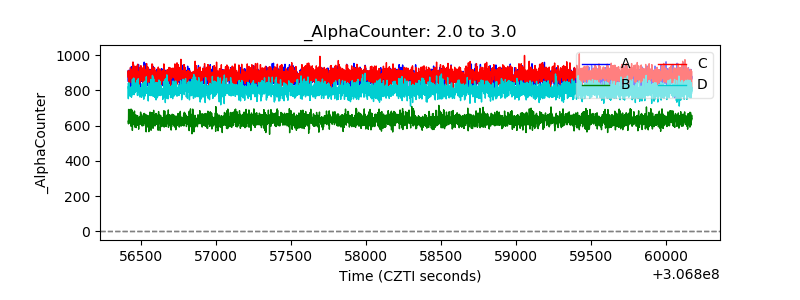 |
| _CPM_Rate | 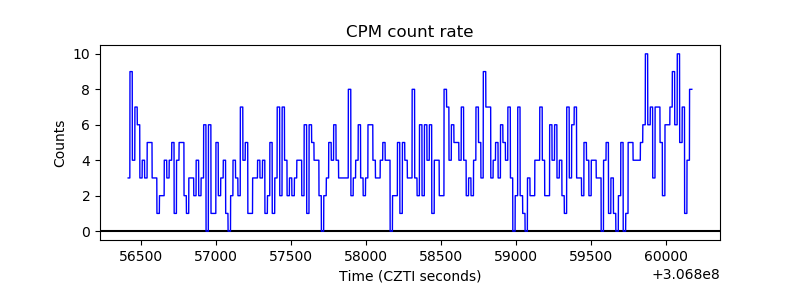 |
| CZT Counter | 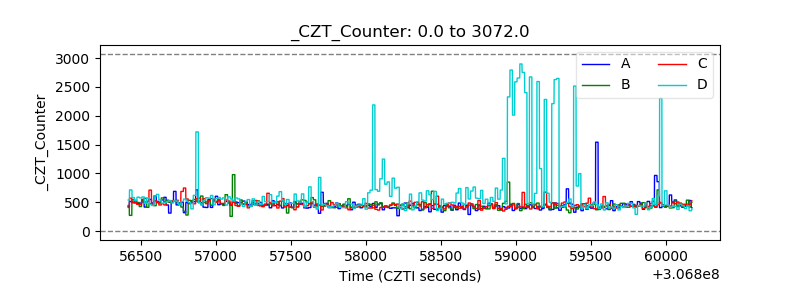 |
| +2.5 Volts monitor |  |
| +5 Volts monitor | 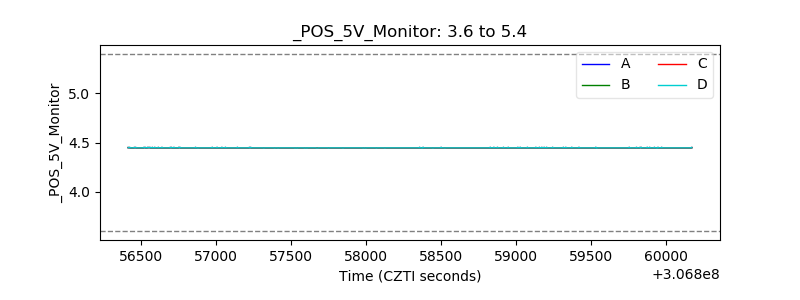 |
| _ROLL_ROT | 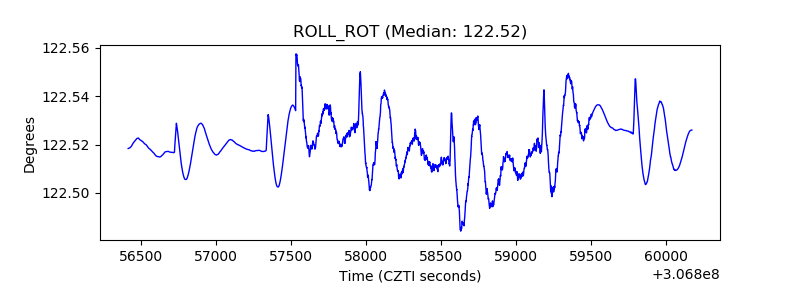 |
| _Roll_DEC | 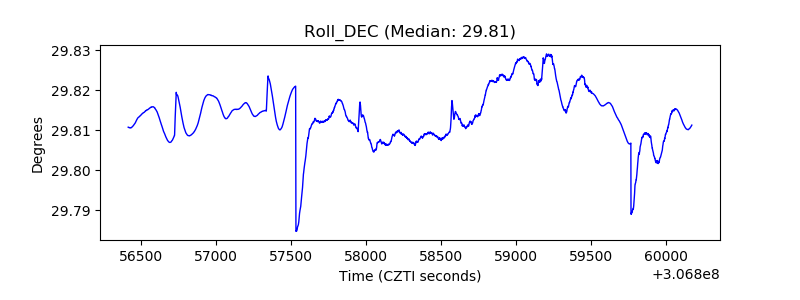 |
| _Roll_RA | 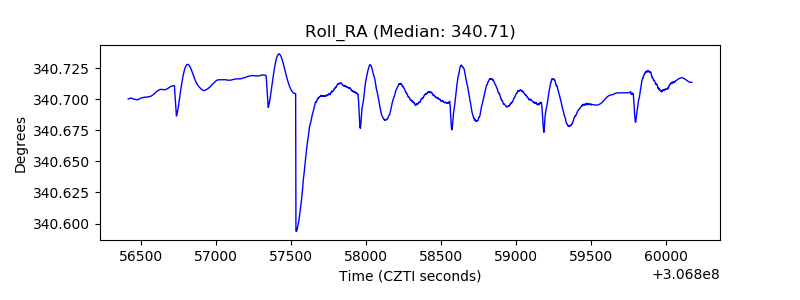 |
| Veto Counter | 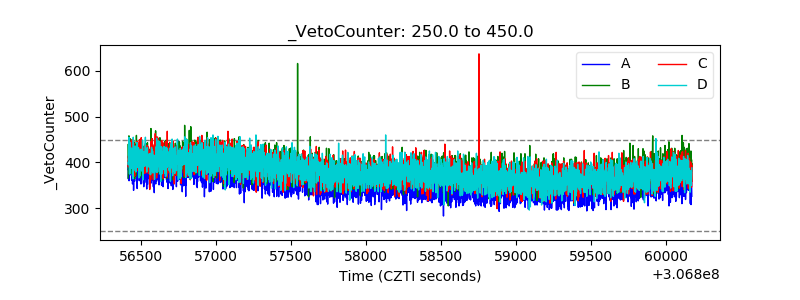 |