| Param | Original file | Final file |
|---|---|---|
| Filename | modeM0/AS1T03_138T09_9000003190cztM0_level2.fits | modeM0/AS1T03_138T09_9000003190cztM0_level2_quad_clean.evt |
| Size (bytes) | 52,433,280 | 50,008,320 |
| Size | 50.0 MB | 47.7 MB |
| Events in quadrant A | 318,680 | 293,784 |
| Events in quadrant B | 307,228 | 296,620 |
| Events in quadrant C | 308,140 | 280,790 |
| Events in quadrant D | 271,066 | 259,611 |
| Mode M0 | |||
|---|---|---|---|
| Quadrant | BADHDUFLAG | Total packets | Discarded packets |
| A | 0 | 11806 | 0 |
| B | 0 | 11557 | 0 |
| C | 0 | 11500 | 0 |
| D | 0 | 12532 | 0 |
| Mode M9 | |||
|---|---|---|---|
| Quadrant | BADHDUFLAG | Total packets | Discarded packets |
| A | 0 | 1 | 0 |
| B | 0 | 1 | 0 |
| C | 0 | 1 | 0 |
| D | 0 | 1 | 0 |
| Mode SS | |||
|---|---|---|---|
| Quadrant | BADHDUFLAG | Total packets | Discarded packets |
| A | 0 | 110 | 0 |
| B | 0 | 110 | 0 |
| C | 0 | 110 | 0 |
| D | 0 | 110 | 0 |
| Quadrant | Total seconds | Saturated seconds | Saturation percentage |
|---|---|---|---|
| A | 5474 | 184 | 3.361345% |
| B | 5474 | 197 | 3.598831% |
| C | 5474 | 225 | 4.110340% |
| D | 5474 | 161 | 2.941176% |
Noise dominated data is calculated using 1-second bins in cleaned event files. If a bin has >2000 counts, and if more than 50% of those come from <1% of pixels, then it is considered to be noise-dominated and hence unusable.
| Quadrant | # 1 sec bins | Bins with >0 counts | Bins with >2000 counts | High rate bins dominated by noise | Noise dominated (total time) | Noise dominated (detector-on time) | Marked lightcurve |
|---|---|---|---|---|---|---|---|
| A | 5584 | 5474 | 0 | 0 | 0.00% | 0.00% | 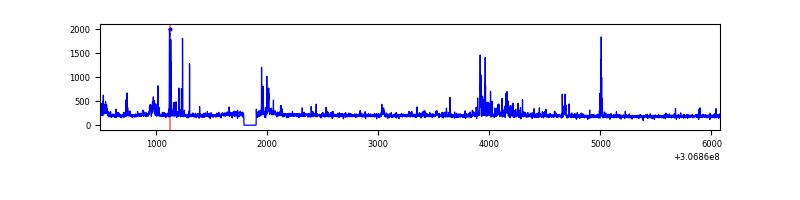 |
| B | 5584 | 5474 | 0 | 0 | 0.00% | 0.00% |  |
| C | 5584 | 5475 | 0 | 0 | 0.00% | 0.00% |  |
| D | 5584 | 5474 | 0 | 0 | 0.00% | 0.00% |  |
Top three noisy pixels from each quadrant. If the there are fewer than three noisy pixels in the level2.evt file, extra rows are filled as -1
| Pixel properties | Quadrant properties | ||||||
|---|---|---|---|---|---|---|---|
| Quadrant | DetID | PixID | Counts | Sigma | Mean | Median | Sigma |
| A | 14 | 188 | 341 | 11.8 | 82 | 78 | 22.3 |
| A | 0 | 29 | 321 | 10.9 | 82 | 78 | 22.3 |
| A | 14 | 204 | 277 | 8.93 | 82 | 78 | 22.3 |
| B | 2 | 9 | 250 | 9.41 | 81 | 77 | 18.4 |
| B | 2 | 8 | 226 | 8.11 | 81 | 77 | 18.4 |
| B | 3 | 17 | 207 | 7.07 | 81 | 77 | 18.4 |
| C | 3 | 126 | 212 | 6.01 | 81 | 75 | 22.8 |
| C | 9 | 242 | 207 | 5.8 | 81 | 75 | 22.8 |
| C | 7 | 203 | 206 | 5.75 | 81 | 75 | 22.8 |
| D | 7 | 3 | 208 | 6.2 | 77 | 70 | 22.3 |
| D | 15 | 46 | 204 | 6.02 | 77 | 70 | 22.3 |
| D | 6 | 231 | 204 | 6.02 | 77 | 70 | 22.3 |
Histogram calculated using DETX and DETY for each event in the final _common_clean file
| Quadrant A |  |
 |
Quadrant B |
|---|---|---|---|
| Quadrant D | 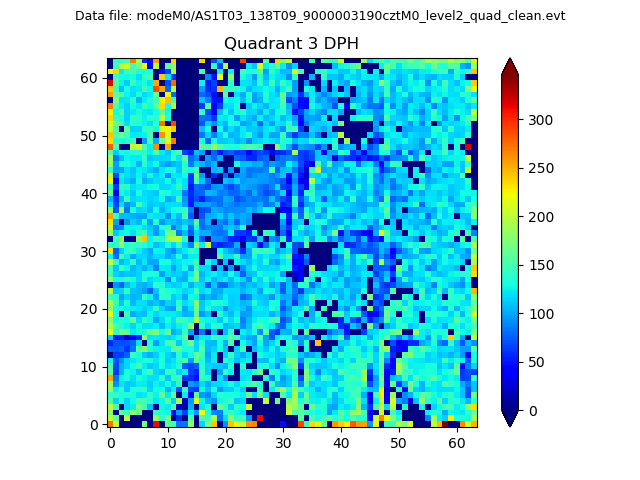 |
 |
Quadrant C |
| Plot type | Count rate plots | Images |
|---|---|---|
| Comparison with Poisson distribution Blue bars denote a histogram of data divided into 1 sec bins. Red curve is a Poisson curve with rate = median count rate of data. |
 |
 |
| Quadrant-wise count rates Data is divided into 100 sec bins |
 |
|
| Module-wise count rates for Quadrant A Data is divided into 100 sec bins |
 |
 |
| Module-wise count rates for Quadrant B Data is divided into 100 sec bins |
 |
 |
| Module-wise count rates for Quadrant C Data is divided into 100 sec bins |
 |
 |
| Module-wise count rates for Quadrant D Data is divided into 100 sec bins |
 |
 |
| Parameter | Plot |
|---|---|
| CZT HV Monitor |  |
| D_VDD | 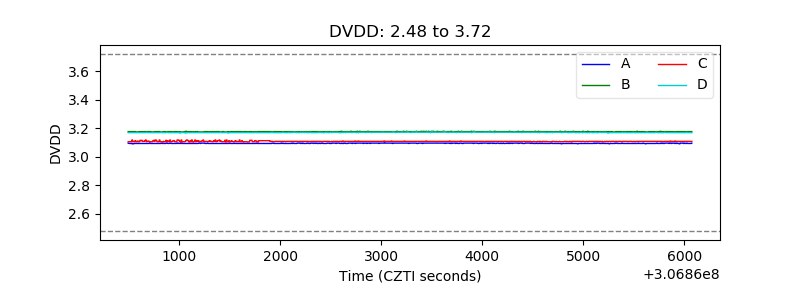 |
| Temperature 1 |  |
| Veto HV Monitor |  |
| Veto LLD |  |
| Alpha Counter |  |
| _CPM_Rate |  |
| CZT Counter |  |
| +2.5 Volts monitor |  |
| +5 Volts monitor |  |
| _ROLL_ROT |  |
| _Roll_DEC |  |
| _Roll_RA |  |
| Veto Counter |  |