| Param | Original file | Final file |
|---|---|---|
| Filename | modeM0/AS1T03_138T09_9000003190_21543cztM0_level2.evt | modeM0/AS1T03_138T09_9000003190_21543cztM0_level2_quad_clean.evt |
| Size (bytes) | 214,865,280 | 26,637,120 |
| Size | 204.9 MB | 25.4 MB |
| Events in quadrant A | 1,603,853 | 154,037 |
| Events in quadrant B | 1,568,104 | 157,100 |
| Events in quadrant C | 1,549,067 | 146,405 |
| Events in quadrant D | 1,589,343 | 143,766 |
| Mode M0 | |||
|---|---|---|---|
| Quadrant | BADHDUFLAG | Total packets | Discarded packets |
| A | 0 | 6451 | 1 |
| B | 0 | 6287 | 1 |
| C | 0 | 6268 | 1 |
| D | 0 | 6535 | 1 |
| Mode M9 | |||
|---|---|---|---|
| Quadrant | BADHDUFLAG | Total packets | Discarded packets |
| A | 0 | 1 | 0 |
| B | 0 | 1 | 0 |
| C | 0 | 1 | 0 |
| D | 0 | 1 | 0 |
| Mode SS | |||
|---|---|---|---|
| Quadrant | BADHDUFLAG | Total packets | Discarded packets |
| A | 0 | 58 | 0 |
| B | 0 | 58 | 0 |
| C | 0 | 58 | 0 |
| D | 0 | 58 | 0 |
| Quadrant | Total seconds | Saturated seconds | Saturation percentage |
|---|---|---|---|
| A | 2869 | 183 | 6.378529% |
| B | 2869 | 197 | 6.866504% |
| C | 2869 | 222 | 7.737888% |
| D | 2868 | 150 | 5.230126% |
Noise dominated data is calculated using 1-second bins in cleaned event files. If a bin has >2000 counts, and if more than 50% of those come from <1% of pixels, then it is considered to be noise-dominated and hence unusable.
| Quadrant | # 1 sec bins | Bins with >0 counts | Bins with >2000 counts | High rate bins dominated by noise | Noise dominated (total time) | Noise dominated (detector-on time) | Marked lightcurve |
|---|---|---|---|---|---|---|---|
| A | 2979 | 2870 | 7 | 7 | 0.23% | 0.24% | 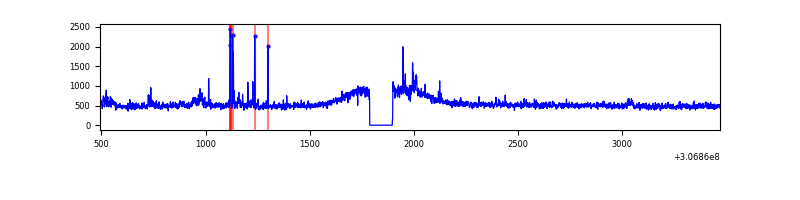 |
| B | 2979 | 2870 | 0 | 0 | 0.00% | 0.00% | 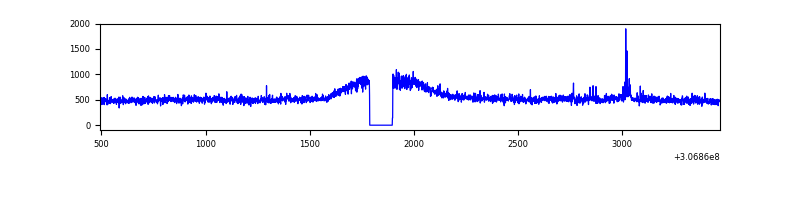 |
| C | 2979 | 2870 | 0 | 0 | 0.00% | 0.00% | 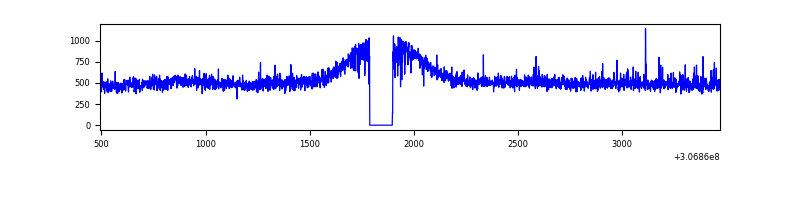 |
| D | 2978 | 2869 | 6 | 6 | 0.20% | 0.21% | 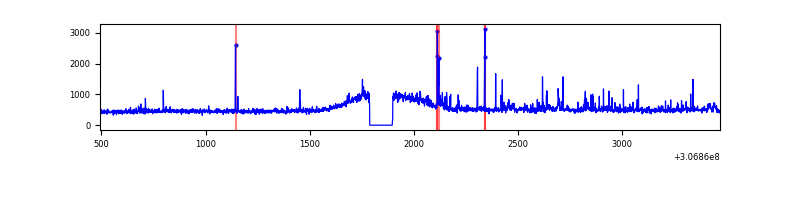 |
Top three noisy pixels from each quadrant. If the there are fewer than three noisy pixels in the level2.evt file, extra rows are filled as -1
| Pixel properties | Quadrant properties | ||||||
|---|---|---|---|---|---|---|---|
| Quadrant | DetID | PixID | Counts | Sigma | Mean | Median | Sigma |
| A | 4 | 2 | 76456 | 919.48 | 395 | 384 | 82.7 |
| A | 12 | 96 | 4057 | 44.4 | 395 | 384 | 82.7 |
| A | 13 | 254 | 4018 | 43.92 | 395 | 384 | 82.7 |
| B | 0 | 190 | 11785 | 145.53 | 392 | 382 | 78.4 |
| B | 12 | 111 | 9802 | 120.23 | 392 | 382 | 78.4 |
| B | 11 | 111 | 8837 | 107.91 | 392 | 382 | 78.4 |
| C | 14 | 238 | 58761 | 641.98 | 374 | 375 | 90.9 |
| C | 0 | 239 | 17478 | 188.06 | 374 | 375 | 90.9 |
| C | 10 | 91 | 6351 | 65.71 | 374 | 375 | 90.9 |
| D | 1 | 52 | 71385 | 740.19 | 384 | 370 | 95.9 |
| D | 14 | 35 | 33198 | 342.17 | 384 | 370 | 95.9 |
| D | 13 | 153 | 17816 | 181.84 | 384 | 370 | 95.9 |
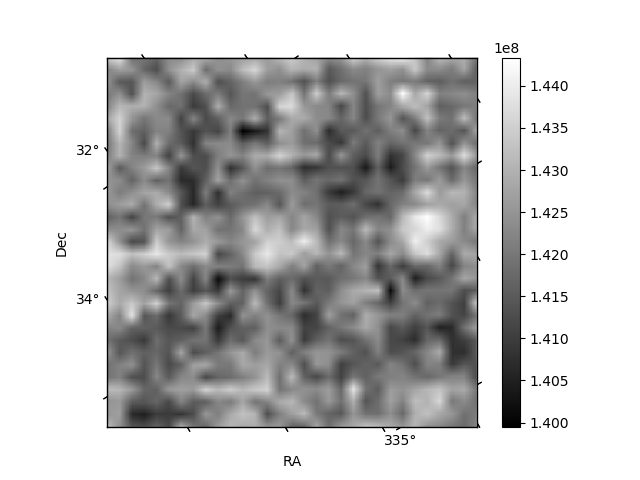
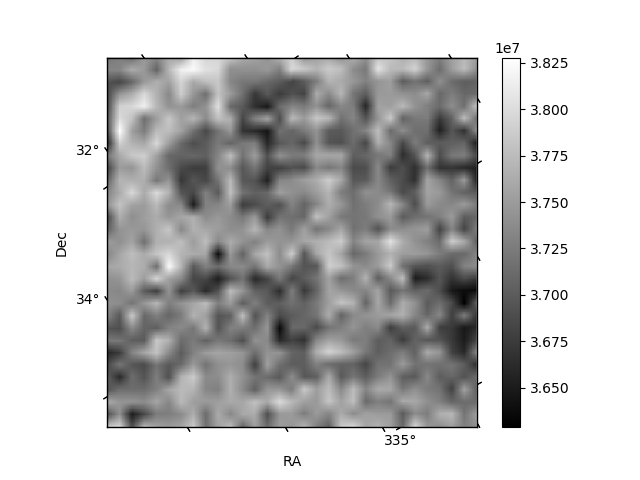
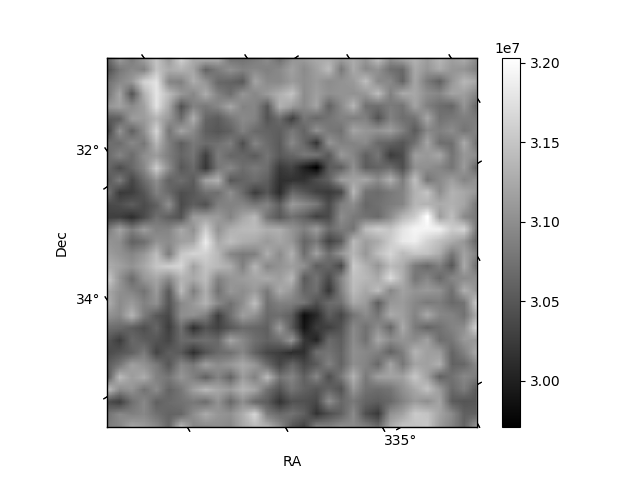
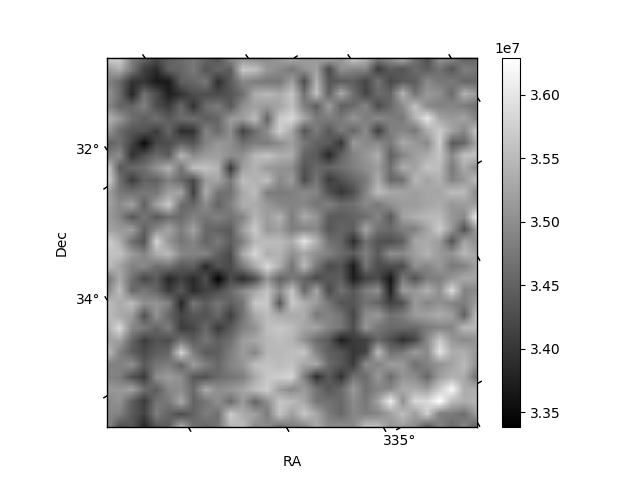
Histogram calculated using DETX and DETY for each event in the final _common_clean file
| Quadrant A | 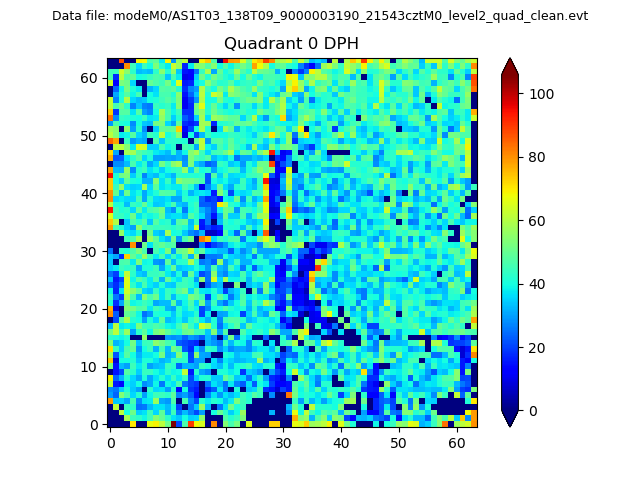 |
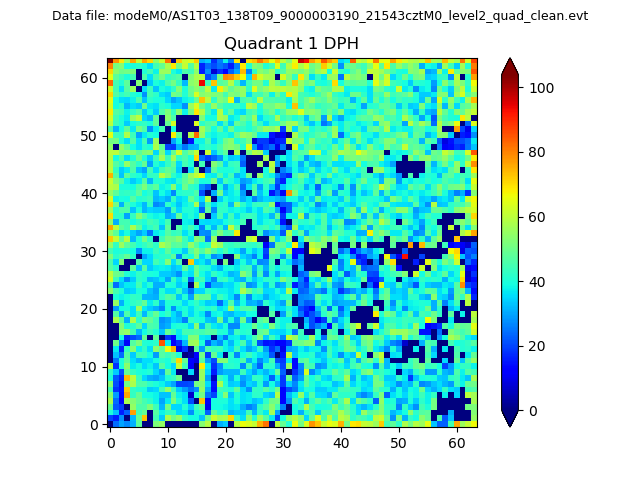 |
Quadrant B |
|---|---|---|---|
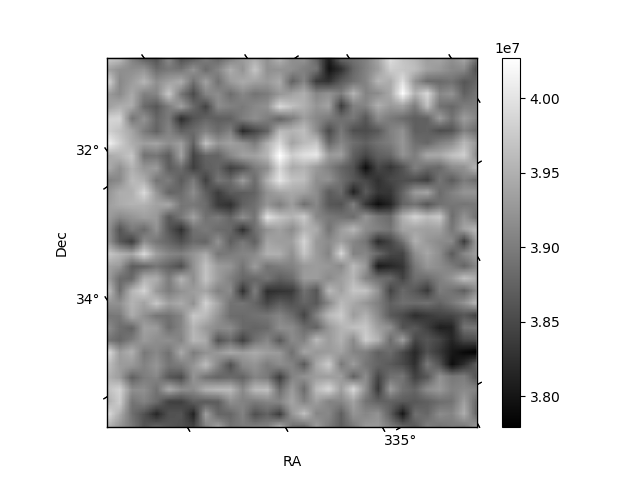
| Quadrant D | 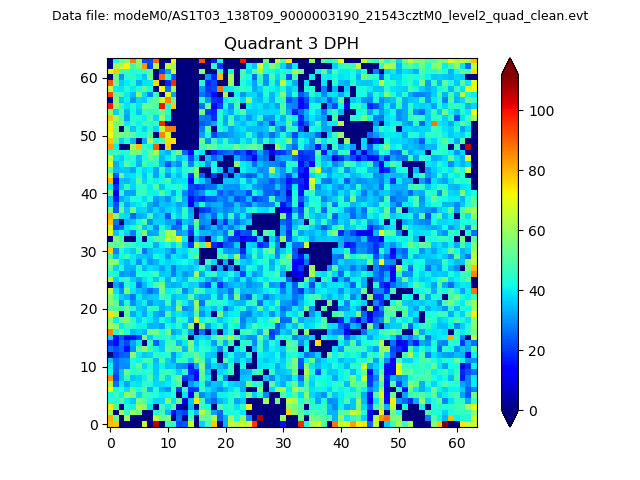 |
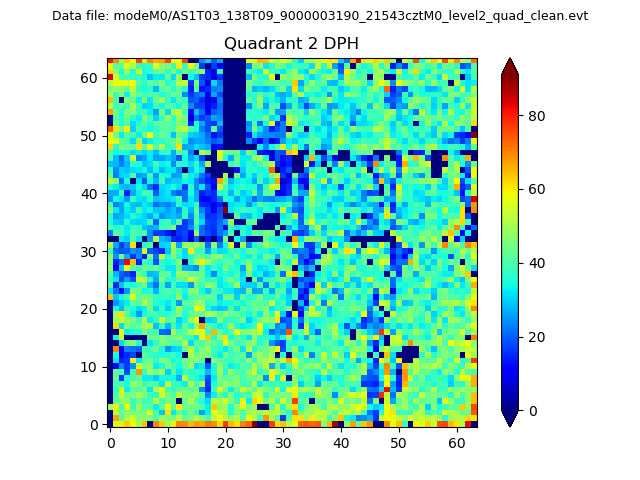 |
Quadrant C |
| Plot type | Count rate plots | Images |
|---|---|---|
| Comparison with Poisson distribution Blue bars denote a histogram of data divided into 1 sec bins. Red curve is a Poisson curve with rate = median count rate of data. |
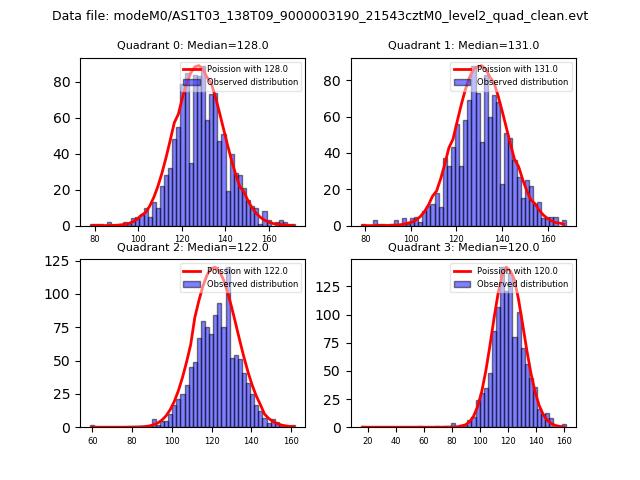 |
 |
| Quadrant-wise count rates Data is divided into 100 sec bins |
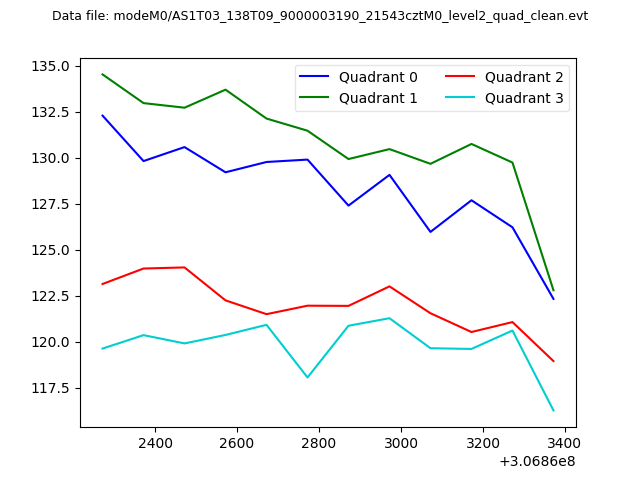 |
|
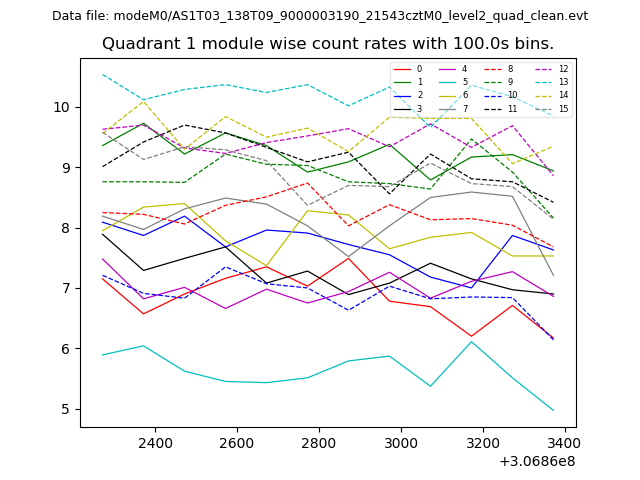
| Module-wise count rates for Quadrant A Data is divided into 100 sec bins |
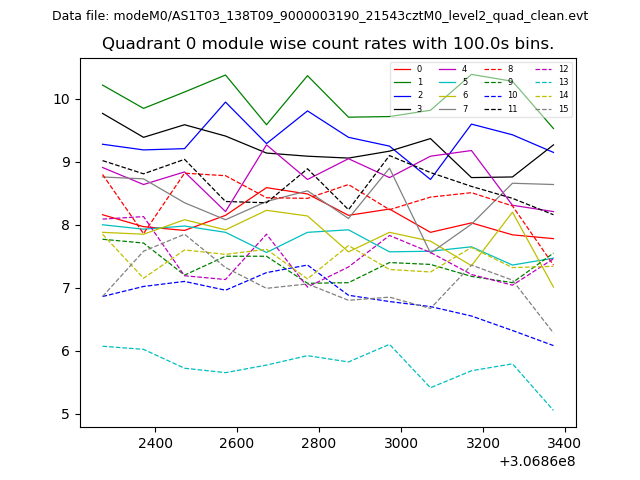 |
 |
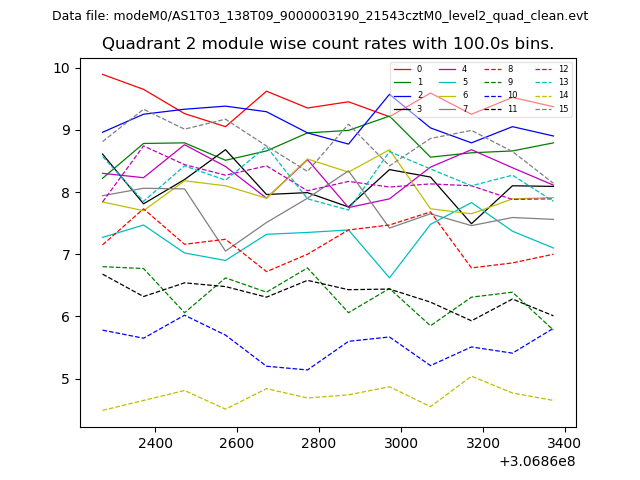
| Module-wise count rates for Quadrant B Data is divided into 100 sec bins |
 |
 |
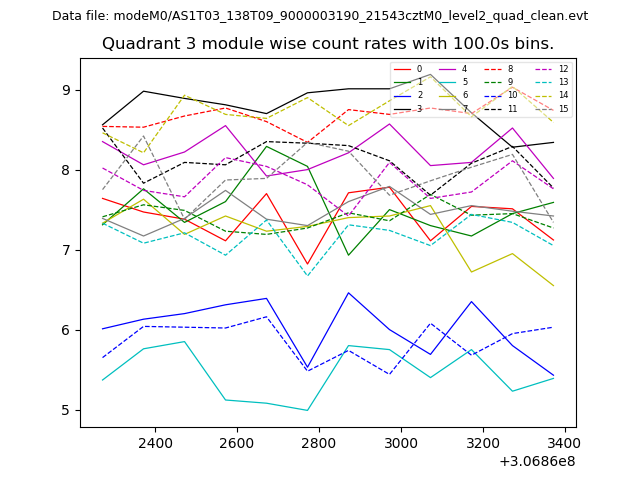
| Module-wise count rates for Quadrant C Data is divided into 100 sec bins |
 |
 |
| Module-wise count rates for Quadrant D Data is divided into 100 sec bins |
 |
 |
| Parameter | Plot |
|---|---|
| CZT HV Monitor | 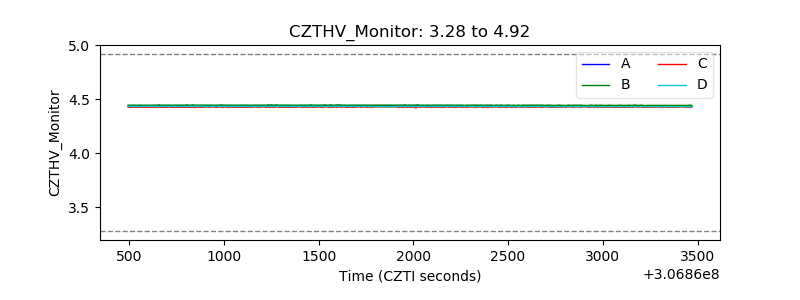 |
| D_VDD | 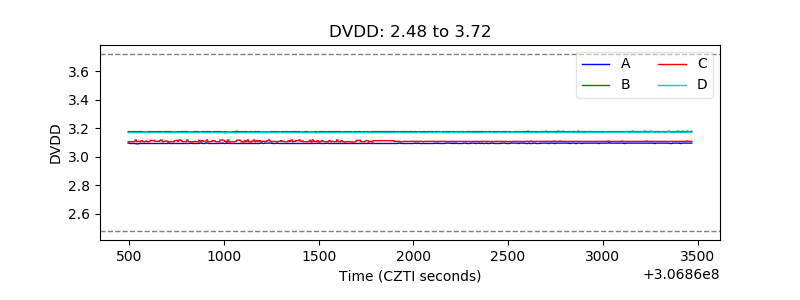 |
| Temperature 1 | 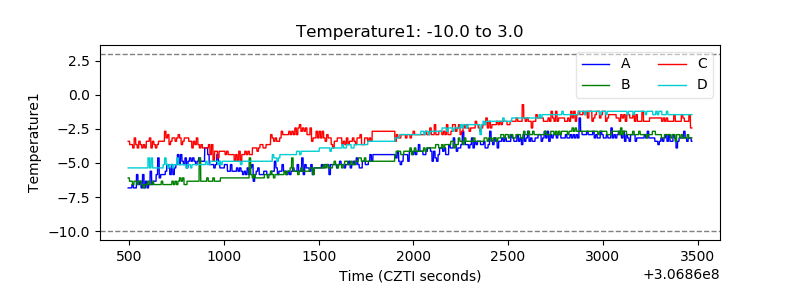 |
| Veto HV Monitor | 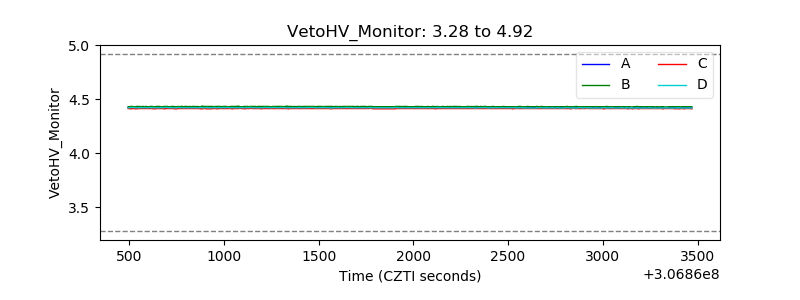 |
| Veto LLD | 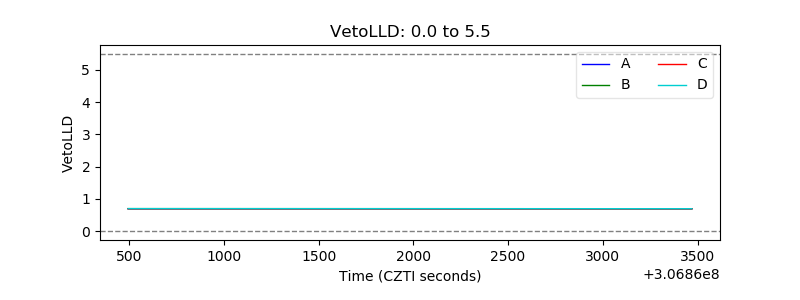 |
| Alpha Counter | 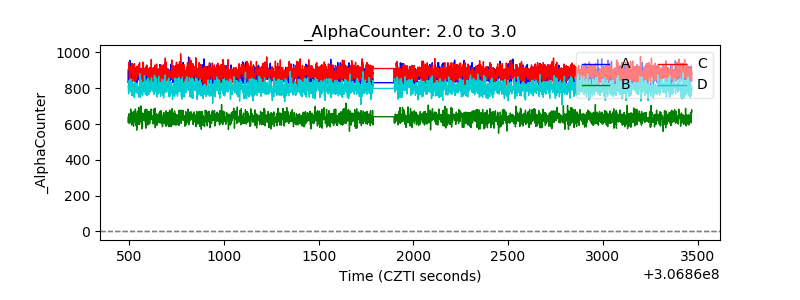 |
| _CPM_Rate | 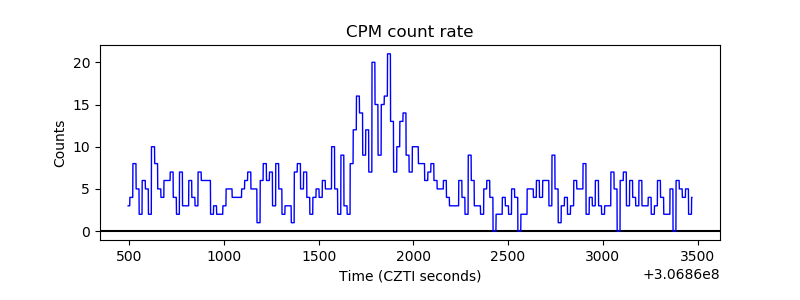 |
| CZT Counter | 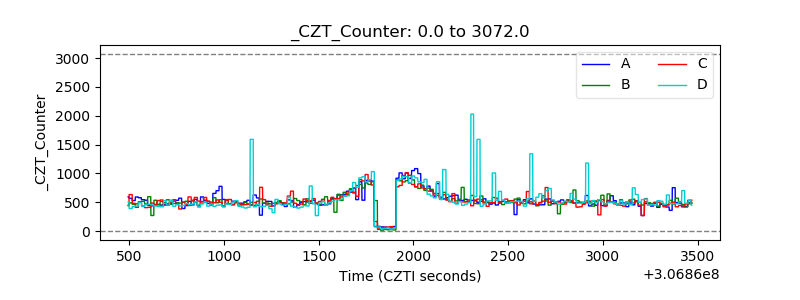 |
| +2.5 Volts monitor |  |
| +5 Volts monitor |  |
| _ROLL_ROT | 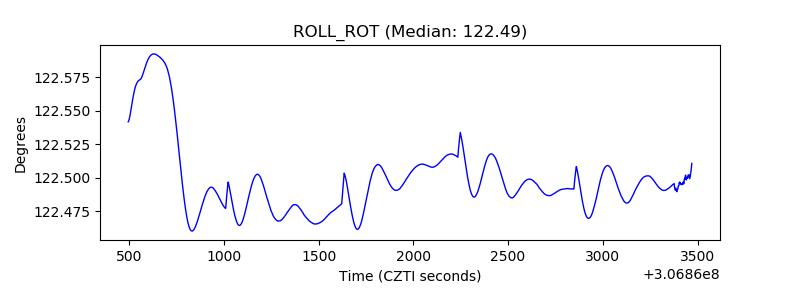 |
| _Roll_DEC | 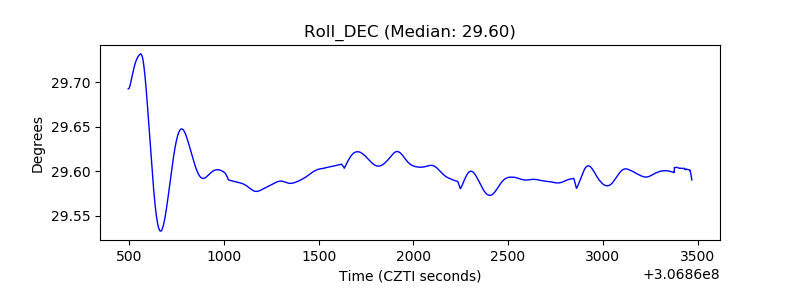 |
| _Roll_RA | 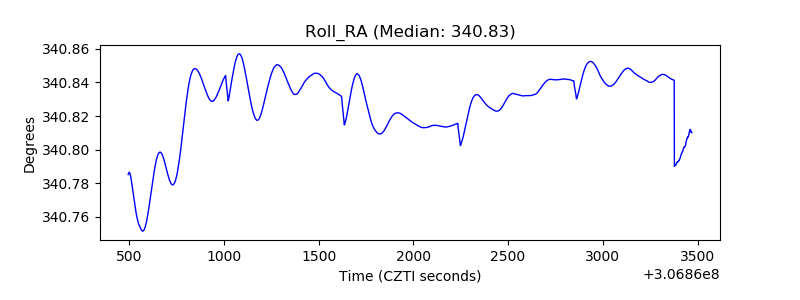 |
| Veto Counter |  |