| Param | Original file | Final file |
|---|---|---|
| Filename | modeM0/AS1A06_009T02_9000003194cztM0_level2.fits | modeM0/AS1A06_009T02_9000003194cztM0_level2_quad_clean.evt |
| Size (bytes) | 177,160,320 | 170,838,720 |
| Size | 169.0 MB | 162.9 MB |
| Events in quadrant A | 1,103,380 | 1,060,530 |
| Events in quadrant B | 1,060,936 | 1,057,614 |
| Events in quadrant C | 1,082,352 | 1,024,118 |
| Events in quadrant D | 797,870 | 711,862 |
| Mode M9 | |||
|---|---|---|---|
| Quadrant | BADHDUFLAG | Total packets | Discarded packets |
| A | 0 | 11 | 0 |
| B | 0 | 11 | 0 |
| C | 0 | 11 | 0 |
| D | 0 | 11 | 0 |
| Mode M0 | |||
|---|---|---|---|
| Quadrant | BADHDUFLAG | Total packets | Discarded packets |
| A | 0 | 39332 | 0 |
| B | 0 | 40686 | 0 |
| C | 0 | 39434 | 0 |
| D | 0 | 84003 | 0 |
| Mode SS | |||
|---|---|---|---|
| Quadrant | BADHDUFLAG | Total packets | Discarded packets |
| A | 0 | 386 | 0 |
| B | 0 | 386 | 0 |
| C | 0 | 386 | 0 |
| D | 0 | 386 | 0 |
| Quadrant | Total seconds | Saturated seconds | Saturation percentage |
|---|---|---|---|
| A | 19152 | 128 | 0.668338% |
| B | 19152 | 182 | 0.950292% |
| C | 19152 | 210 | 1.096491% |
| D | 19152 | 4900 | 25.584795% |
Noise dominated data is calculated using 1-second bins in cleaned event files. If a bin has >2000 counts, and if more than 50% of those come from <1% of pixels, then it is considered to be noise-dominated and hence unusable.
| Quadrant | # 1 sec bins | Bins with >0 counts | Bins with >2000 counts | High rate bins dominated by noise | Noise dominated (total time) | Noise dominated (detector-on time) | Marked lightcurve |
|---|---|---|---|---|---|---|---|
| A | 20146 | 19151 | 0 | 0 | 0.00% | 0.00% |  |
| B | 20147 | 19151 | 0 | 0 | 0.00% | 0.00% |  |
| C | 20146 | 19151 | 0 | 0 | 0.00% | 0.00% |  |
| D | 20147 | 19076 | 0 | 0 | 0.00% | 0.00% |  |
Top three noisy pixels from each quadrant. If the there are fewer than three noisy pixels in the level2.evt file, extra rows are filled as -1
| Pixel properties | Quadrant properties | ||||||
|---|---|---|---|---|---|---|---|
| Quadrant | DetID | PixID | Counts | Sigma | Mean | Median | Sigma |
| A | 0 | 29 | 1047 | 10.7 | 287 | 269 | 72.7 |
| A | 0 | 30 | 876 | 8.35 | 287 | 269 | 72.7 |
| A | 7 | 110 | 866 | 8.21 | 287 | 269 | 72.7 |
| B | 2 | 9 | 831 | 9.97 | 280 | 266 | 56.6 |
| B | 14 | 254 | 718 | 7.97 | 280 | 266 | 56.6 |
| B | 3 | 17 | 713 | 7.88 | 280 | 266 | 56.6 |
| C | 12 | 241 | 762 | 6.62 | 286 | 267 | 74.8 |
| C | 9 | 209 | 748 | 6.43 | 286 | 267 | 74.8 |
| C | 3 | 235 | 747 | 6.42 | 286 | 267 | 74.8 |
| D | 6 | 67 | 579 | 6.0 | 227 | 207 | 62.0 |
| D | 10 | 189 | 576 | 5.95 | 227 | 207 | 62.0 |
| D | 4 | 160 | 574 | 5.92 | 227 | 207 | 62.0 |
Histogram calculated using DETX and DETY for each event in the final _common_clean file
| Quadrant A | 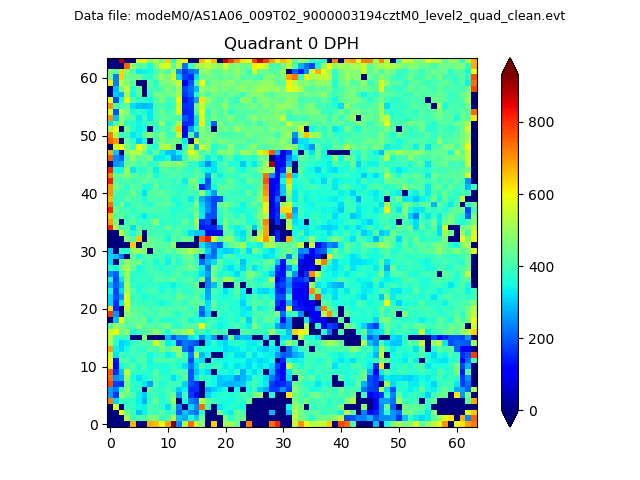 |
 |
Quadrant B |
|---|---|---|---|
| Quadrant D |  |
 |
Quadrant C |
| Plot type | Count rate plots | Images |
|---|---|---|
| Comparison with Poisson distribution Blue bars denote a histogram of data divided into 1 sec bins. Red curve is a Poisson curve with rate = median count rate of data. |
 |
 |
| Quadrant-wise count rates Data is divided into 100 sec bins |
 |
|
| Module-wise count rates for Quadrant A Data is divided into 100 sec bins |
 |
 |
| Module-wise count rates for Quadrant B Data is divided into 100 sec bins |
 |
 |
| Module-wise count rates for Quadrant C Data is divided into 100 sec bins |
 |
 |
| Module-wise count rates for Quadrant D Data is divided into 100 sec bins |
 |
 |
| Parameter | Plot |
|---|---|
| CZT HV Monitor |  |
| D_VDD |  |
| Temperature 1 |  |
| Veto HV Monitor |  |
| Veto LLD |  |
| Alpha Counter |  |
| _CPM_Rate |  |
| CZT Counter |  |
| +2.5 Volts monitor |  |
| +5 Volts monitor |  |
| _ROLL_ROT |  |
| _Roll_DEC |  |
| _Roll_RA |  |
| Veto Counter |  |