| Param | Original file | Final file |
|---|---|---|
| Filename | modeM0/AS1A06_009T02_9000003194_21558cztM0_level2.evt | modeM0/AS1A06_009T02_9000003194_21558cztM0_level2_quad_clean.evt |
| Size (bytes) | 614,090,880 | 103,631,040 |
| Size | 585.6 MB | 98.8 MB |
| Events in quadrant A | 3,415,543 | 686,343 |
| Events in quadrant B | 3,731,251 | 689,639 |
| Events in quadrant C | 3,399,342 | 674,508 |
| Events in quadrant D | 7,559,894 | 581,986 |
| Mode M9 | |||
|---|---|---|---|
| Quadrant | BADHDUFLAG | Total packets | Discarded packets |
| A | 0 | 4 | 0 |
| B | 0 | 4 | 0 |
| C | 0 | 4 | 0 |
| D | 0 | 4 | 0 |
| Mode M0 | |||
|---|---|---|---|
| Quadrant | BADHDUFLAG | Total packets | Discarded packets |
| A | 0 | 14917 | 1 |
| B | 0 | 15643 | 2 |
| C | 0 | 14890 | 1 |
| D | 0 | 27452 | 1 |
| Mode SS | |||
|---|---|---|---|
| Quadrant | BADHDUFLAG | Total packets | Discarded packets |
| A | 0 | 146 | 0 |
| B | 0 | 146 | 0 |
| C | 0 | 146 | 0 |
| D | 0 | 146 | 0 |
| Quadrant | Total seconds | Saturated seconds | Saturation percentage |
|---|---|---|---|
| A | 7266 | 28 | 0.385356% |
| B | 7266 | 47 | 0.646848% |
| C | 7266 | 52 | 0.715662% |
| D | 7266 | 932 | 12.826865% |
Noise dominated data is calculated using 1-second bins in cleaned event files. If a bin has >2000 counts, and if more than 50% of those come from <1% of pixels, then it is considered to be noise-dominated and hence unusable.
| Quadrant | # 1 sec bins | Bins with >0 counts | Bins with >2000 counts | High rate bins dominated by noise | Noise dominated (total time) | Noise dominated (detector-on time) | Marked lightcurve |
|---|---|---|---|---|---|---|---|
| A | 7586 | 7267 | 2 | 2 | 0.03% | 0.03% |  |
| B | 7586 | 7267 | 2 | 2 | 0.03% | 0.03% |  |
| C | 7586 | 7267 | 0 | 0 | 0.00% | 0.00% |  |
| D | 7586 | 7267 | 777 | 777 | 10.24% | 10.69% |  |
Top three noisy pixels from each quadrant. If the there are fewer than three noisy pixels in the level2.evt file, extra rows are filled as -1
| Pixel properties | Quadrant properties | ||||||
|---|---|---|---|---|---|---|---|
| Quadrant | DetID | PixID | Counts | Sigma | Mean | Median | Sigma |
| A | 4 | 2 | 33596 | 184.86 | 876 | 860 | 177.1 |
| A | 13 | 254 | 11058 | 57.59 | 876 | 860 | 177.1 |
| A | 0 | 226 | 7641 | 38.29 | 876 | 860 | 177.1 |
| B | 0 | 189 | 157392 | 946.77 | 869 | 848 | 165.3 |
| B | 0 | 230 | 71372 | 426.53 | 869 | 848 | 165.3 |
| B | 0 | 219 | 46791 | 277.86 | 869 | 848 | 165.3 |
| C | 14 | 238 | 131432 | 670.99 | 833 | 838 | 194.6 |
| C | 8 | 128 | 9571 | 44.87 | 833 | 838 | 194.6 |
| C | 13 | 61 | 5897 | 25.99 | 833 | 838 | 194.6 |
| D | 1 | 52 | 3453173 | 17911.95 | 792 | 768 | 192.7 |
| D | 2 | 136 | 419666 | 2173.35 | 792 | 768 | 192.7 |
| D | 9 | 68 | 162818 | 840.76 | 792 | 768 | 192.7 |
Histogram calculated using DETX and DETY for each event in the final _common_clean file
| Quadrant A |  |
 |
Quadrant B |
|---|---|---|---|
| Quadrant D |  |
 |
Quadrant C |
| Plot type | Count rate plots | Images |
|---|---|---|
| Comparison with Poisson distribution Blue bars denote a histogram of data divided into 1 sec bins. Red curve is a Poisson curve with rate = median count rate of data. |
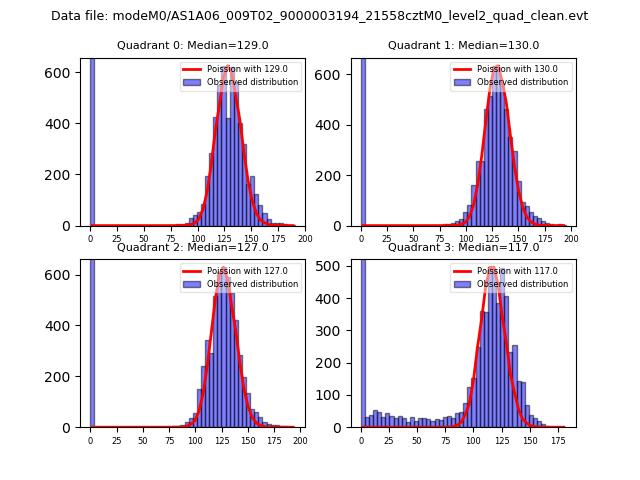 |
 |
| Quadrant-wise count rates Data is divided into 100 sec bins |
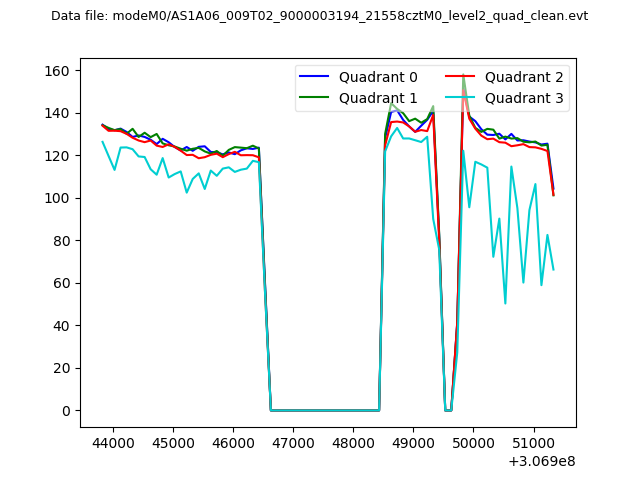 |
|
| Module-wise count rates for Quadrant A Data is divided into 100 sec bins |
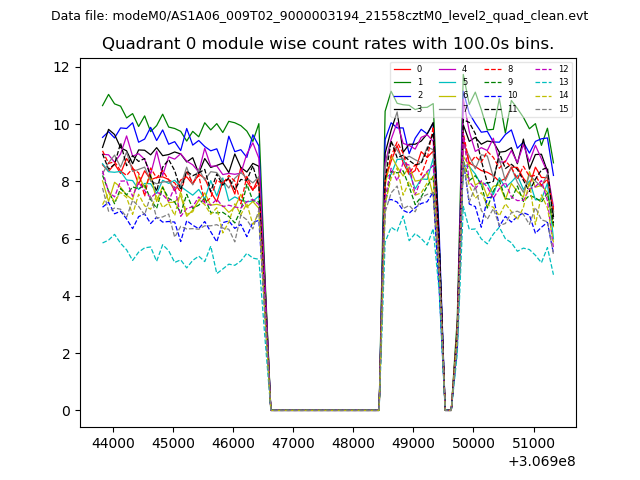 |
 |
| Module-wise count rates for Quadrant B Data is divided into 100 sec bins |
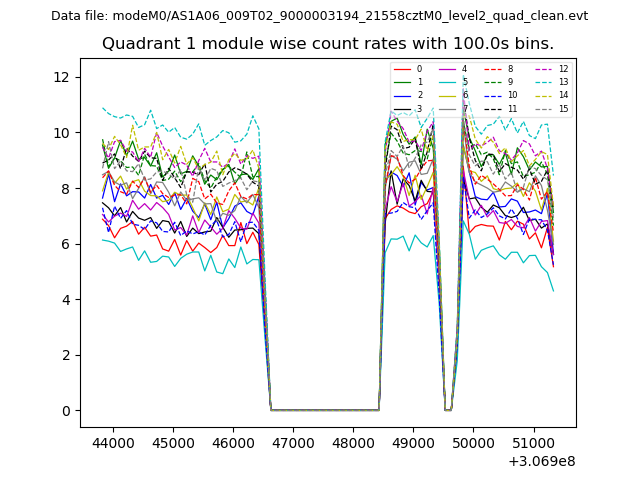 |
 |
| Module-wise count rates for Quadrant C Data is divided into 100 sec bins |
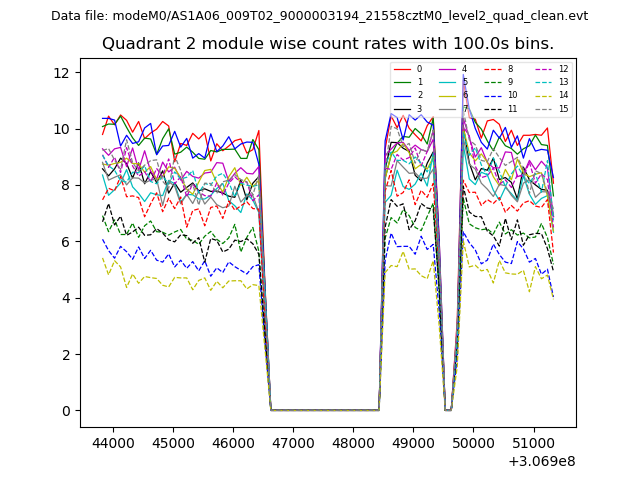 |
 |
| Module-wise count rates for Quadrant D Data is divided into 100 sec bins |
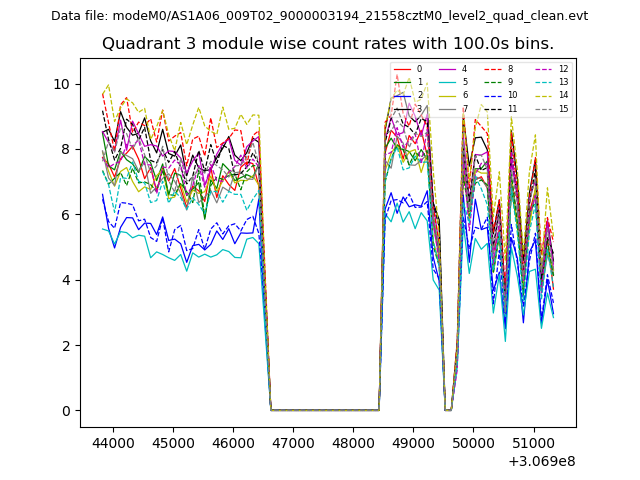 |
 |
| Parameter | Plot |
|---|---|
| CZT HV Monitor | 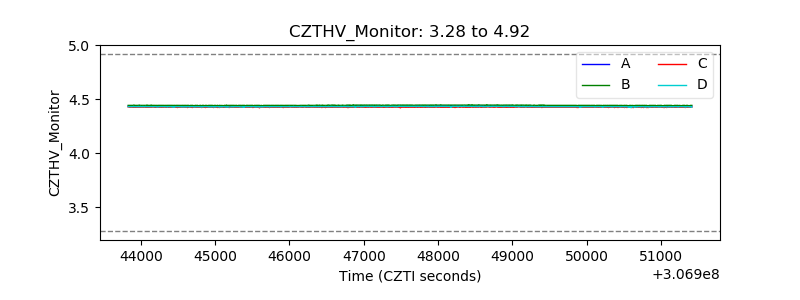 |
| D_VDD |  |
| Temperature 1 |  |
| Veto HV Monitor |  |
| Veto LLD |  |
| Alpha Counter | 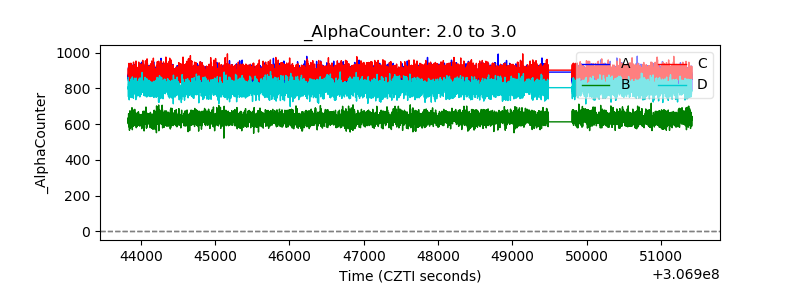 |
| _CPM_Rate | 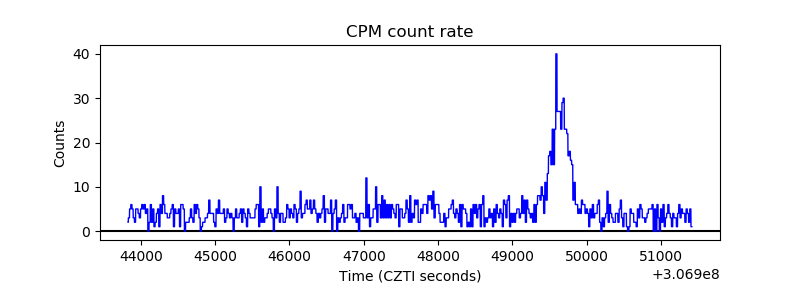 |
| CZT Counter |  |
| +2.5 Volts monitor |  |
| +5 Volts monitor |  |
| _ROLL_ROT | 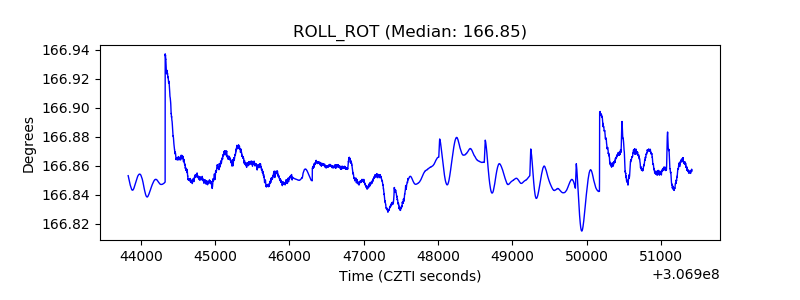 |
| _Roll_DEC | 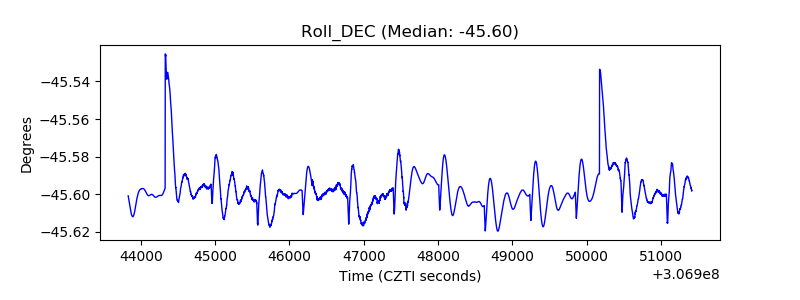 |
| _Roll_RA |  |
| Veto Counter | 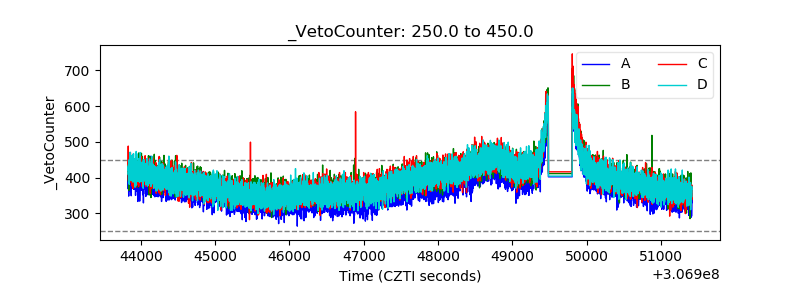 |