| Param | Original file | Final file |
|---|---|---|
| Filename | modeM0/AS1A06_009T02_9000003194_21561cztM0_level2.evt | modeM0/AS1A06_009T02_9000003194_21561cztM0_level2_quad_clean.evt |
| Size (bytes) | 1,007,035,200 | 120,303,360 |
| Size | 960.4 MB | 114.7 MB |
| Events in quadrant A | 4,551,165 | 790,212 |
| Events in quadrant B | 4,935,547 | 798,506 |
| Events in quadrant C | 4,613,821 | 773,588 |
| Events in quadrant D | 15,716,916 | 581,919 |
| Mode M9 | |||
|---|---|---|---|
| Quadrant | BADHDUFLAG | Total packets | Discarded packets |
| A | 0 | 5 | 0 |
| B | 0 | 5 | 0 |
| C | 0 | 5 | 0 |
| D | 0 | 5 | 0 |
| Mode M0 | |||
|---|---|---|---|
| Quadrant | BADHDUFLAG | Total packets | Discarded packets |
| A | 0 | 20346 | 1 |
| B | 0 | 21141 | 1 |
| C | 0 | 20425 | 1 |
| D | 0 | 53638 | 1 |
| Mode SS | |||
|---|---|---|---|
| Quadrant | BADHDUFLAG | Total packets | Discarded packets |
| A | 0 | 204 | 0 |
| B | 0 | 204 | 0 |
| C | 0 | 204 | 0 |
| D | 0 | 204 | 0 |
| Quadrant | Total seconds | Saturated seconds | Saturation percentage |
|---|---|---|---|
| A | 10070 | 15 | 0.148957% |
| B | 10071 | 24 | 0.238308% |
| C | 10071 | 63 | 0.625559% |
| D | 10071 | 4226 | 41.962069% |
Noise dominated data is calculated using 1-second bins in cleaned event files. If a bin has >2000 counts, and if more than 50% of those come from <1% of pixels, then it is considered to be noise-dominated and hence unusable.
| Quadrant | # 1 sec bins | Bins with >0 counts | Bins with >2000 counts | High rate bins dominated by noise | Noise dominated (total time) | Noise dominated (detector-on time) | Marked lightcurve |
|---|---|---|---|---|---|---|---|
| A | 10600 | 10071 | 0 | 0 | 0.00% | 0.00% | 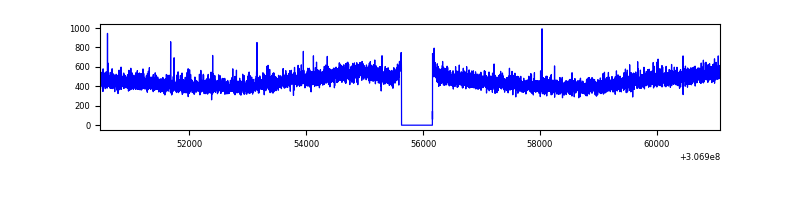 |
| B | 10601 | 10072 | 6 | 6 | 0.06% | 0.06% | 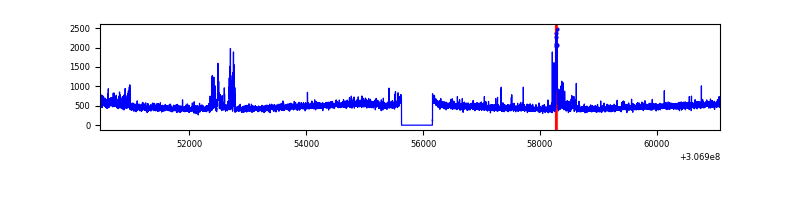 |
| C | 10601 | 10072 | 0 | 0 | 0.00% | 0.00% | 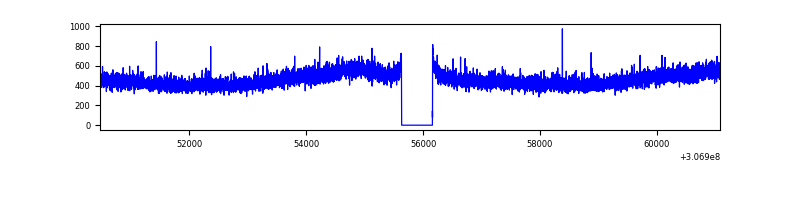 |
| D | 10601 | 10072 | 3898 | 3898 | 36.77% | 38.70% | 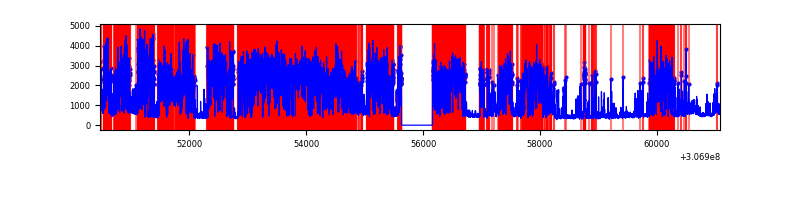 |
Top three noisy pixels from each quadrant. If the there are fewer than three noisy pixels in the level2.evt file, extra rows are filled as -1
| Pixel properties | Quadrant properties | ||||||
|---|---|---|---|---|---|---|---|
| Quadrant | DetID | PixID | Counts | Sigma | Mean | Median | Sigma |
| A | 13 | 254 | 15661 | 60.79 | 1179 | 1155 | 238.6 |
| A | 0 | 226 | 10196 | 37.89 | 1179 | 1155 | 238.6 |
| A | 3 | 137 | 9805 | 36.25 | 1179 | 1155 | 238.6 |
| B | 0 | 228 | 116336 | 513.55 | 1181 | 1151 | 224.3 |
| B | 0 | 230 | 94897 | 417.97 | 1181 | 1151 | 224.3 |
| B | 0 | 189 | 61249 | 267.95 | 1181 | 1151 | 224.3 |
| C | 14 | 238 | 177060 | 661.7 | 1130 | 1138 | 265.9 |
| C | 3 | 233 | 17676 | 62.2 | 1130 | 1138 | 265.9 |
| C | 8 | 128 | 9206 | 30.35 | 1130 | 1138 | 265.9 |
| D | 1 | 52 | 11436366 | 52497.99 | 892 | 864 | 217.8 |
| D | 2 | 136 | 306096 | 1401.26 | 892 | 864 | 217.8 |
| D | 13 | 153 | 196378 | 897.56 | 892 | 864 | 217.8 |
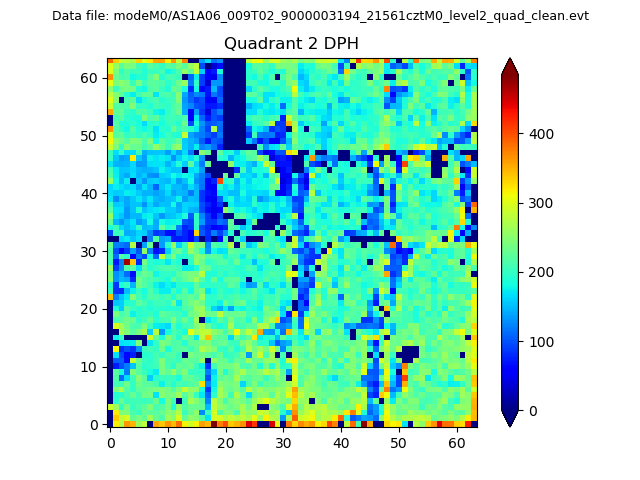
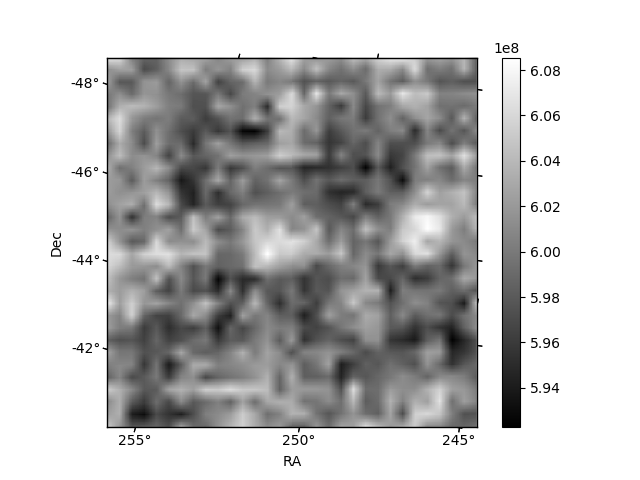
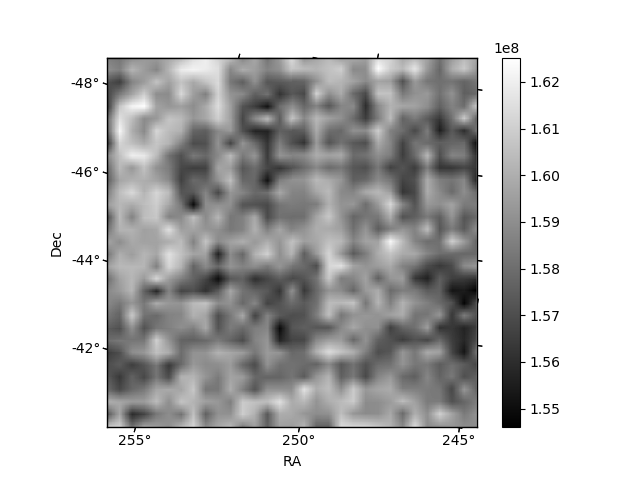
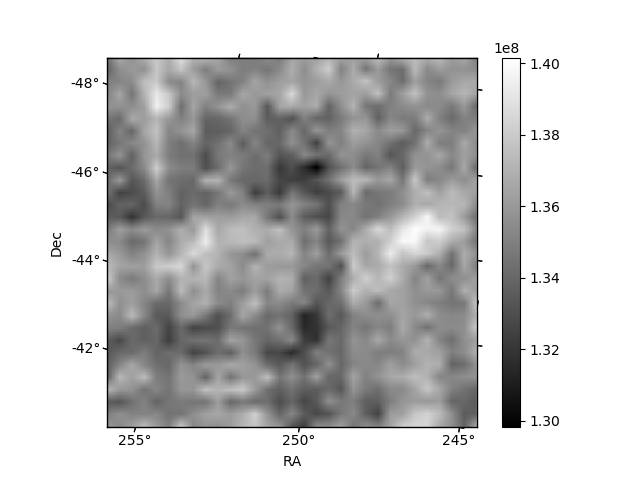
Histogram calculated using DETX and DETY for each event in the final _common_clean file
| Quadrant A | 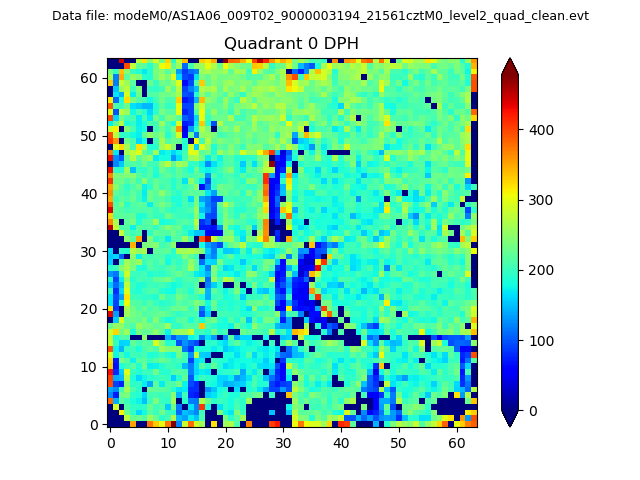 |
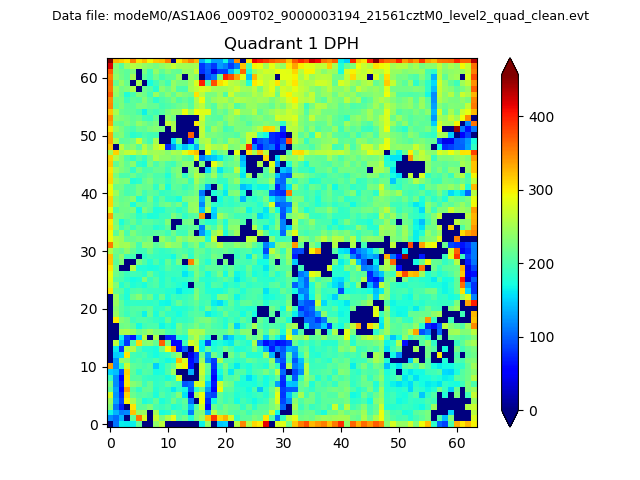 |
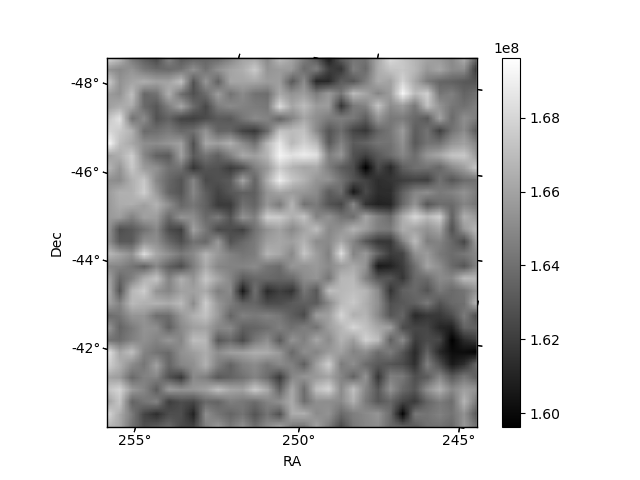
Quadrant B |
|---|---|---|---|
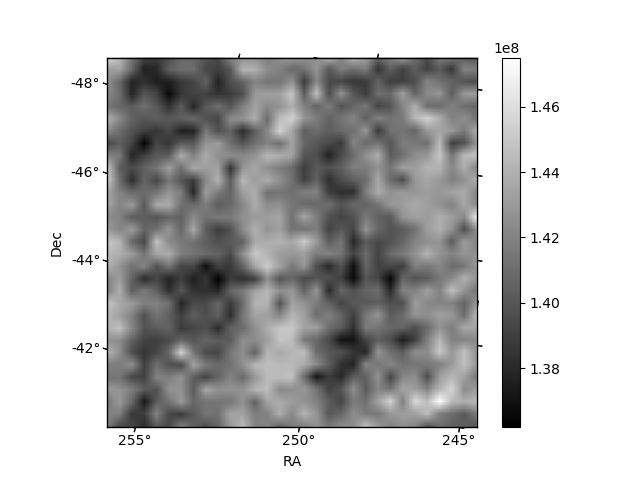
| Quadrant D | 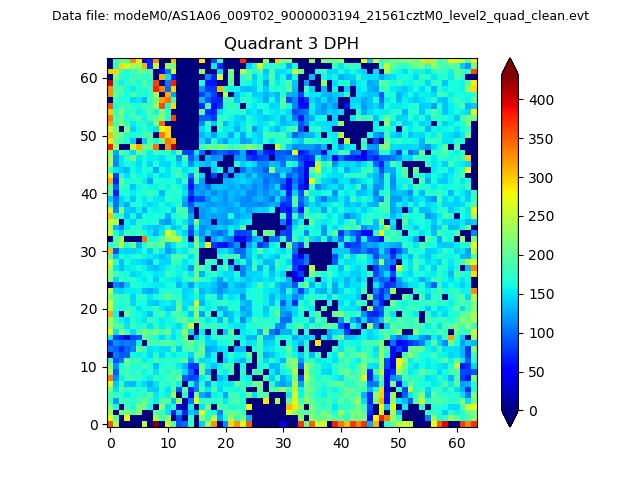 |
 |
Quadrant C |
| Plot type | Count rate plots | Images |
|---|---|---|
| Comparison with Poisson distribution Blue bars denote a histogram of data divided into 1 sec bins. Red curve is a Poisson curve with rate = median count rate of data. |
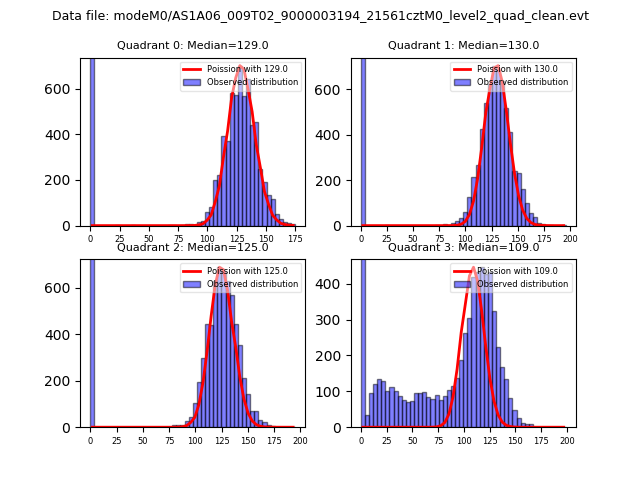 |
 |
| Quadrant-wise count rates Data is divided into 100 sec bins |
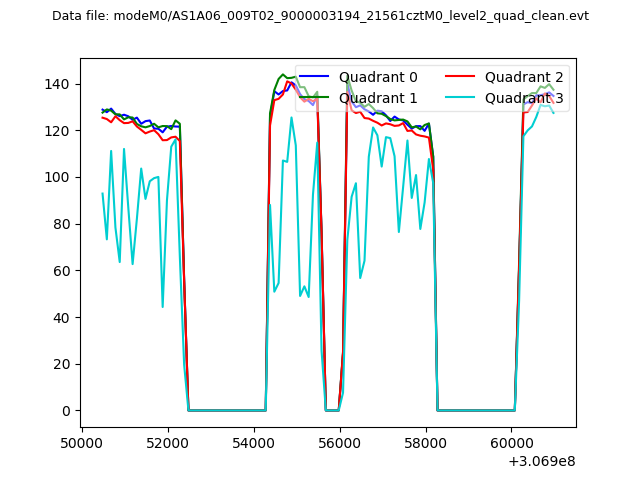 |
|
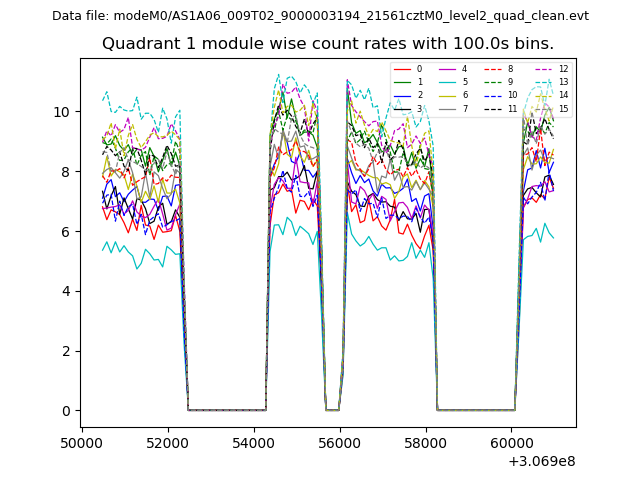
| Module-wise count rates for Quadrant A Data is divided into 100 sec bins |
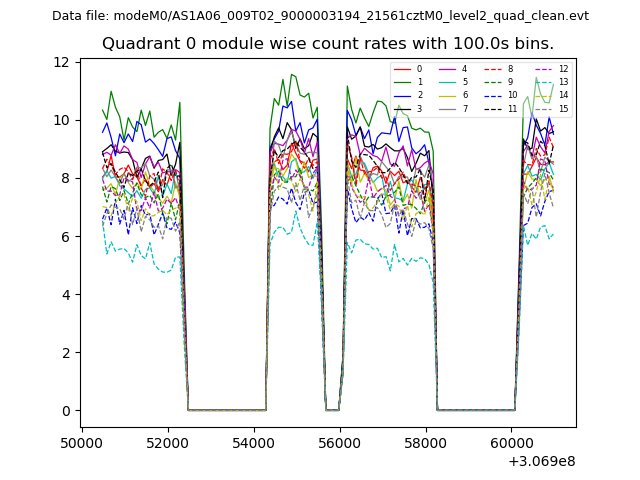 |
 |
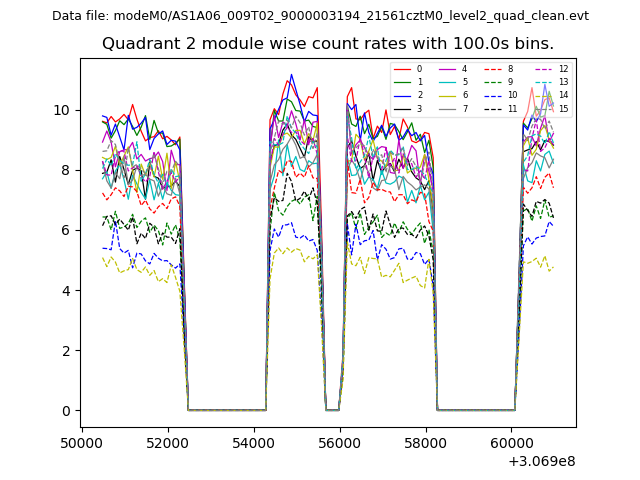
| Module-wise count rates for Quadrant B Data is divided into 100 sec bins |
 |
 |
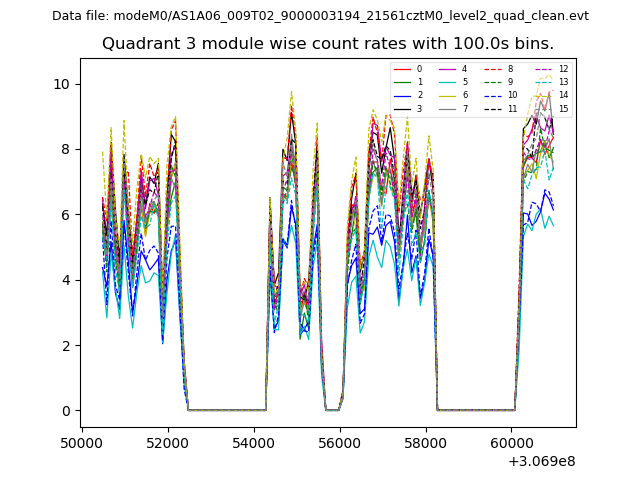
| Module-wise count rates for Quadrant C Data is divided into 100 sec bins |
 |
 |
| Module-wise count rates for Quadrant D Data is divided into 100 sec bins |
 |
 |
| Parameter | Plot |
|---|---|
| CZT HV Monitor | 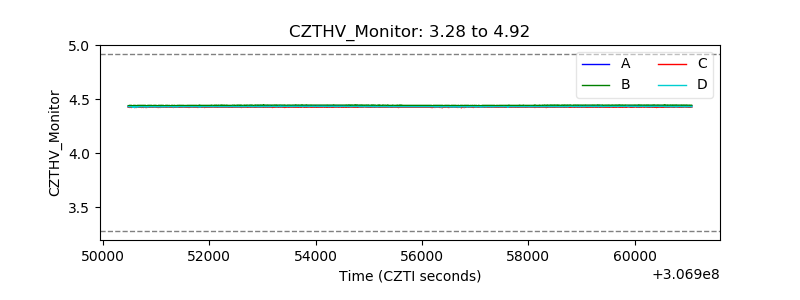 |
| D_VDD |  |
| Temperature 1 | 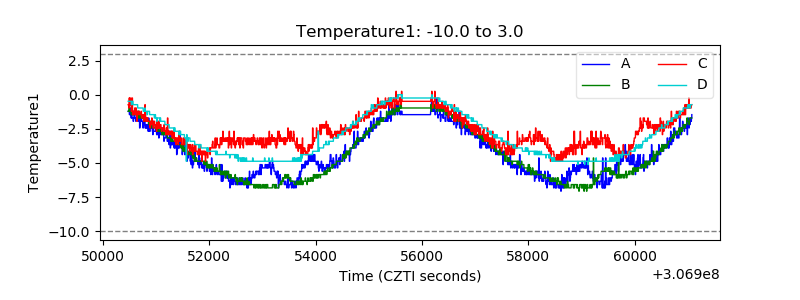 |
| Veto HV Monitor |  |
| Veto LLD | 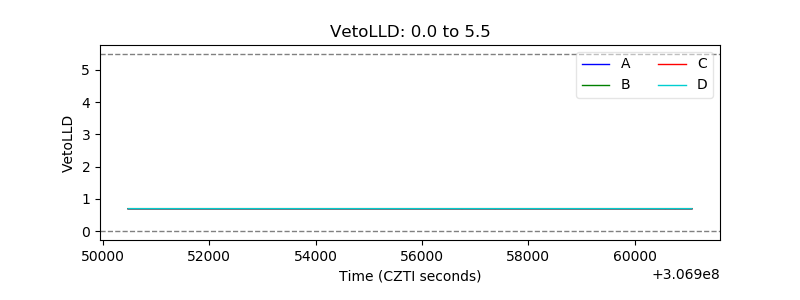 |
| Alpha Counter | 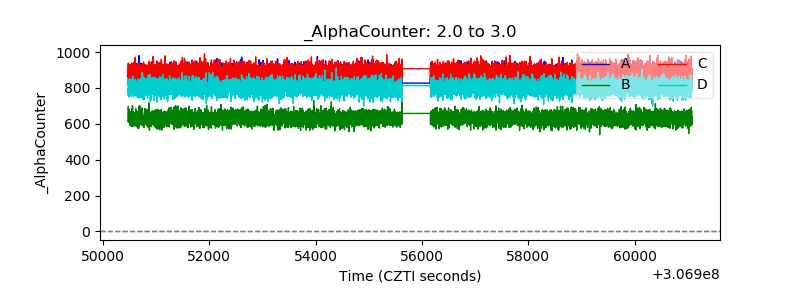 |
| _CPM_Rate | 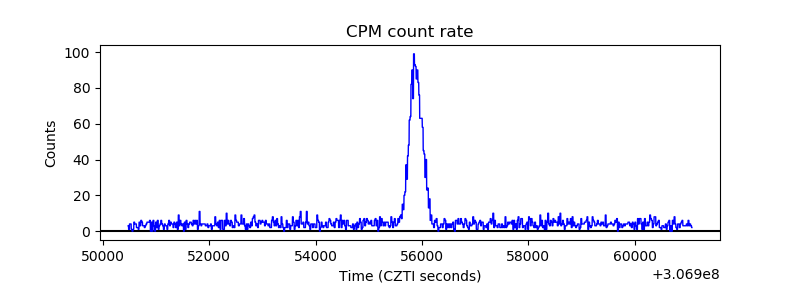 |
| CZT Counter | 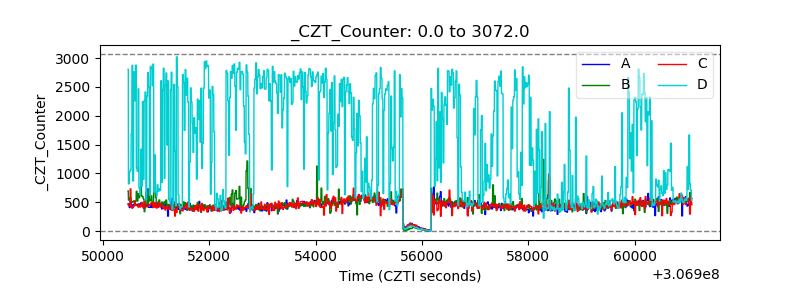 |
| +2.5 Volts monitor |  |
| +5 Volts monitor |  |
| _ROLL_ROT | 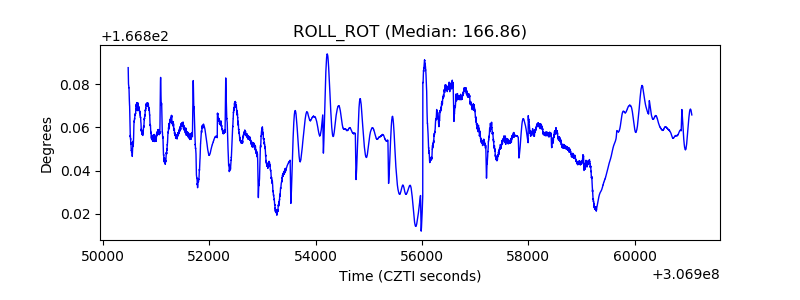 |
| _Roll_DEC | 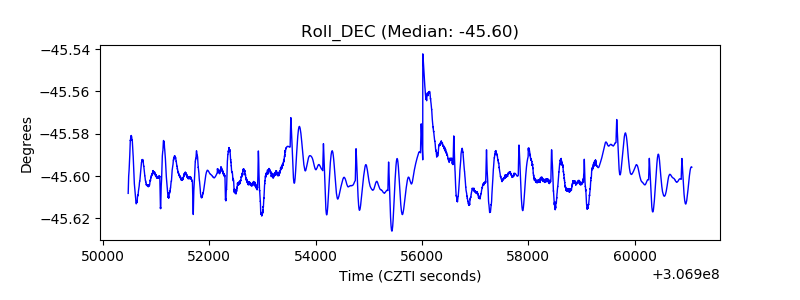 |
| _Roll_RA | 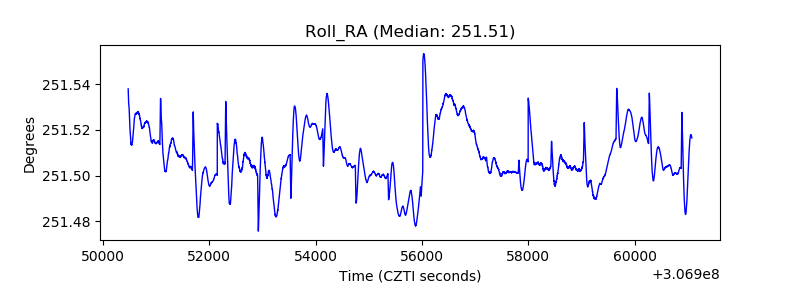 |
| Veto Counter | 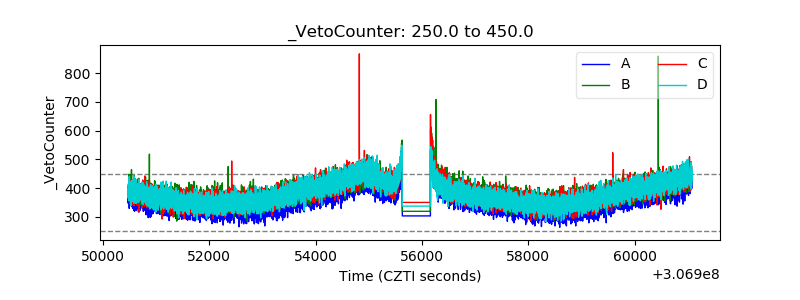 |