| Param | Original file | Final file |
|---|---|---|
| Filename | modeM0/AS1A06_009T05_9000003196cztM0_level2.fits | modeM0/AS1A06_009T05_9000003196cztM0_level2_quad_clean.evt |
| Size (bytes) | 205,606,080 | 165,294,720 |
| Size | 196.1 MB | 157.6 MB |
| Events in quadrant A | 1,271,336 | 931,440 |
| Events in quadrant B | 1,215,836 | 938,462 |
| Events in quadrant C | 1,246,102 | 900,874 |
| Events in quadrant D | 1,047,220 | 787,887 |
| Mode SS | |||
|---|---|---|---|
| Quadrant | BADHDUFLAG | Total packets | Discarded packets |
| A | 0 | 430 | 0 |
| B | 0 | 430 | 0 |
| C | 0 | 430 | 0 |
| D | 0 | 430 | 0 |
| Mode M0 | |||
|---|---|---|---|
| Quadrant | BADHDUFLAG | Total packets | Discarded packets |
| A | 0 | 43060 | 0 |
| B | 0 | 44571 | 0 |
| C | 0 | 42817 | 0 |
| D | 0 | 62016 | 0 |
| Mode M9 | |||
|---|---|---|---|
| Quadrant | BADHDUFLAG | Total packets | Discarded packets |
| A | 0 | 36 | 0 |
| B | 0 | 36 | 0 |
| C | 0 | 36 | 0 |
| D | 0 | 36 | 0 |
| Quadrant | Total seconds | Saturated seconds | Saturation percentage |
|---|---|---|---|
| A | 20995 | 129 | 0.614432% |
| B | 20995 | 152 | 0.723982% |
| C | 20995 | 172 | 0.819243% |
| D | 20995 | 1539 | 7.330317% |
Noise dominated data is calculated using 1-second bins in cleaned event files. If a bin has >2000 counts, and if more than 50% of those come from <1% of pixels, then it is considered to be noise-dominated and hence unusable.
| Quadrant | # 1 sec bins | Bins with >0 counts | Bins with >2000 counts | High rate bins dominated by noise | Noise dominated (total time) | Noise dominated (detector-on time) | Marked lightcurve |
|---|---|---|---|---|---|---|---|
| A | 24710 | 20995 | 0 | 0 | 0.00% | 0.00% |  |
| B | 24710 | 20995 | 0 | 0 | 0.00% | 0.00% | 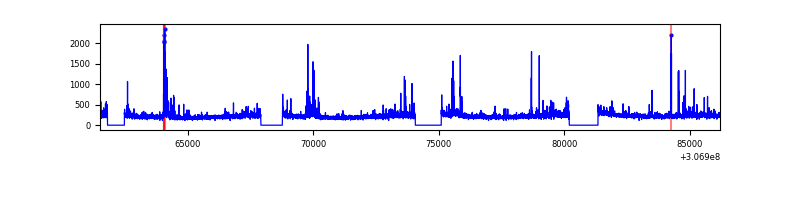 |
| C | 24710 | 20995 | 0 | 0 | 0.00% | 0.00% | 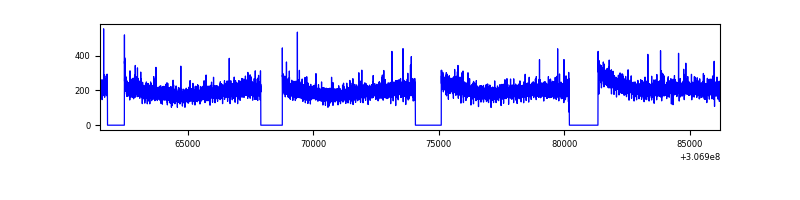 |
| D | 24710 | 20980 | 0 | 0 | 0.00% | 0.00% |  |
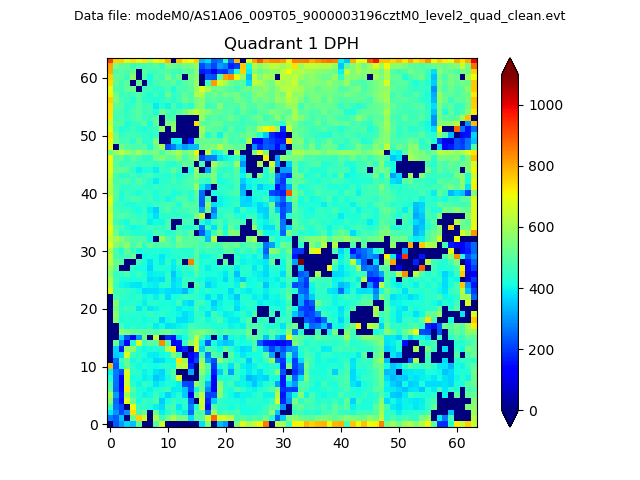
Top three noisy pixels from each quadrant. If the there are fewer than three noisy pixels in the level2.evt file, extra rows are filled as -1
| Pixel properties | Quadrant properties | ||||||
|---|---|---|---|---|---|---|---|
| Quadrant | DetID | PixID | Counts | Sigma | Mean | Median | Sigma |
| A | 0 | 29 | 1210 | 10.79 | 331 | 311 | 83.3 |
| A | 7 | 110 | 1006 | 8.34 | 331 | 311 | 83.3 |
| A | 0 | 30 | 959 | 7.77 | 331 | 311 | 83.3 |
| B | 2 | 9 | 982 | 10.5 | 322 | 309 | 64.1 |
| B | 2 | 8 | 831 | 8.15 | 322 | 309 | 64.1 |
| B | 14 | 254 | 809 | 7.8 | 322 | 309 | 64.1 |
| C | 9 | 209 | 817 | 6.01 | 329 | 309 | 84.5 |
| C | 3 | 235 | 814 | 5.97 | 329 | 309 | 84.5 |
| C | 3 | 126 | 808 | 5.9 | 329 | 309 | 84.5 |
| D | 6 | 231 | 803 | 6.54 | 299 | 273 | 81.1 |
| D | 3 | 14 | 783 | 6.29 | 299 | 273 | 81.1 |
| D | 6 | 67 | 733 | 5.67 | 299 | 273 | 81.1 |
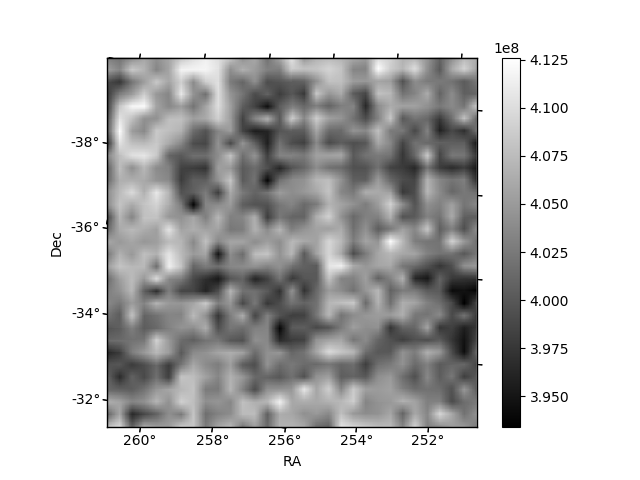
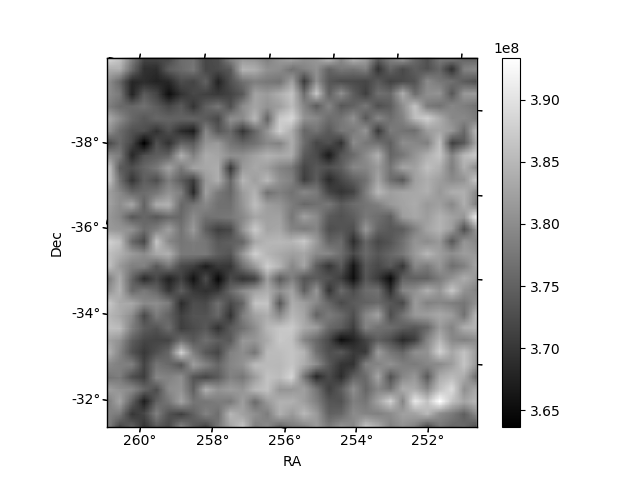
Histogram calculated using DETX and DETY for each event in the final _common_clean file
| Quadrant A | 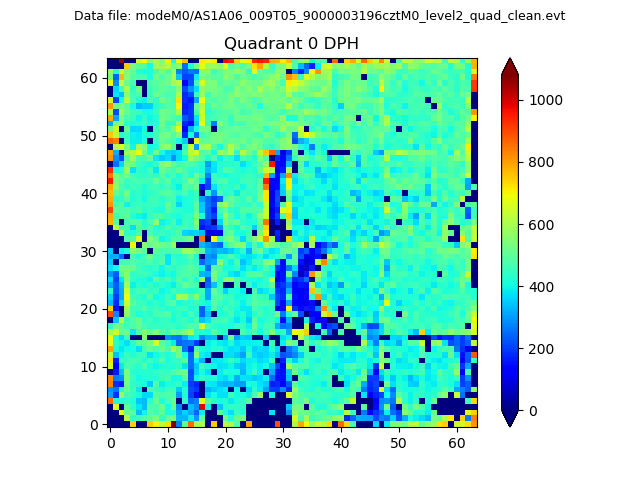 |
 |
Quadrant B |
|---|---|---|---|
| Quadrant D |  |
 |
Quadrant C |
| Plot type | Count rate plots | Images |
|---|---|---|
| Comparison with Poisson distribution Blue bars denote a histogram of data divided into 1 sec bins. Red curve is a Poisson curve with rate = median count rate of data. |
 |
 |
| Quadrant-wise count rates Data is divided into 100 sec bins |
 |
|
| Module-wise count rates for Quadrant A Data is divided into 100 sec bins |
 |
 |
| Module-wise count rates for Quadrant B Data is divided into 100 sec bins |
 |
 |
| Module-wise count rates for Quadrant C Data is divided into 100 sec bins |
 |
 |
| Module-wise count rates for Quadrant D Data is divided into 100 sec bins |
 |
 |
| Parameter | Plot |
|---|---|
| CZT HV Monitor |  |
| D_VDD | 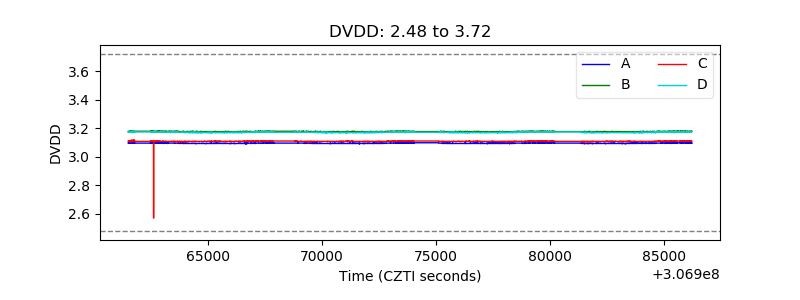 |
| Temperature 1 |  |
| Veto HV Monitor | 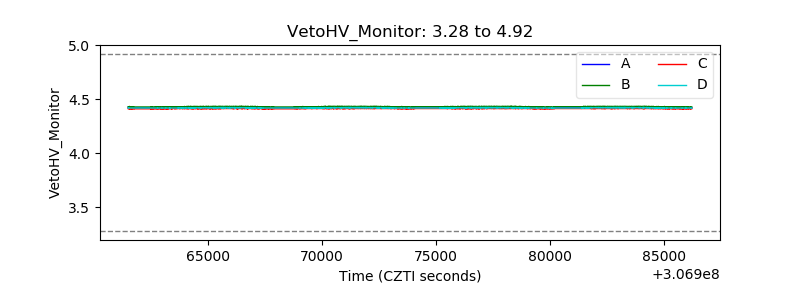 |
| Veto LLD |  |
| Alpha Counter | 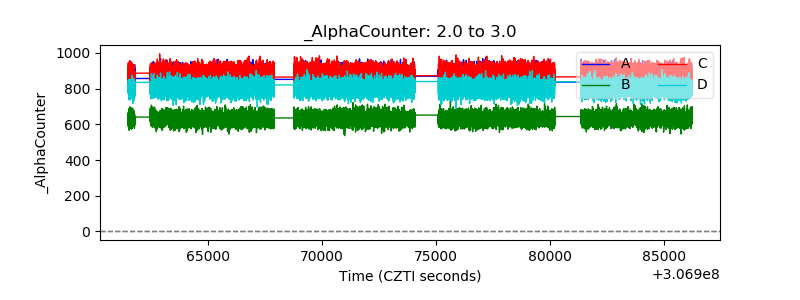 |
| _CPM_Rate | 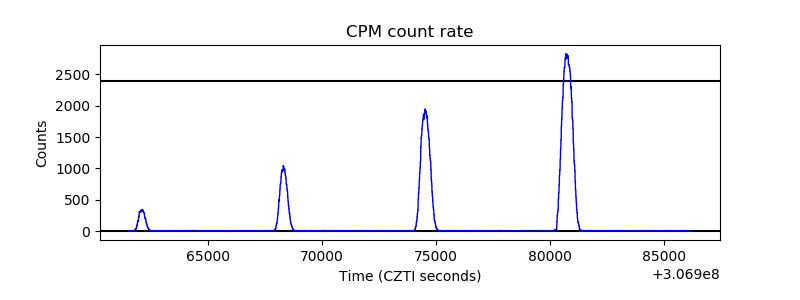 |
| CZT Counter | 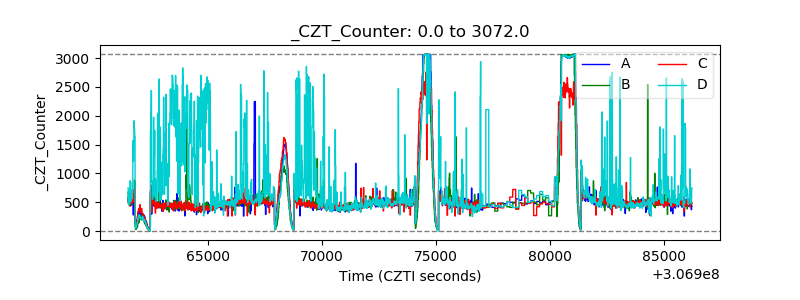 |
| +2.5 Volts monitor | 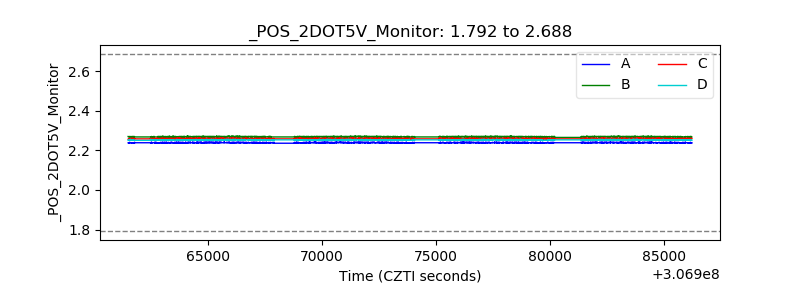 |
| +5 Volts monitor |  |
| _ROLL_ROT |  |
| _Roll_DEC |  |
| _Roll_RA |  |
| Veto Counter | 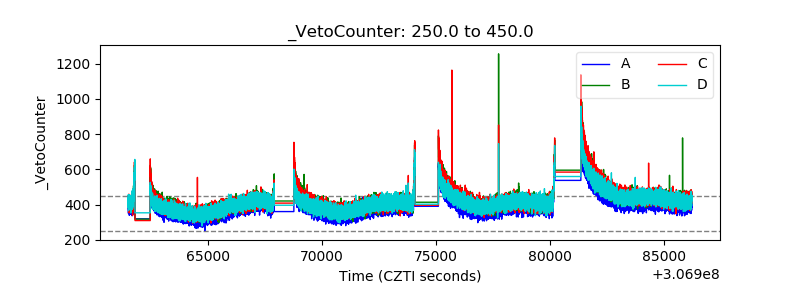 |