| Param | Original file | Final file |
|---|---|---|
| Filename | modeM0/AS1A06_009T05_9000003196_21561cztM0_level2.evt | modeM0/AS1A06_009T05_9000003196_21561cztM0_level2_quad_clean.evt |
| Size (bytes) | 628,824,960 | 96,762,240 |
| Size | 599.7 MB | 92.3 MB |
| Events in quadrant A | 3,405,925 | 630,425 |
| Events in quadrant B | 3,673,449 | 640,921 |
| Events in quadrant C | 3,353,960 | 615,145 |
| Events in quadrant D | 8,124,411 | 543,450 |
| Mode SS | |||
|---|---|---|---|
| Quadrant | BADHDUFLAG | Total packets | Discarded packets |
| A | 0 | 150 | 0 |
| B | 0 | 150 | 0 |
| C | 0 | 150 | 0 |
| D | 0 | 150 | 0 |
| Mode M0 | |||
|---|---|---|---|
| Quadrant | BADHDUFLAG | Total packets | Discarded packets |
| A | 0 | 14826 | 2 |
| B | 0 | 15425 | 2 |
| C | 0 | 14561 | 2 |
| D | 0 | 28956 | 2 |
| Mode M9 | |||
|---|---|---|---|
| Quadrant | BADHDUFLAG | Total packets | Discarded packets |
| A | 0 | 14 | 0 |
| B | 0 | 14 | 0 |
| C | 0 | 14 | 0 |
| D | 0 | 14 | 0 |
| Quadrant | Total seconds | Saturated seconds | Saturation percentage |
|---|---|---|---|
| A | 7172 | 66 | 0.920245% |
| B | 7172 | 59 | 0.822644% |
| C | 7172 | 63 | 0.878416% |
| D | 7172 | 1200 | 16.731735% |
Noise dominated data is calculated using 1-second bins in cleaned event files. If a bin has >2000 counts, and if more than 50% of those come from <1% of pixels, then it is considered to be noise-dominated and hence unusable.
| Quadrant | # 1 sec bins | Bins with >0 counts | Bins with >2000 counts | High rate bins dominated by noise | Noise dominated (total time) | Noise dominated (detector-on time) | Marked lightcurve |
|---|---|---|---|---|---|---|---|
| A | 8707 | 7174 | 21 | 21 | 0.24% | 0.29% | 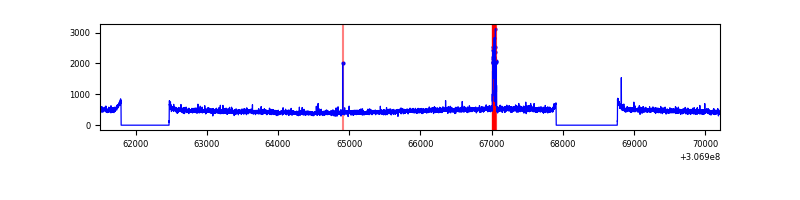 |
| B | 8707 | 7174 | 16 | 16 | 0.18% | 0.22% | 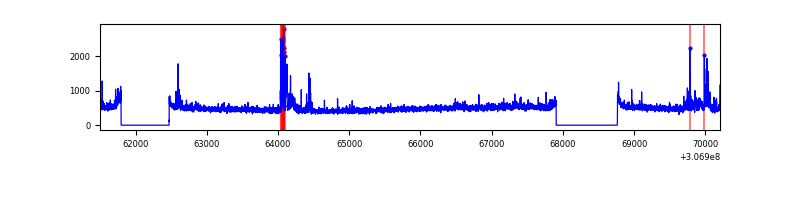 |
| C | 8707 | 7174 | 0 | 0 | 0.00% | 0.00% | 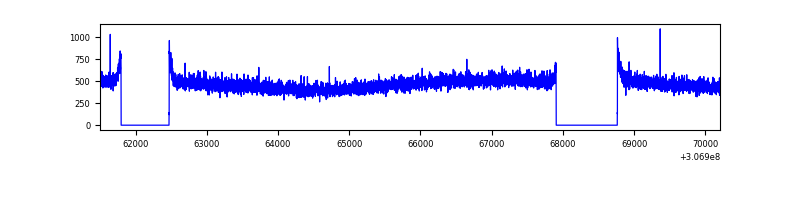 |
| D | 8707 | 7174 | 1231 | 1231 | 14.14% | 17.16% | 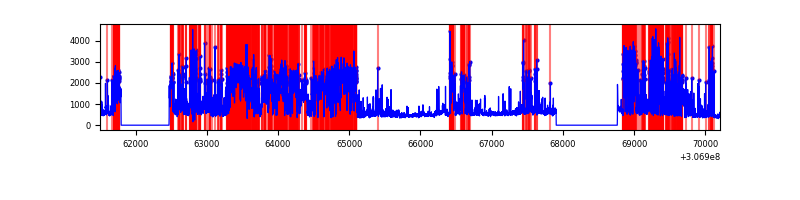 |
Top three noisy pixels from each quadrant. If the there are fewer than three noisy pixels in the level2.evt file, extra rows are filled as -1
| Pixel properties | Quadrant properties | ||||||
|---|---|---|---|---|---|---|---|
| Quadrant | DetID | PixID | Counts | Sigma | Mean | Median | Sigma |
| A | 15 | 174 | 81448 | 467.63 | 859 | 841 | 172.4 |
| A | 13 | 254 | 11454 | 61.57 | 859 | 841 | 172.4 |
| A | 12 | 96 | 9219 | 48.6 | 859 | 841 | 172.4 |
| B | 0 | 228 | 158161 | 957.1 | 863 | 842 | 164.4 |
| B | 0 | 230 | 92073 | 555.03 | 863 | 842 | 164.4 |
| B | 0 | 190 | 24431 | 143.51 | 863 | 842 | 164.4 |
| C | 14 | 238 | 129338 | 661.15 | 823 | 827 | 194.4 |
| C | 3 | 233 | 14732 | 71.54 | 823 | 827 | 194.4 |
| C | 13 | 61 | 5815 | 25.66 | 823 | 827 | 194.4 |
| D | 1 | 52 | 3751825 | 19806.13 | 783 | 760 | 189.4 |
| D | 2 | 136 | 733172 | 3867.23 | 783 | 760 | 189.4 |
| D | 13 | 153 | 154243 | 810.41 | 783 | 760 | 189.4 |
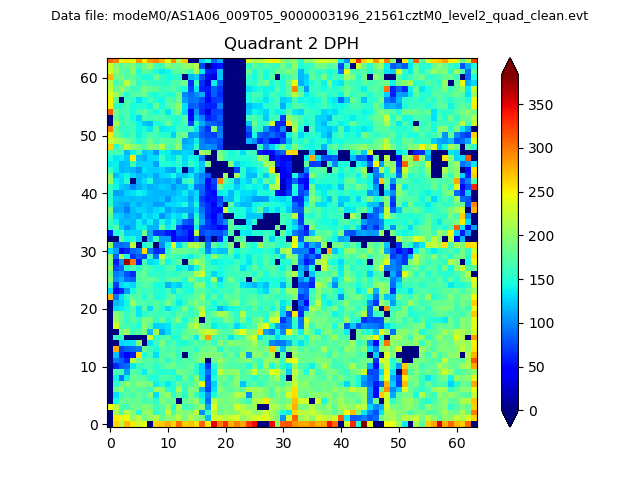
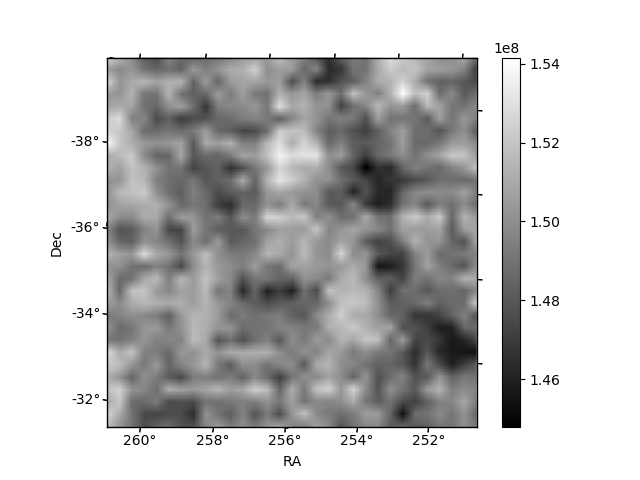
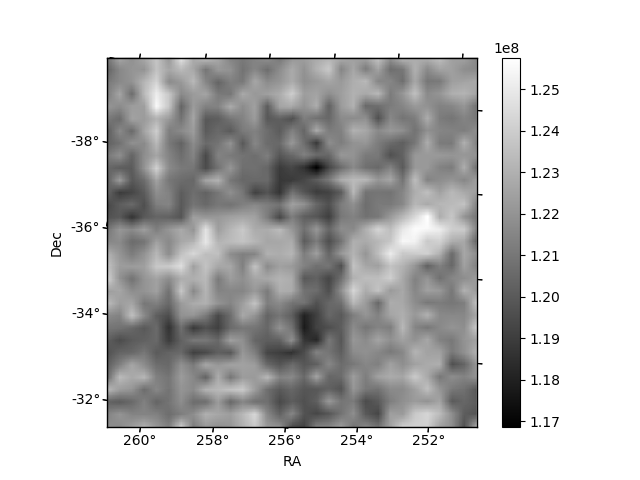
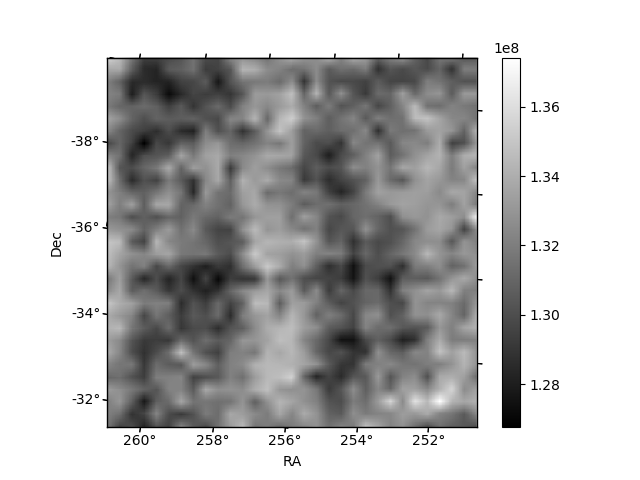
Histogram calculated using DETX and DETY for each event in the final _common_clean file
| Quadrant A |  |
 |
Quadrant B |
|---|---|---|---|
| Quadrant D | 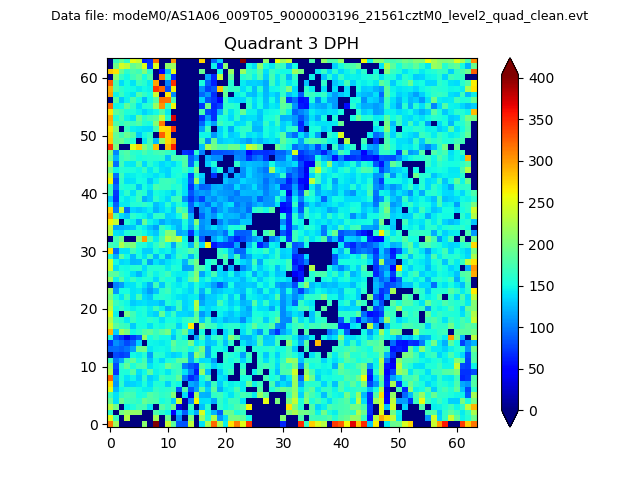 |
 |
Quadrant C |
| Plot type | Count rate plots | Images |
|---|---|---|
| Comparison with Poisson distribution Blue bars denote a histogram of data divided into 1 sec bins. Red curve is a Poisson curve with rate = median count rate of data. |
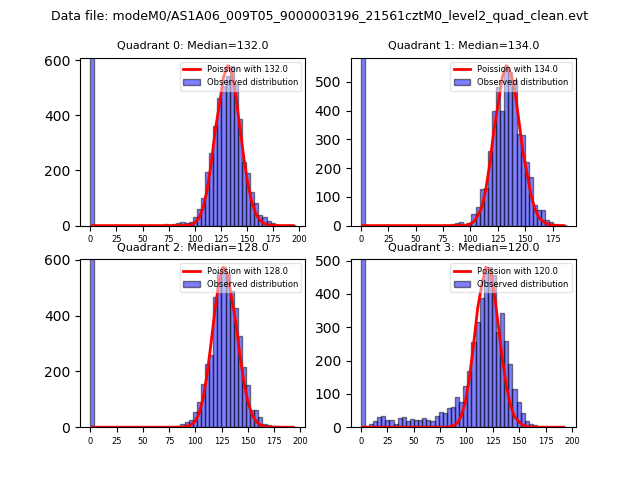 |
 |
| Quadrant-wise count rates Data is divided into 100 sec bins |
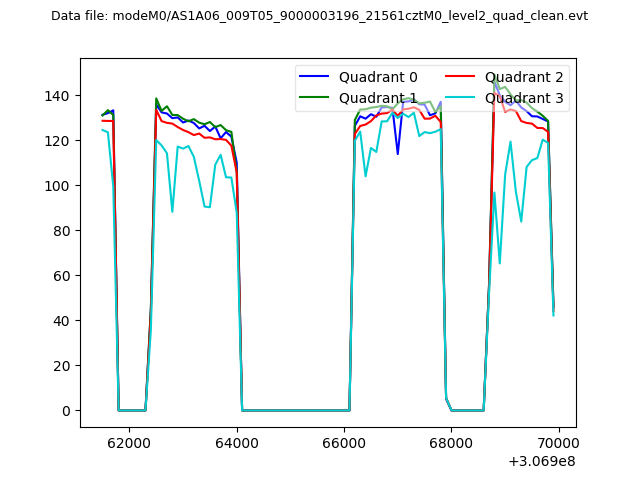 |
|
| Module-wise count rates for Quadrant A Data is divided into 100 sec bins |
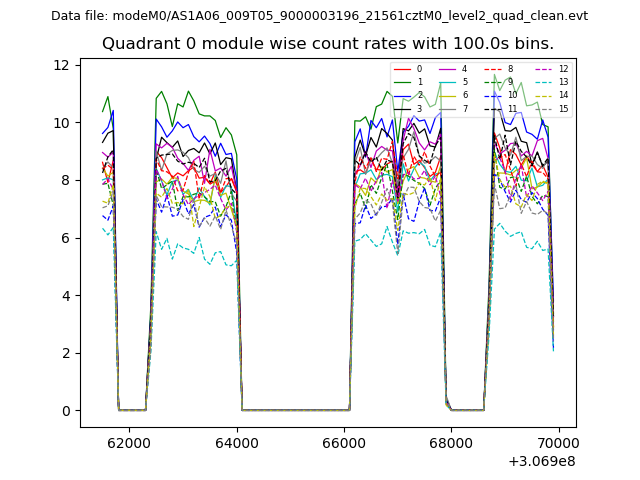 |
 |
| Module-wise count rates for Quadrant B Data is divided into 100 sec bins |
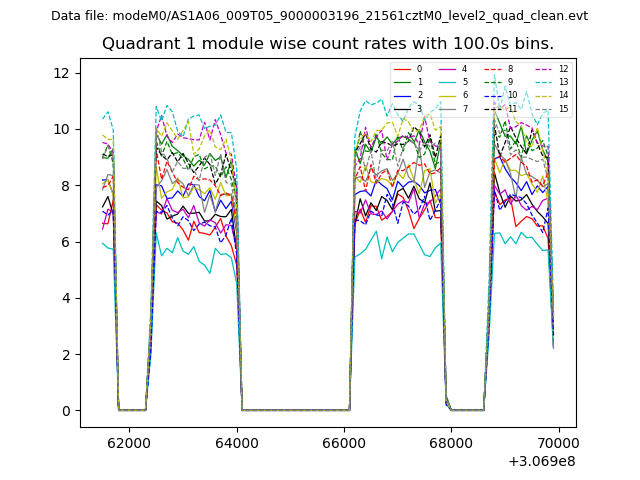 |
 |
| Module-wise count rates for Quadrant C Data is divided into 100 sec bins |
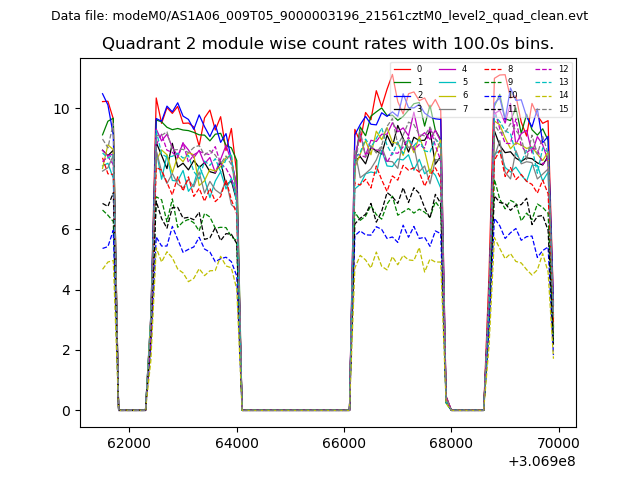 |
 |
| Module-wise count rates for Quadrant D Data is divided into 100 sec bins |
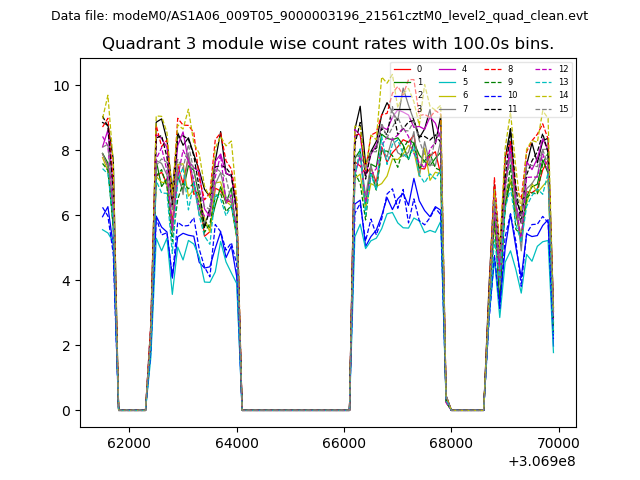 |
 |
| Parameter | Plot |
|---|---|
| CZT HV Monitor | 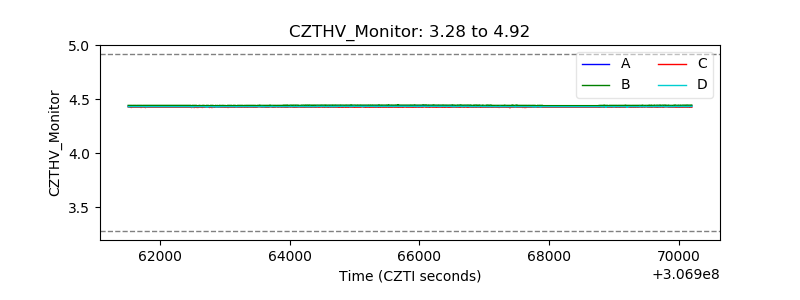 |
| D_VDD | 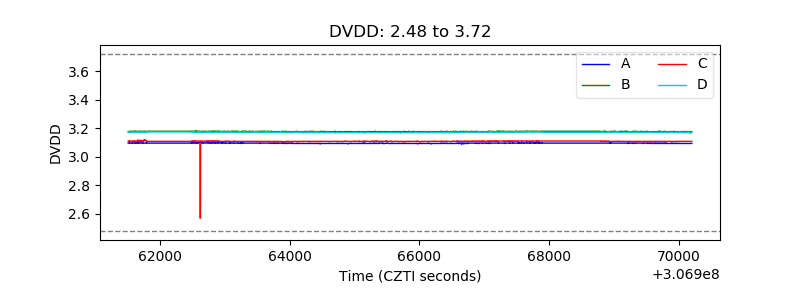 |
| Temperature 1 | 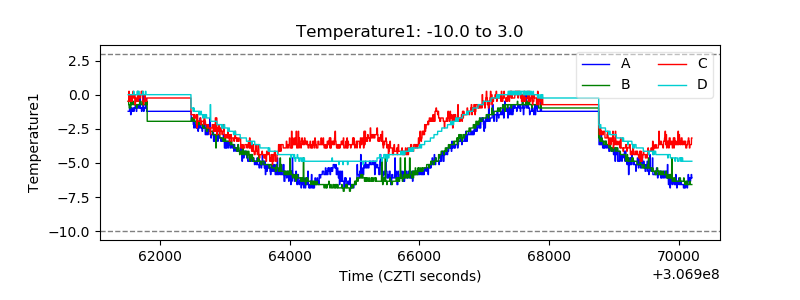 |
| Veto HV Monitor | 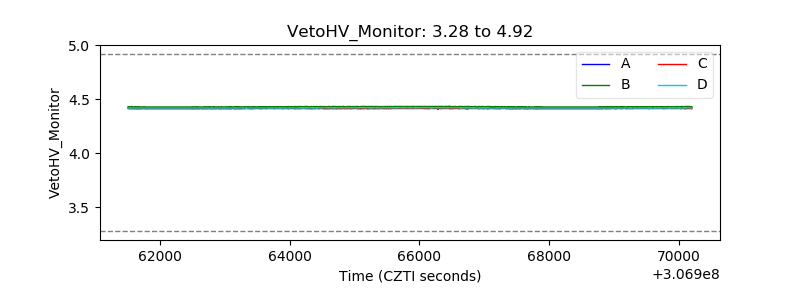 |
| Veto LLD | 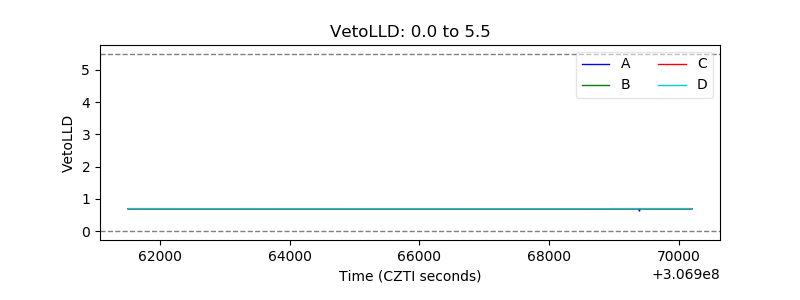 |
| Alpha Counter | 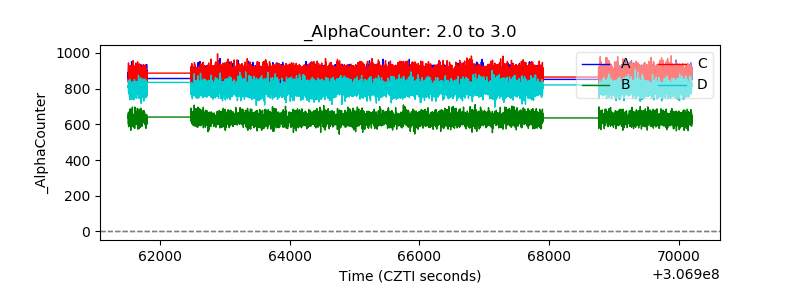 |
| _CPM_Rate | 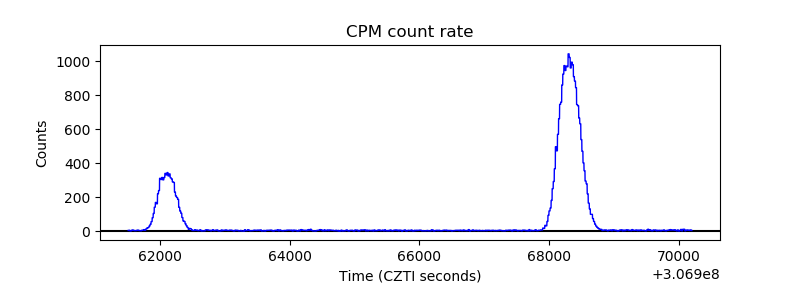 |
| CZT Counter | 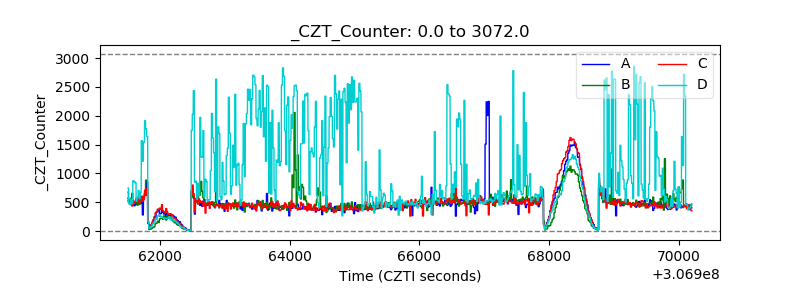 |
| +2.5 Volts monitor |  |
| +5 Volts monitor | 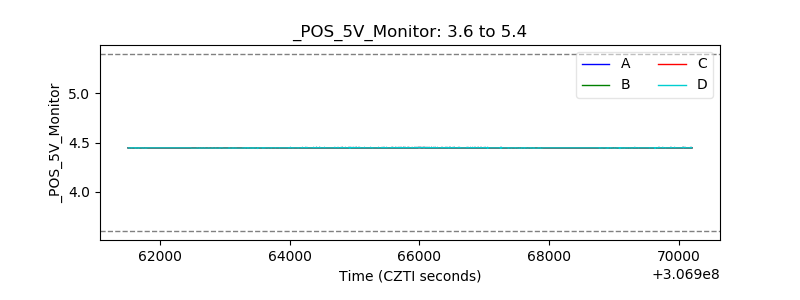 |
| _ROLL_ROT | 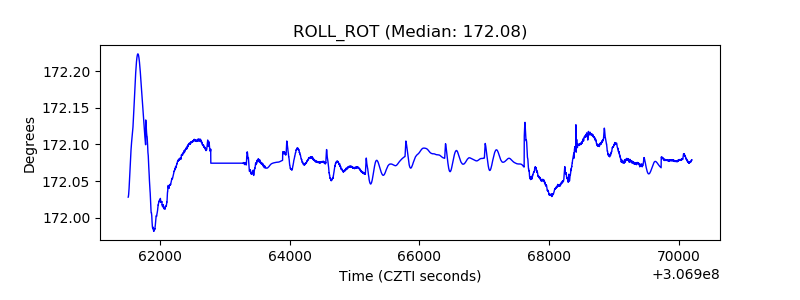 |
| _Roll_DEC | 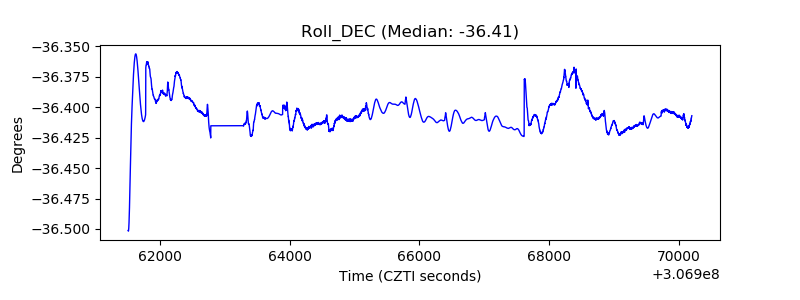 |
| _Roll_RA | 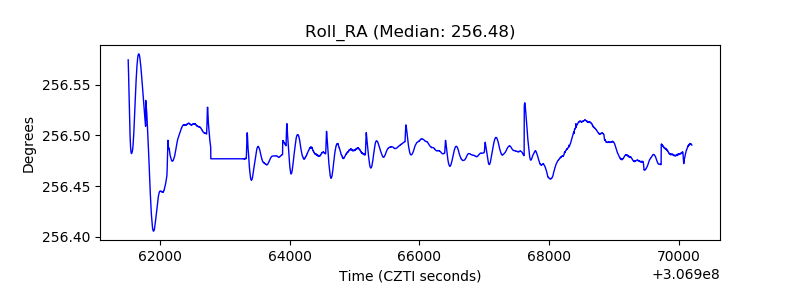 |
| Veto Counter | 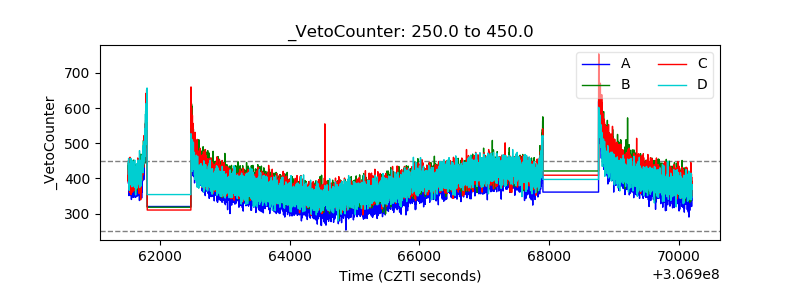 |