| Param | Original file | Final file |
|---|---|---|
| Filename | modeM0/AS1A06_009T05_9000003196_21562cztM0_level2.evt | modeM0/AS1A06_009T05_9000003196_21562cztM0_level2_quad_clean.evt |
| Size (bytes) | 468,362,880 | 80,144,640 |
| Size | 446.7 MB | 76.4 MB |
| Events in quadrant A | 3,052,271 | 506,369 |
| Events in quadrant B | 3,302,204 | 514,486 |
| Events in quadrant C | 3,067,841 | 493,849 |
| Events in quadrant D | 4,320,040 | 458,237 |
| Mode SS | |||
|---|---|---|---|
| Quadrant | BADHDUFLAG | Total packets | Discarded packets |
| A | 0 | 130 | 0 |
| B | 0 | 130 | 0 |
| C | 0 | 130 | 0 |
| D | 0 | 130 | 0 |
| Mode M0 | |||
|---|---|---|---|
| Quadrant | BADHDUFLAG | Total packets | Discarded packets |
| A | 0 | 13220 | 1 |
| B | 0 | 13874 | 1 |
| C | 0 | 13186 | 1 |
| D | 0 | 17166 | 1 |
| Mode M9 | |||
|---|---|---|---|
| Quadrant | BADHDUFLAG | Total packets | Discarded packets |
| A | 0 | 11 | 0 |
| B | 0 | 11 | 0 |
| C | 0 | 11 | 0 |
| D | 0 | 11 | 0 |
| Quadrant | Total seconds | Saturated seconds | Saturation percentage |
|---|---|---|---|
| A | 6512 | 34 | 0.522113% |
| B | 6513 | 49 | 0.752341% |
| C | 6513 | 47 | 0.721634% |
| D | 6513 | 357 | 5.481345% |
Noise dominated data is calculated using 1-second bins in cleaned event files. If a bin has >2000 counts, and if more than 50% of those come from <1% of pixels, then it is considered to be noise-dominated and hence unusable.
| Quadrant | # 1 sec bins | Bins with >0 counts | Bins with >2000 counts | High rate bins dominated by noise | Noise dominated (total time) | Noise dominated (detector-on time) | Marked lightcurve |
|---|---|---|---|---|---|---|---|
| A | 7547 | 6513 | 0 | 0 | 0.00% | 0.00% | 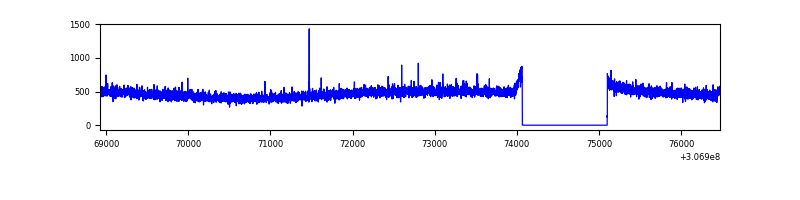 |
| B | 7548 | 6514 | 4 | 4 | 0.05% | 0.06% | 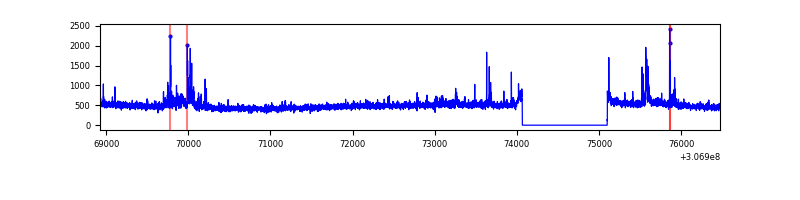 |
| C | 7548 | 6514 | 0 | 0 | 0.00% | 0.00% | 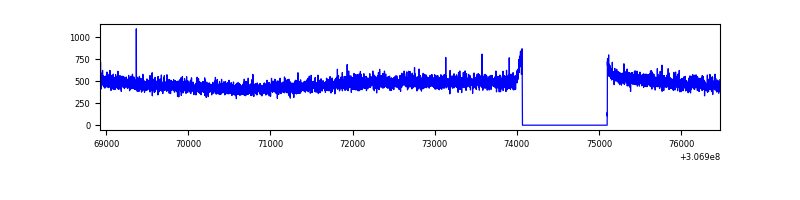 |
| D | 7548 | 6514 | 297 | 297 | 3.93% | 4.56% | 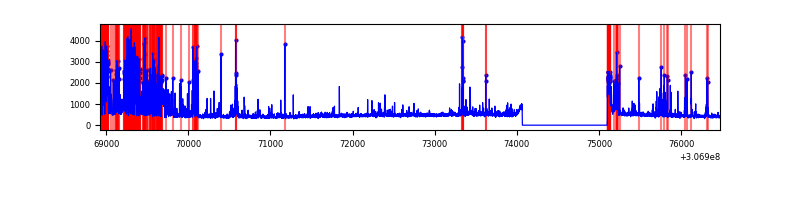 |
Top three noisy pixels from each quadrant. If the there are fewer than three noisy pixels in the level2.evt file, extra rows are filled as -1
| Pixel properties | Quadrant properties | ||||||
|---|---|---|---|---|---|---|---|
| Quadrant | DetID | PixID | Counts | Sigma | Mean | Median | Sigma |
| A | 13 | 254 | 10601 | 61.95 | 788 | 774 | 158.6 |
| A | 0 | 226 | 6767 | 37.78 | 788 | 774 | 158.6 |
| A | 3 | 137 | 6352 | 35.17 | 788 | 774 | 158.6 |
| B | 0 | 228 | 100879 | 661.08 | 791 | 771 | 151.4 |
| B | 0 | 230 | 73685 | 481.5 | 791 | 771 | 151.4 |
| B | 12 | 111 | 17817 | 112.57 | 791 | 771 | 151.4 |
| C | 14 | 238 | 120216 | 676.35 | 756 | 760 | 176.6 |
| C | 13 | 61 | 5425 | 26.41 | 756 | 760 | 176.6 |
| C | 3 | 233 | 1882 | 6.35 | 756 | 760 | 176.6 |
| D | 1 | 52 | 997717 | 5522.01 | 742 | 719 | 180.5 |
| D | 2 | 136 | 166471 | 918.04 | 742 | 719 | 180.5 |
| D | 7 | 38 | 146195 | 805.74 | 742 | 719 | 180.5 |
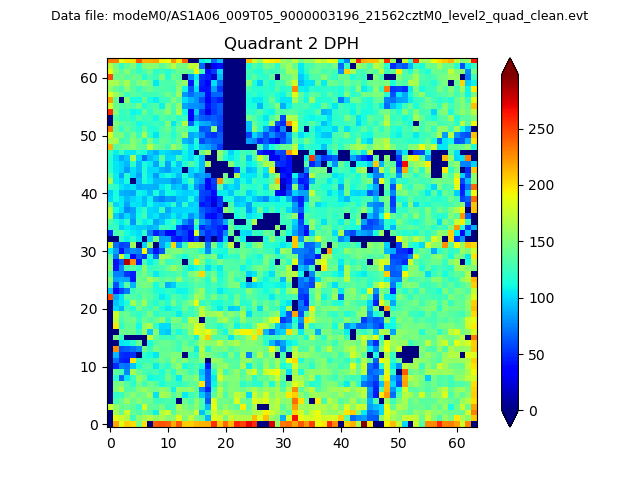
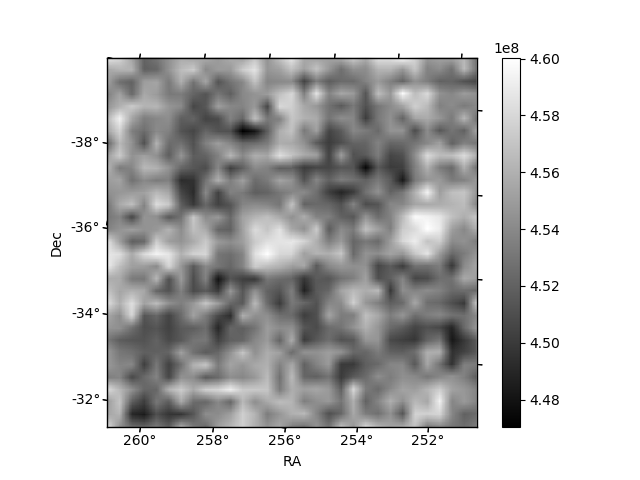
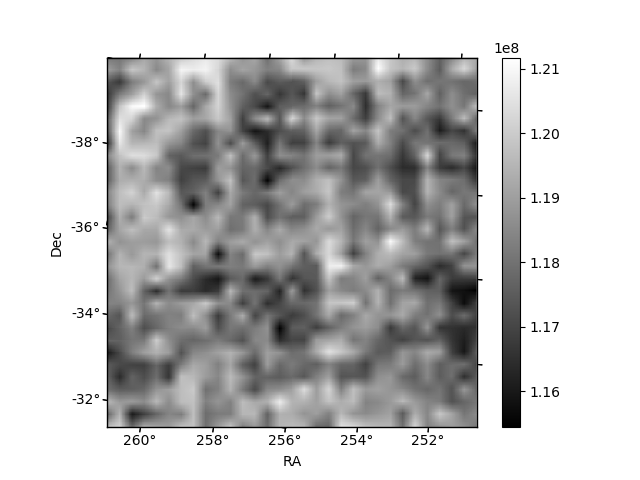
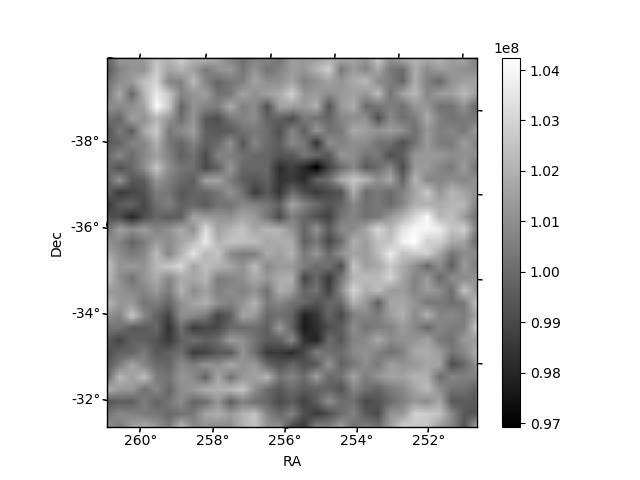
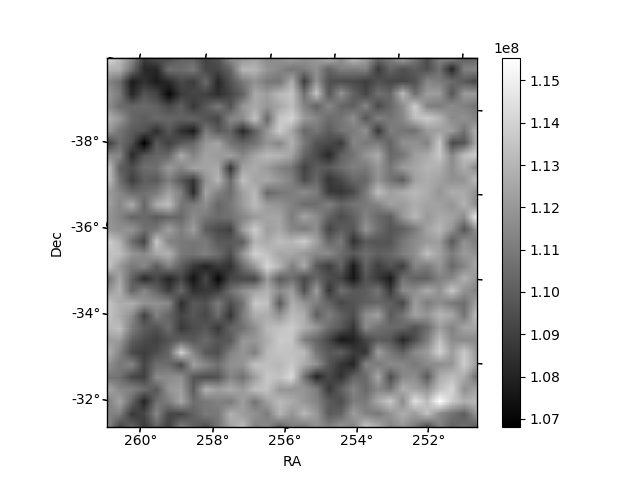
Histogram calculated using DETX and DETY for each event in the final _common_clean file
| Quadrant A | 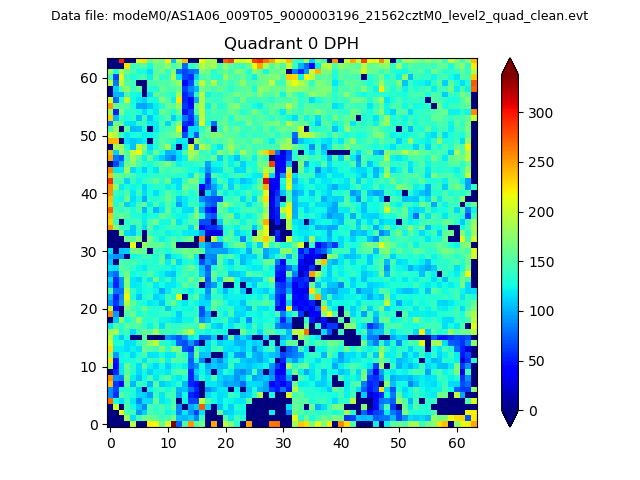 |
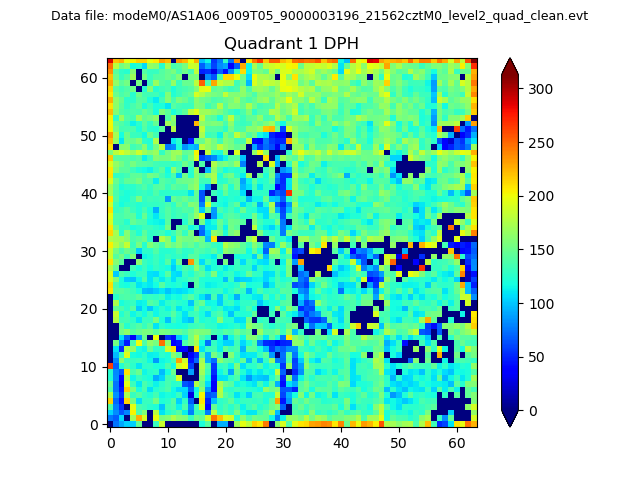 |
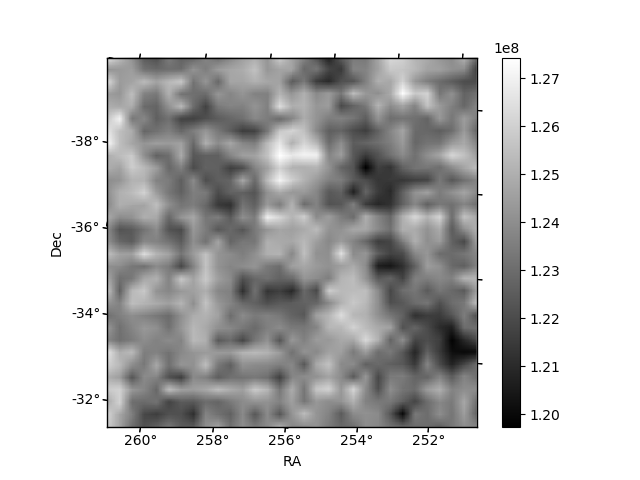
Quadrant B |
|---|---|---|---|
| Quadrant D | 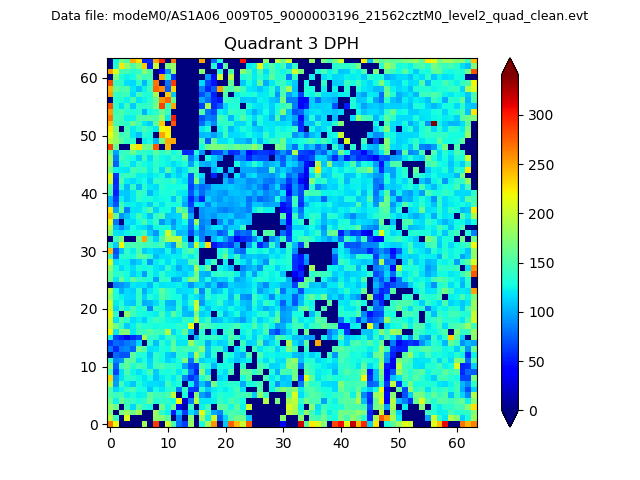 |
 |
Quadrant C |
| Plot type | Count rate plots | Images |
|---|---|---|
| Comparison with Poisson distribution Blue bars denote a histogram of data divided into 1 sec bins. Red curve is a Poisson curve with rate = median count rate of data. |
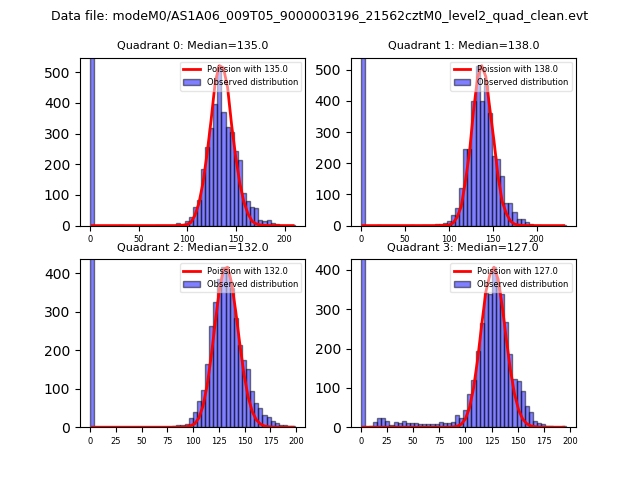 |
 |
| Quadrant-wise count rates Data is divided into 100 sec bins |
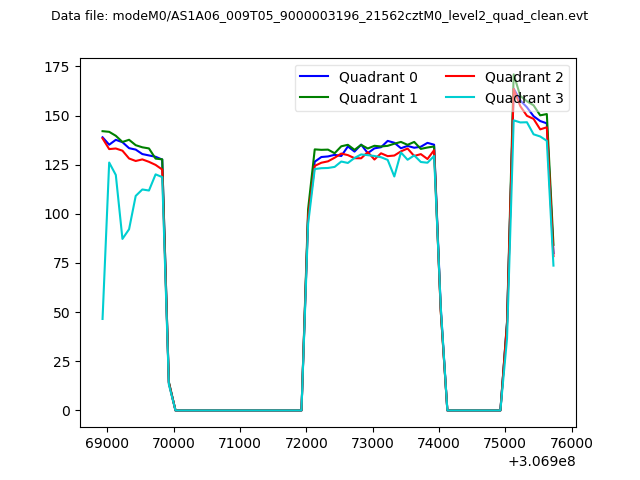 |
|
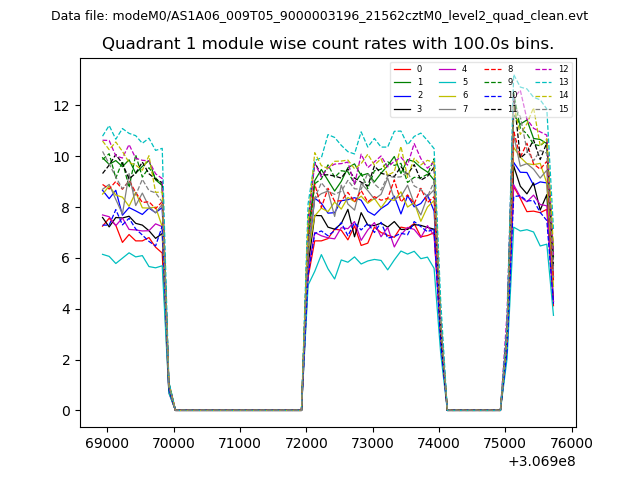
| Module-wise count rates for Quadrant A Data is divided into 100 sec bins |
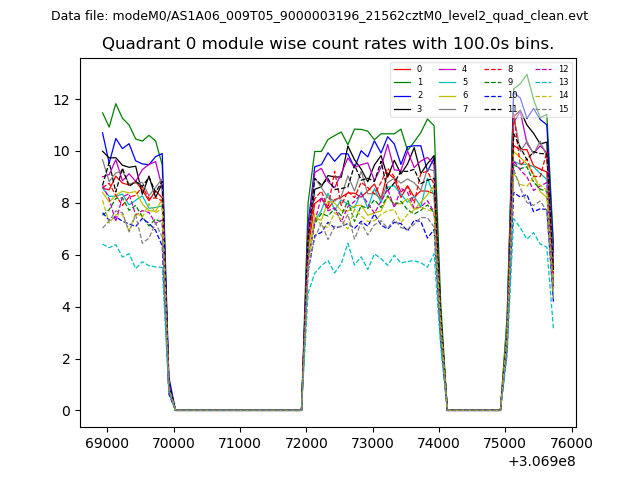 |
 |
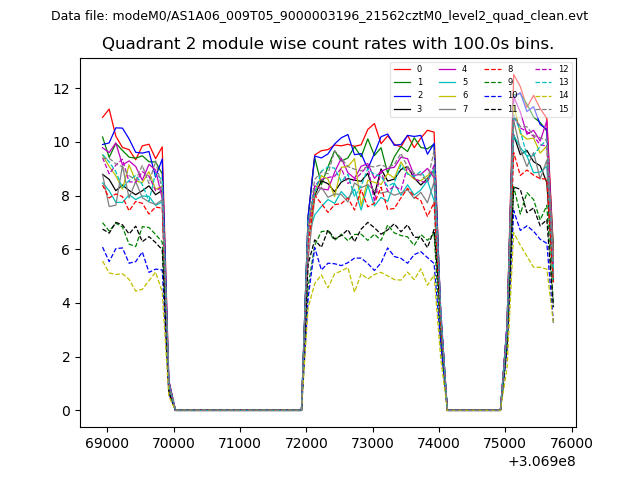
| Module-wise count rates for Quadrant B Data is divided into 100 sec bins |
 |
 |
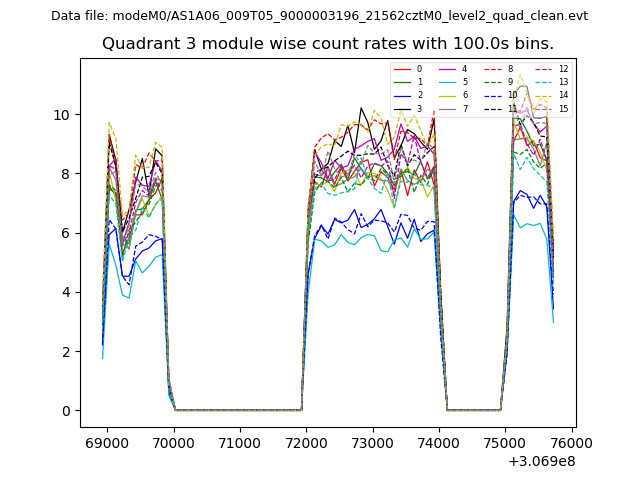
| Module-wise count rates for Quadrant C Data is divided into 100 sec bins |
 |
 |
| Module-wise count rates for Quadrant D Data is divided into 100 sec bins |
 |
 |
| Parameter | Plot |
|---|---|
| CZT HV Monitor | 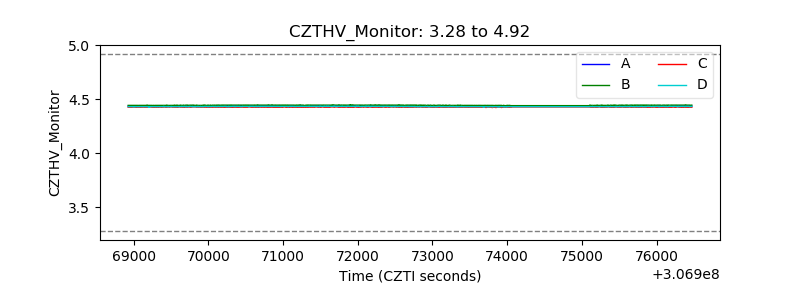 |
| D_VDD | 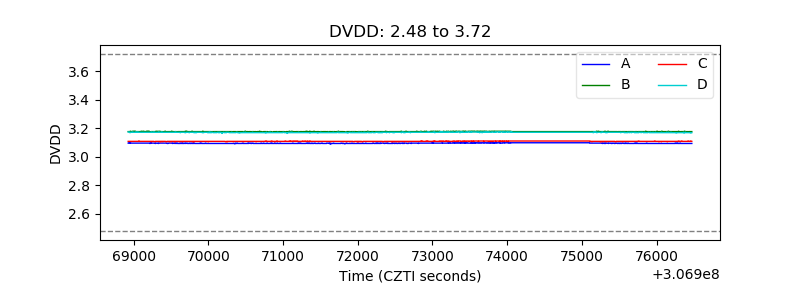 |
| Temperature 1 | 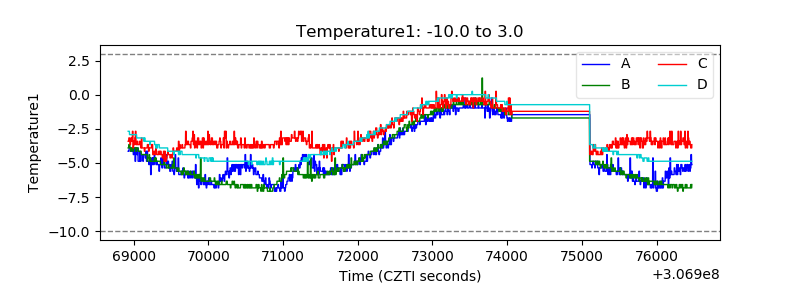 |
| Veto HV Monitor | 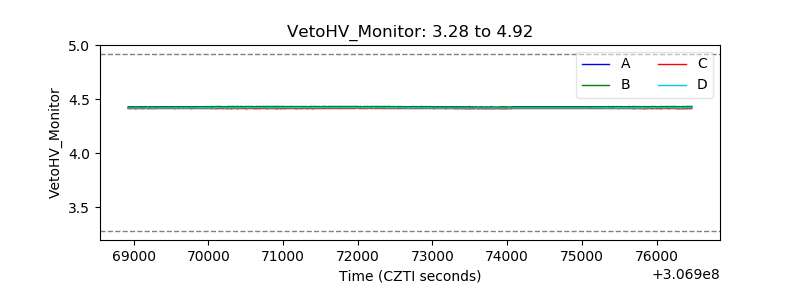 |
| Veto LLD | 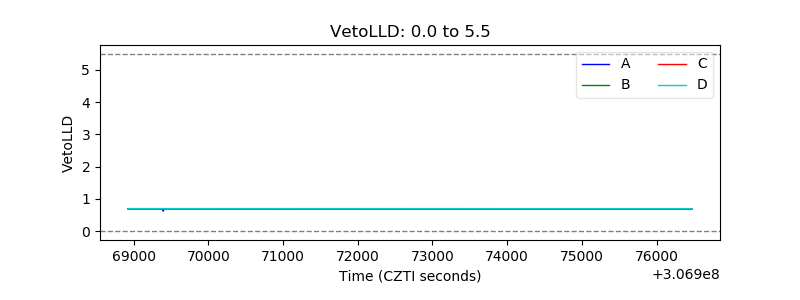 |
| Alpha Counter | 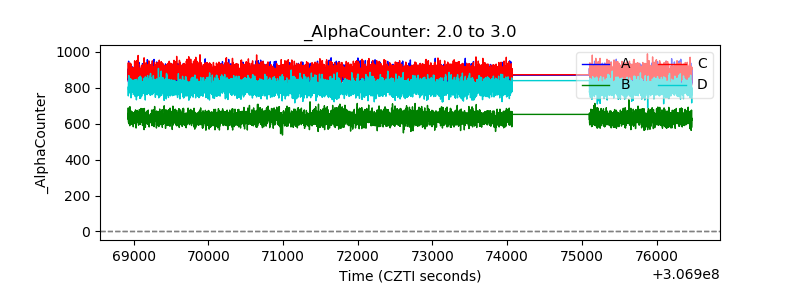 |
| _CPM_Rate | 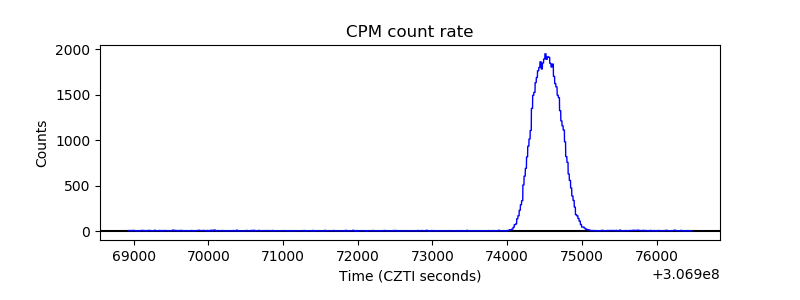 |
| CZT Counter | 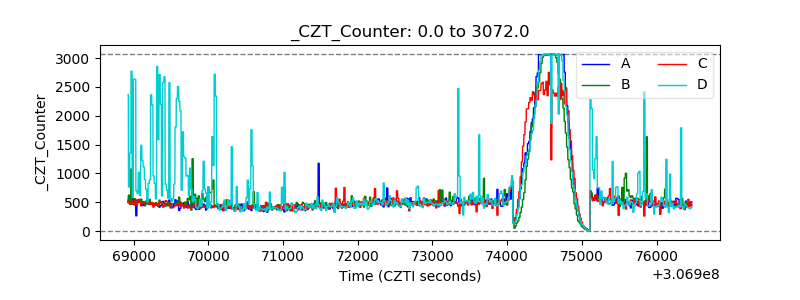 |
| +2.5 Volts monitor | 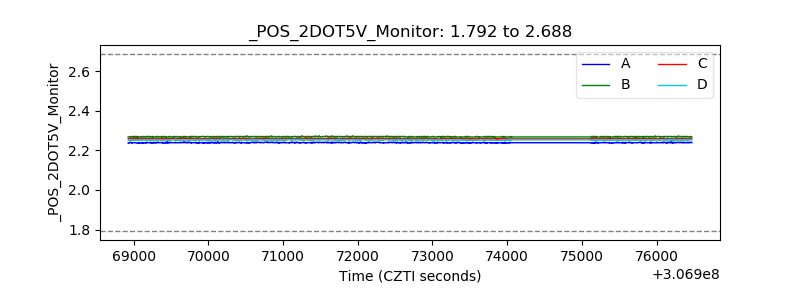 |
| +5 Volts monitor | 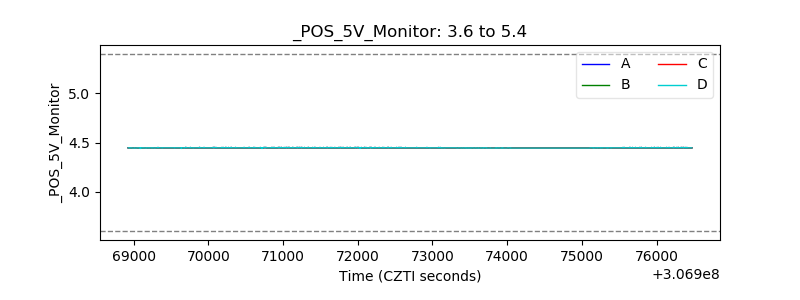 |
| _ROLL_ROT | 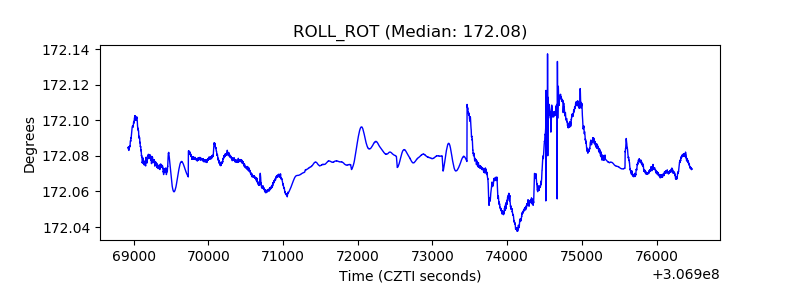 |
| _Roll_DEC | 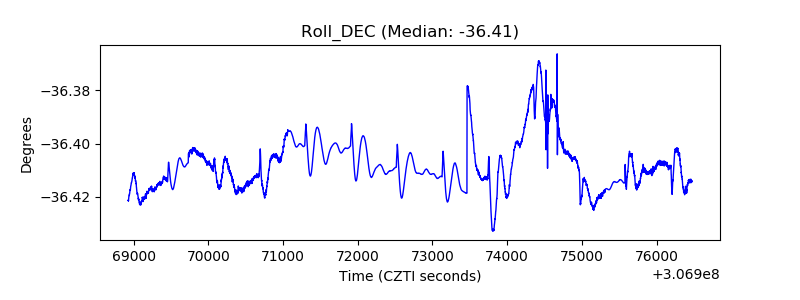 |
| _Roll_RA | 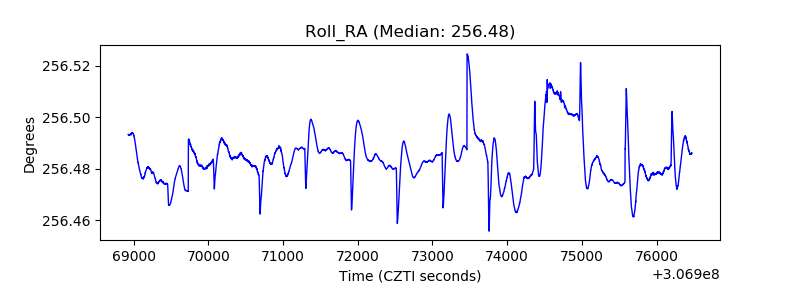 |
| Veto Counter | 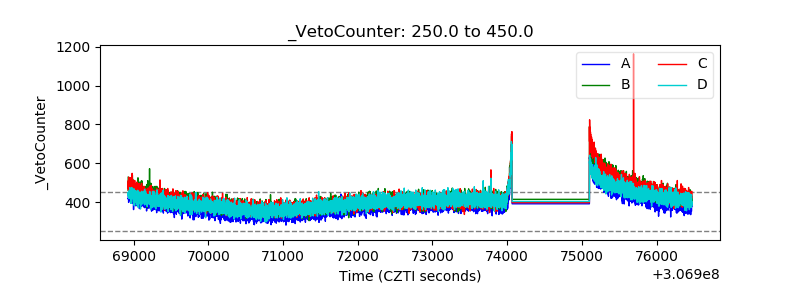 |