| Param | Original file | Final file |
|---|---|---|
| Filename | modeM0/AS1A05_155T02_9000003200cztM0_level2.fits | modeM0/AS1A05_155T02_9000003200cztM0_level2_quad_clean.evt |
| Size (bytes) | 420,281,280 | 346,700,160 |
| Size | 400.8 MB | 330.6 MB |
| Events in quadrant A | 2,589,260 | 1,966,857 |
| Events in quadrant B | 2,474,894 | 1,992,717 |
| Events in quadrant C | 2,541,794 | 1,896,715 |
| Events in quadrant D | 2,213,938 | 1,735,262 |
| Mode SS | |||
|---|---|---|---|
| Quadrant | BADHDUFLAG | Total packets | Discarded packets |
| A | 0 | 864 | 0 |
| B | 0 | 864 | 0 |
| C | 0 | 864 | 0 |
| D | 0 | 864 | 0 |
| Mode M9 | |||
|---|---|---|---|
| Quadrant | BADHDUFLAG | Total packets | Discarded packets |
| A | 0 | 46 | 0 |
| B | 0 | 46 | 0 |
| C | 0 | 46 | 0 |
| D | 0 | 46 | 0 |
| Mode M0 | |||
|---|---|---|---|
| Quadrant | BADHDUFLAG | Total packets | Discarded packets |
| A | 0 | 91527 | 0 |
| B | 0 | 89997 | 0 |
| C | 0 | 88893 | 0 |
| D | 0 | 105786 | 0 |
| Quadrant | Total seconds | Saturated seconds | Saturation percentage |
|---|---|---|---|
| A | 42345 | 1227 | 2.897627% |
| B | 42342 | 1010 | 2.385338% |
| C | 42342 | 1013 | 2.392424% |
| D | 42346 | 1924 | 4.543522% |
Noise dominated data is calculated using 1-second bins in cleaned event files. If a bin has >2000 counts, and if more than 50% of those come from <1% of pixels, then it is considered to be noise-dominated and hence unusable.
| Quadrant | # 1 sec bins | Bins with >0 counts | Bins with >2000 counts | High rate bins dominated by noise | Noise dominated (total time) | Noise dominated (detector-on time) | Marked lightcurve |
|---|---|---|---|---|---|---|---|
| A | 46510 | 42357 | 0 | 0 | 0.00% | 0.00% |  |
| B | 46510 | 42348 | 0 | 0 | 0.00% | 0.00% |  |
| C | 46510 | 42351 | 0 | 0 | 0.00% | 0.00% | 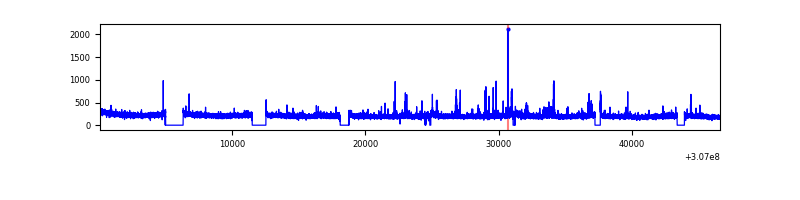 |
| D | 46510 | 42345 | 0 | 0 | 0.00% | 0.00% |  |
Top three noisy pixels from each quadrant. If the there are fewer than three noisy pixels in the level2.evt file, extra rows are filled as -1
| Pixel properties | Quadrant properties | ||||||
|---|---|---|---|---|---|---|---|
| Quadrant | DetID | PixID | Counts | Sigma | Mean | Median | Sigma |
| A | 0 | 29 | 2418 | 10.86 | 673 | 631 | 164.6 |
| A | 7 | 110 | 2046 | 8.6 | 673 | 631 | 164.6 |
| A | 9 | 19 | 1988 | 8.25 | 673 | 631 | 164.6 |
| B | 2 | 9 | 1987 | 10.43 | 654 | 625 | 130.6 |
| B | 3 | 17 | 1650 | 7.85 | 654 | 625 | 130.6 |
| B | 2 | 8 | 1641 | 7.78 | 654 | 625 | 130.6 |
| C | 3 | 126 | 1712 | 6.29 | 671 | 627 | 172.5 |
| C | 2 | 191 | 1693 | 6.18 | 671 | 627 | 172.5 |
| C | 9 | 209 | 1691 | 6.17 | 671 | 627 | 172.5 |
| D | 6 | 231 | 1581 | 5.95 | 634 | 579 | 168.3 |
| D | 3 | 14 | 1538 | 5.7 | 634 | 579 | 168.3 |
| D | 10 | 189 | 1535 | 5.68 | 634 | 579 | 168.3 |
Histogram calculated using DETX and DETY for each event in the final _common_clean file
| Quadrant A | 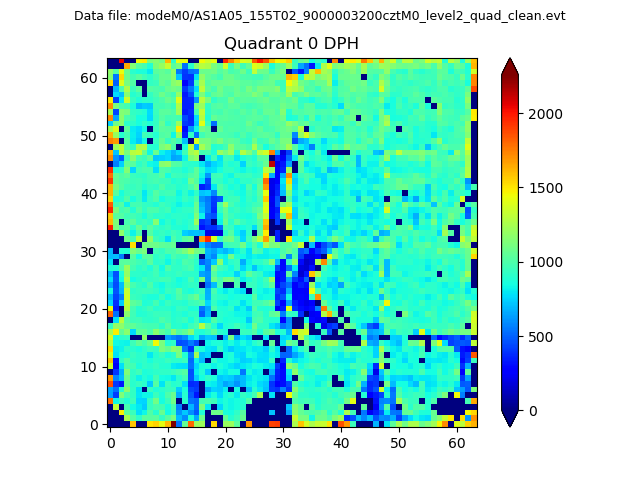 |
 |
Quadrant B |
|---|---|---|---|
| Quadrant D | 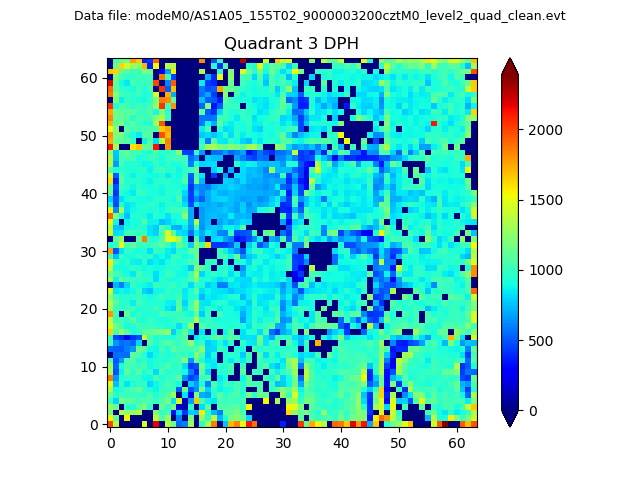 |
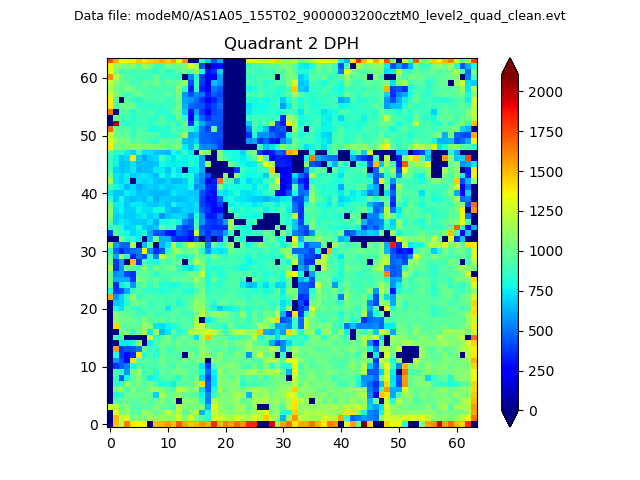 |
Quadrant C |
| Plot type | Count rate plots | Images |
|---|---|---|
| Comparison with Poisson distribution Blue bars denote a histogram of data divided into 1 sec bins. Red curve is a Poisson curve with rate = median count rate of data. |
 |
 |
| Quadrant-wise count rates Data is divided into 100 sec bins |
 |
|
| Module-wise count rates for Quadrant A Data is divided into 100 sec bins |
 |
 |
| Module-wise count rates for Quadrant B Data is divided into 100 sec bins |
 |
 |
| Module-wise count rates for Quadrant C Data is divided into 100 sec bins |
 |
 |
| Module-wise count rates for Quadrant D Data is divided into 100 sec bins |
 |
 |
| Parameter | Plot |
|---|---|
| CZT HV Monitor |  |
| D_VDD |  |
| Temperature 1 |  |
| Veto HV Monitor |  |
| Veto LLD |  |
| Alpha Counter |  |
| _CPM_Rate |  |
| CZT Counter |  |
| +2.5 Volts monitor |  |
| +5 Volts monitor |  |
| _ROLL_ROT |  |
| _Roll_DEC |  |
| _Roll_RA |  |
| Veto Counter |  |