| Param | Original file | Final file |
|---|---|---|
| Filename | modeM0/AS1A05_155T02_9000003200_21567cztM0_level2.evt | modeM0/AS1A05_155T02_9000003200_21567cztM0_level2_quad_clean.evt |
| Size (bytes) | 102,545,280 | 33,128,640 |
| Size | 97.8 MB | 31.6 MB |
| Events in quadrant A | 726,355 | 228,718 |
| Events in quadrant B | 735,492 | 233,597 |
| Events in quadrant C | 758,075 | 223,978 |
| Events in quadrant D | 793,915 | 218,564 |
| Mode SS | |||
|---|---|---|---|
| Quadrant | BADHDUFLAG | Total packets | Discarded packets |
| A | 0 | 26 | 0 |
| B | 0 | 26 | 0 |
| C | 0 | 26 | 0 |
| D | 0 | 26 | 0 |
| Mode M9 | |||
|---|---|---|---|
| Quadrant | BADHDUFLAG | Total packets | Discarded packets |
| A | 0 | 5 | 0 |
| B | 0 | 5 | 0 |
| C | 0 | 5 | 0 |
| D | 0 | 5 | 0 |
| Mode M0 | |||
|---|---|---|---|
| Quadrant | BADHDUFLAG | Total packets | Discarded packets |
| A | 0 | 2901 | 1 |
| B | 0 | 2949 | 1 |
| C | 0 | 3068 | 1 |
| D | 0 | 3152 | 1 |
| Quadrant | Total seconds | Saturated seconds | Saturation percentage |
|---|---|---|---|
| A | 1309 | 2 | 0.152788% |
| B | 1309 | 3 | 0.229183% |
| C | 1309 | 5 | 0.381971% |
| D | 1309 | 9 | 0.687548% |
Noise dominated data is calculated using 1-second bins in cleaned event files. If a bin has >2000 counts, and if more than 50% of those come from <1% of pixels, then it is considered to be noise-dominated and hence unusable.
| Quadrant | # 1 sec bins | Bins with >0 counts | Bins with >2000 counts | High rate bins dominated by noise | Noise dominated (total time) | Noise dominated (detector-on time) | Marked lightcurve |
|---|---|---|---|---|---|---|---|
| A | 1309 | 1309 | 0 | 0 | 0.00% | 0.00% | 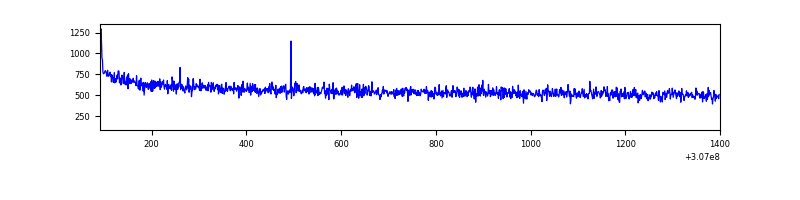 |
| B | 1309 | 1309 | 0 | 0 | 0.00% | 0.00% | 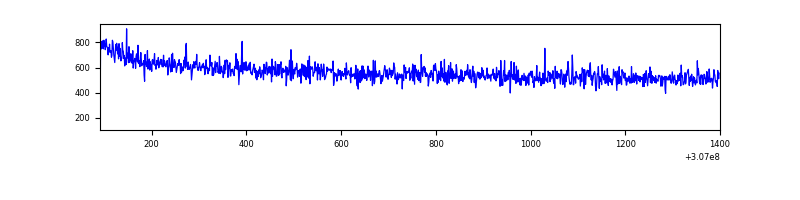 |
| C | 1309 | 1309 | 0 | 0 | 0.00% | 0.00% | 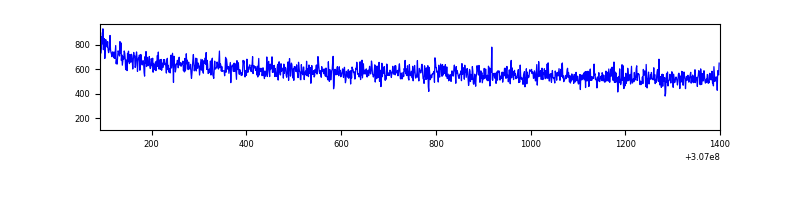 |
| D | 1309 | 1309 | 2 | 2 | 0.15% | 0.15% | 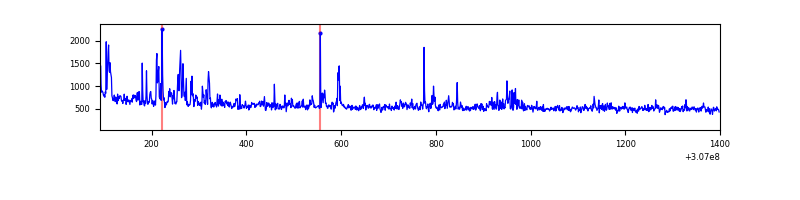 |
Top three noisy pixels from each quadrant. If the there are fewer than three noisy pixels in the level2.evt file, extra rows are filled as -1
| Pixel properties | Quadrant properties | ||||||
|---|---|---|---|---|---|---|---|
| Quadrant | DetID | PixID | Counts | Sigma | Mean | Median | Sigma |
| A | 15 | 48 | 1744 | 40.13 | 188 | 185 | 38.9 |
| A | 13 | 254 | 1726 | 39.66 | 188 | 185 | 38.9 |
| A | 0 | 226 | 1693 | 38.81 | 188 | 185 | 38.9 |
| B | 12 | 111 | 3781 | 100.65 | 188 | 184 | 35.7 |
| B | 11 | 111 | 3333 | 88.11 | 188 | 184 | 35.7 |
| B | 14 | 111 | 2945 | 77.26 | 188 | 184 | 35.7 |
| C | 14 | 238 | 29562 | 655.26 | 186 | 187 | 44.8 |
| C | 13 | 61 | 1301 | 24.85 | 186 | 187 | 44.8 |
| C | 0 | 10 | 1044 | 19.12 | 186 | 187 | 44.8 |
| D | 12 | 235 | 77589 | 1723.55 | 186 | 181 | 44.9 |
| D | 1 | 52 | 5240 | 112.64 | 186 | 181 | 44.9 |
| D | 13 | 153 | 4774 | 102.27 | 186 | 181 | 44.9 |
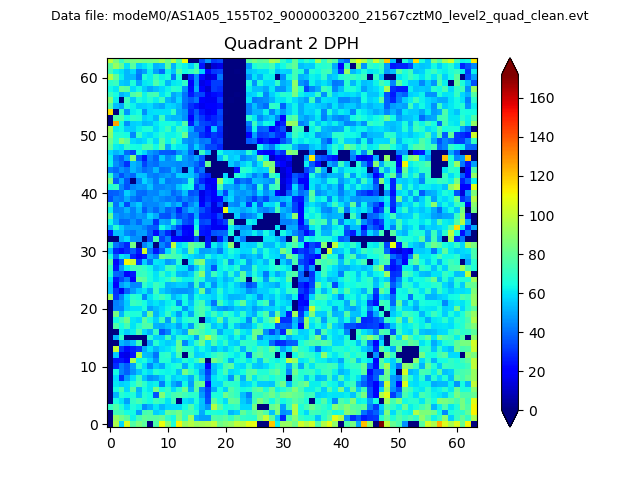
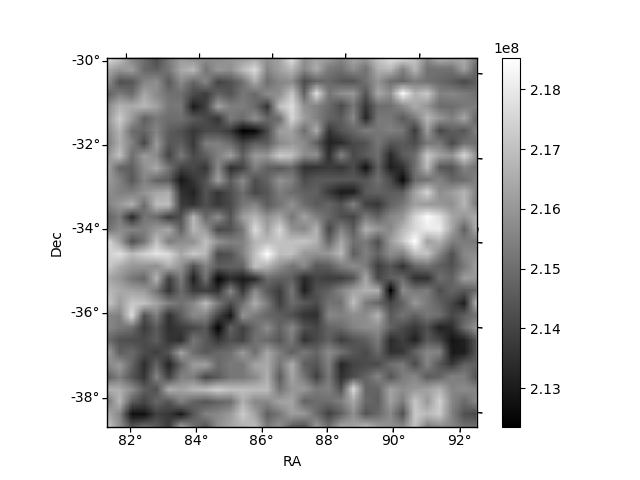
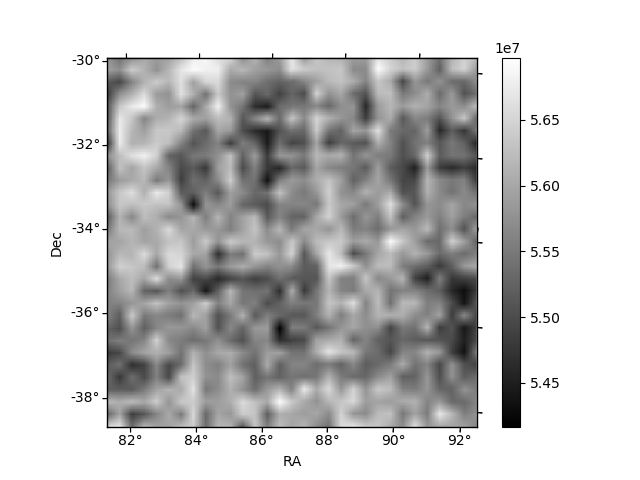
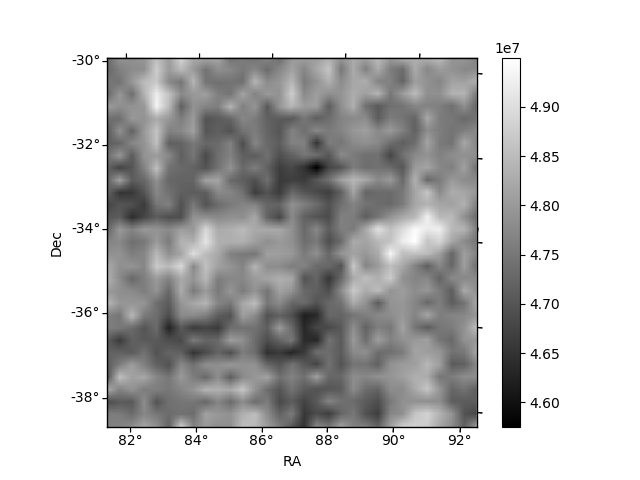
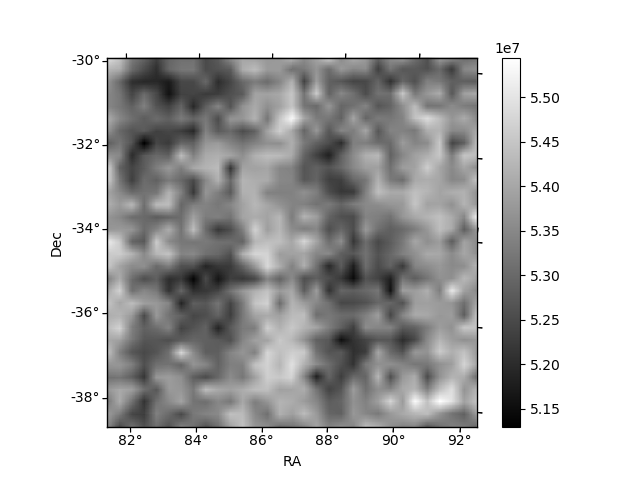
Histogram calculated using DETX and DETY for each event in the final _common_clean file
| Quadrant A | 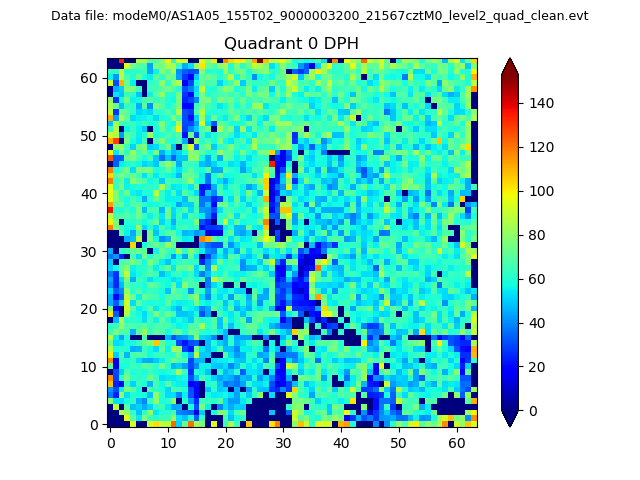 |
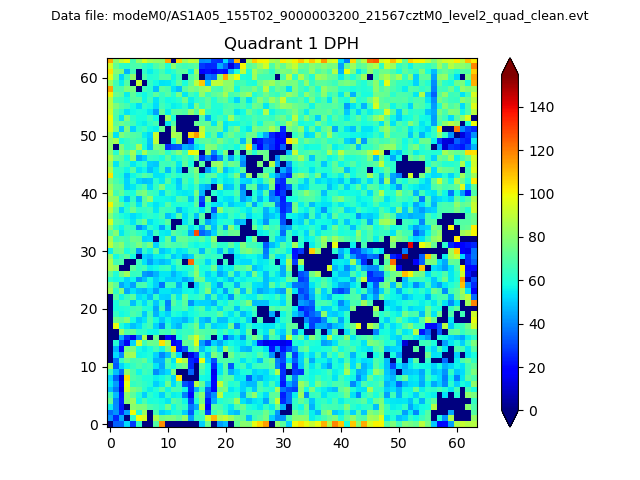 |
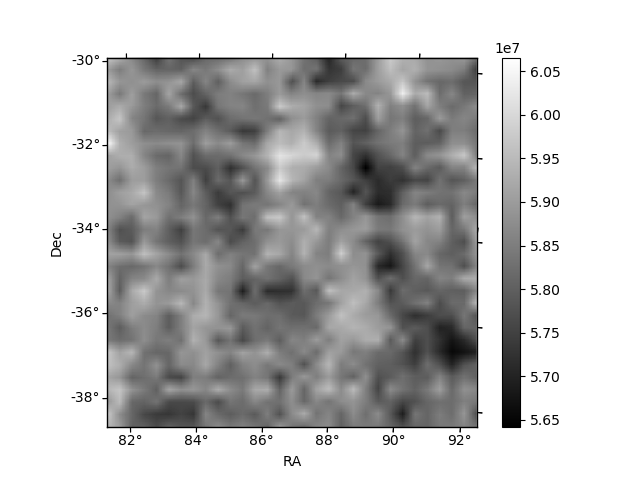
Quadrant B |
|---|---|---|---|
| Quadrant D | 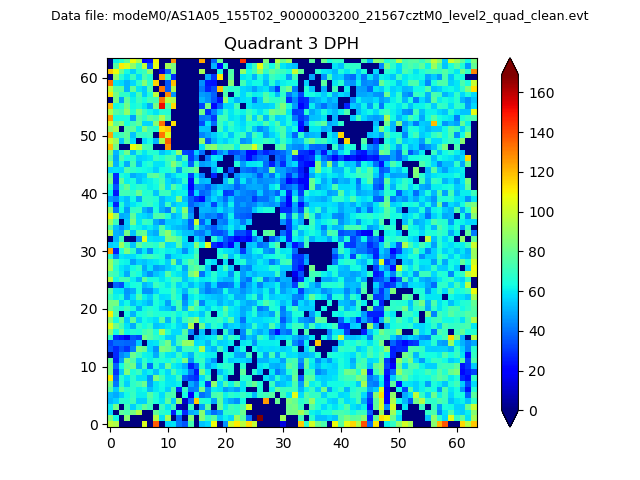 |
 |
Quadrant C |
| Plot type | Count rate plots | Images |
|---|---|---|
| Comparison with Poisson distribution Blue bars denote a histogram of data divided into 1 sec bins. Red curve is a Poisson curve with rate = median count rate of data. |
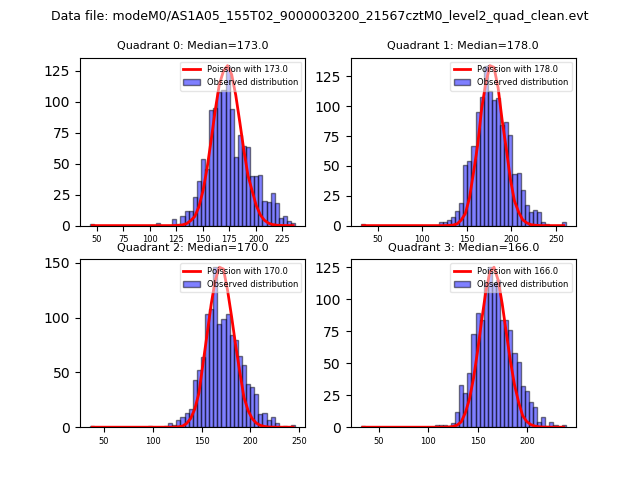 |
 |
| Quadrant-wise count rates Data is divided into 100 sec bins |
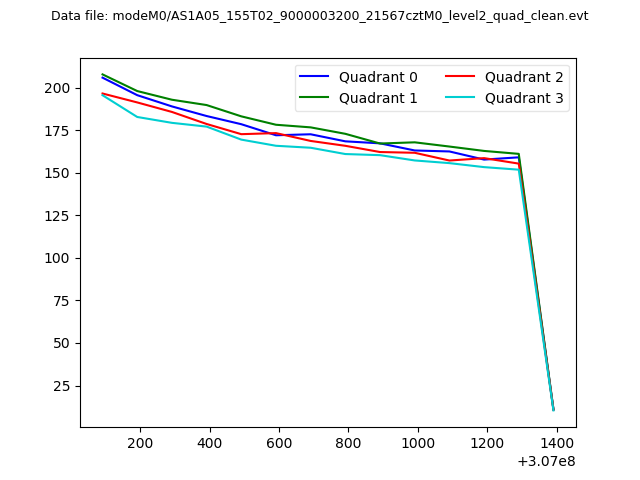 |
|
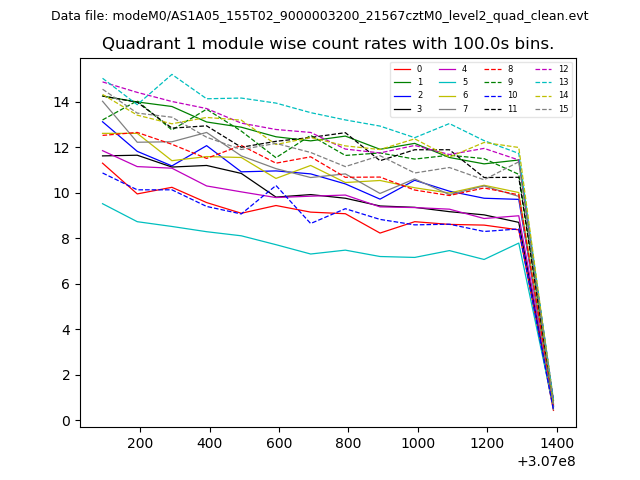
| Module-wise count rates for Quadrant A Data is divided into 100 sec bins |
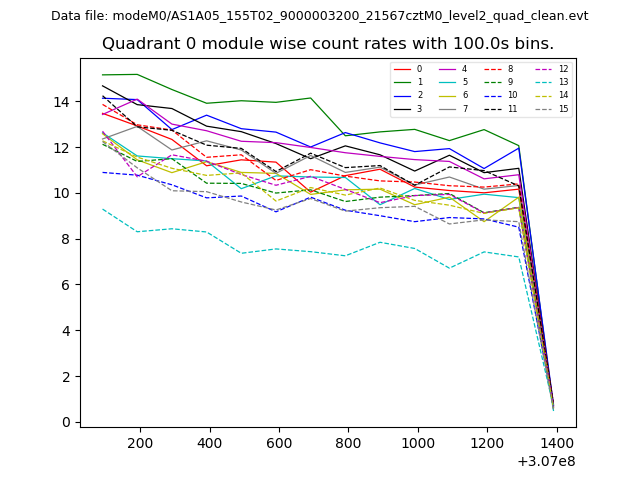 |
 |
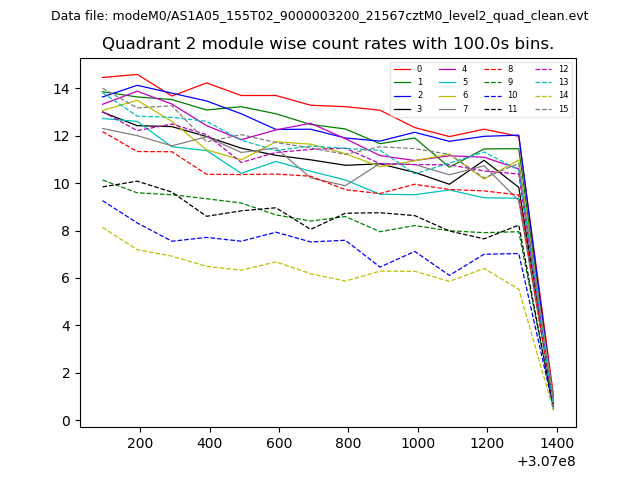
| Module-wise count rates for Quadrant B Data is divided into 100 sec bins |
 |
 |
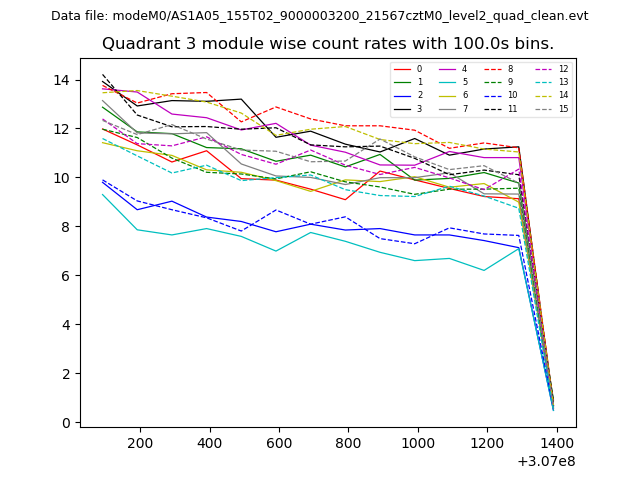
| Module-wise count rates for Quadrant C Data is divided into 100 sec bins |
 |
 |
| Module-wise count rates for Quadrant D Data is divided into 100 sec bins |
 |
 |
| Parameter | Plot |
|---|---|
| CZT HV Monitor | 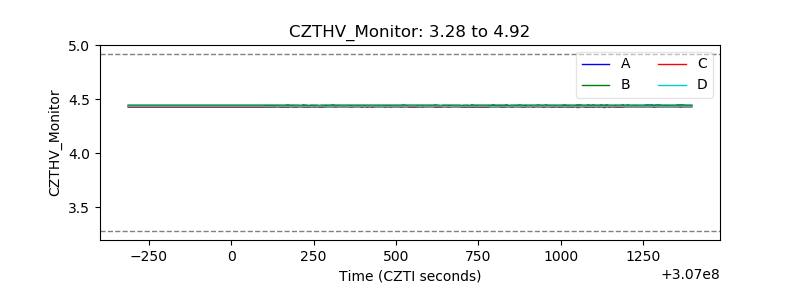 |
| D_VDD | 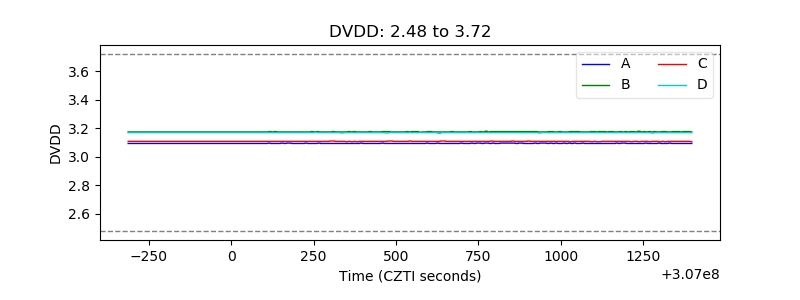 |
| Temperature 1 | 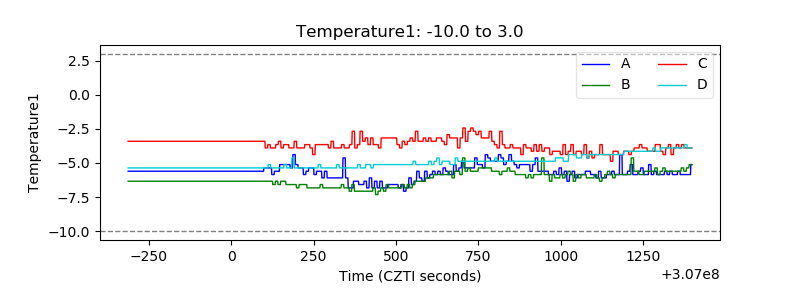 |
| Veto HV Monitor | 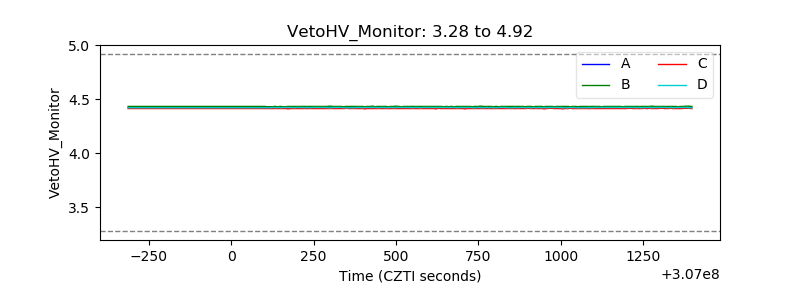 |
| Veto LLD | 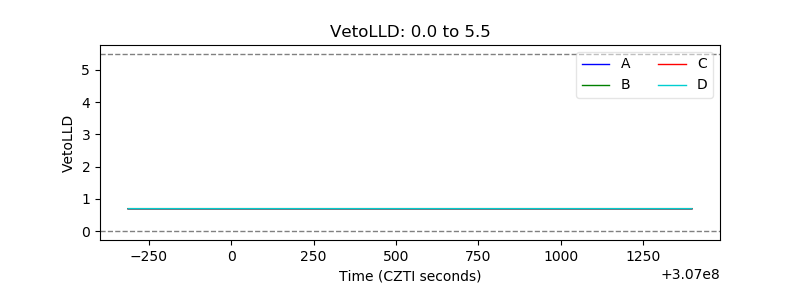 |
| Alpha Counter | 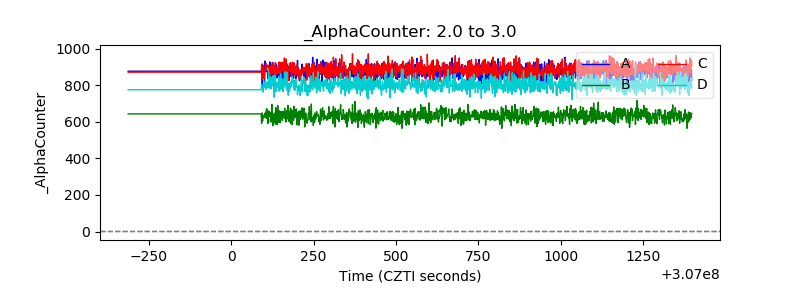 |
| _CPM_Rate | 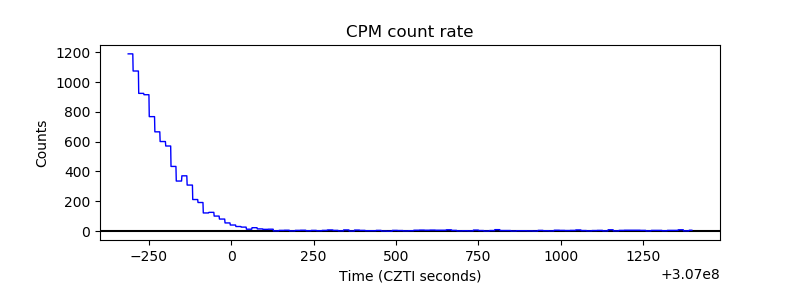 |
| CZT Counter | 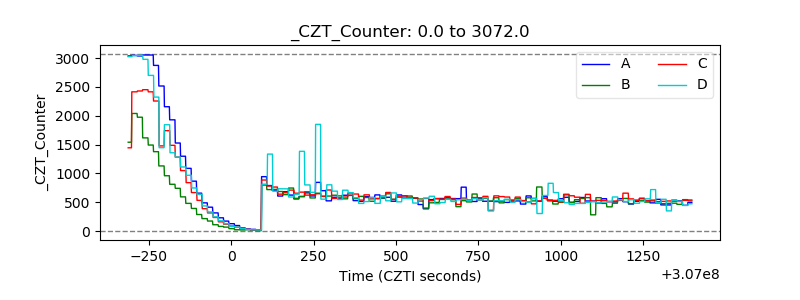 |
| +2.5 Volts monitor |  |
| +5 Volts monitor |  |
| _ROLL_ROT | 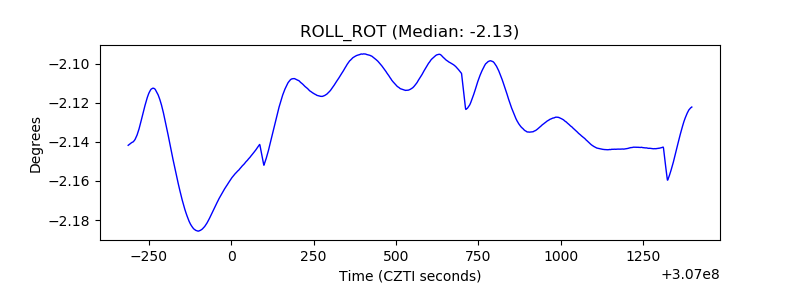 |
| _Roll_DEC | 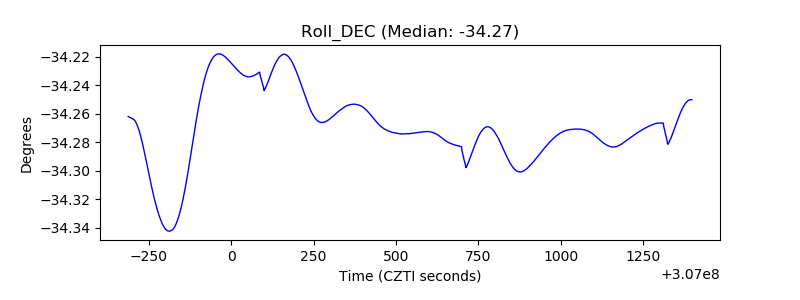 |
| _Roll_RA | 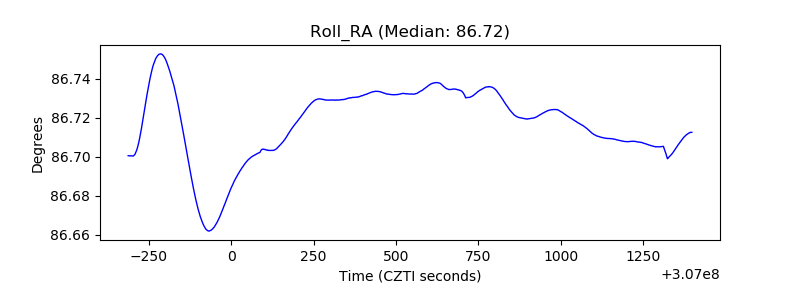 |
| Veto Counter | 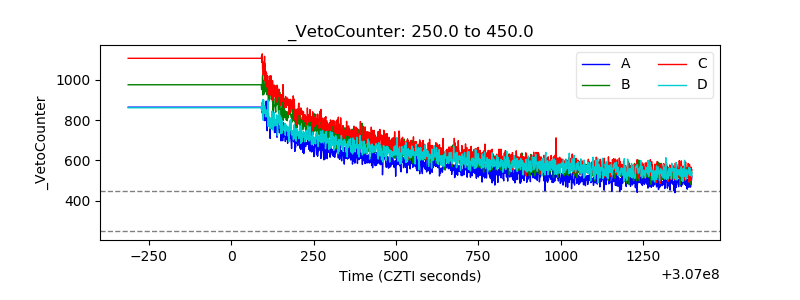 |