| Param | Original file | Final file |
|---|---|---|
| Filename | modeM0/AS1A05_155T02_9000003200_21568cztM0_level2.evt | modeM0/AS1A05_155T02_9000003200_21568cztM0_level2_quad_clean.evt |
| Size (bytes) | 479,079,360 | 101,243,520 |
| Size | 456.9 MB | 96.6 MB |
| Events in quadrant A | 3,308,914 | 664,402 |
| Events in quadrant B | 3,440,793 | 677,712 |
| Events in quadrant C | 3,379,788 | 651,825 |
| Events in quadrant D | 3,953,665 | 634,446 |
| Mode SS | |||
|---|---|---|---|
| Quadrant | BADHDUFLAG | Total packets | Discarded packets |
| A | 0 | 128 | 0 |
| B | 0 | 128 | 0 |
| C | 0 | 128 | 0 |
| D | 0 | 128 | 0 |
| Mode M9 | |||
|---|---|---|---|
| Quadrant | BADHDUFLAG | Total packets | Discarded packets |
| A | 0 | 19 | 0 |
| B | 0 | 19 | 0 |
| C | 0 | 19 | 0 |
| D | 0 | 19 | 0 |
| Mode M0 | |||
|---|---|---|---|
| Quadrant | BADHDUFLAG | Total packets | Discarded packets |
| A | 0 | 13343 | 2 |
| B | 0 | 13772 | 2 |
| C | 0 | 13578 | 2 |
| D | 0 | 15622 | 2 |
| Quadrant | Total seconds | Saturated seconds | Saturation percentage |
|---|---|---|---|
| A | 6280 | 42 | 0.668790% |
| B | 6280 | 64 | 1.019108% |
| C | 6280 | 70 | 1.114650% |
| D | 6280 | 149 | 2.372611% |
Noise dominated data is calculated using 1-second bins in cleaned event files. If a bin has >2000 counts, and if more than 50% of those come from <1% of pixels, then it is considered to be noise-dominated and hence unusable.
| Quadrant | # 1 sec bins | Bins with >0 counts | Bins with >2000 counts | High rate bins dominated by noise | Noise dominated (total time) | Noise dominated (detector-on time) | Marked lightcurve |
|---|---|---|---|---|---|---|---|
| A | 7610 | 6282 | 0 | 0 | 0.00% | 0.00% | 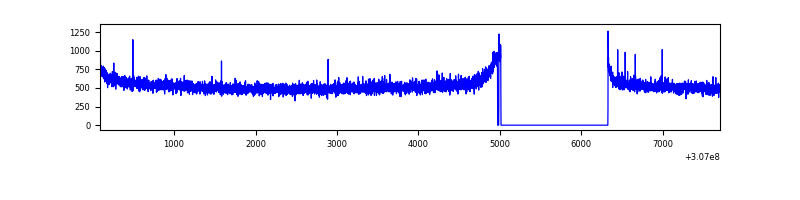 |
| B | 7610 | 6282 | 1 | 1 | 0.01% | 0.02% | 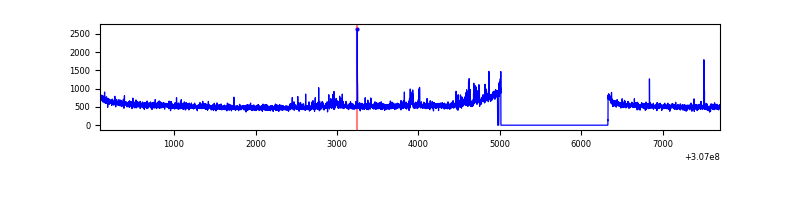 |
| C | 7610 | 6282 | 0 | 0 | 0.00% | 0.00% | 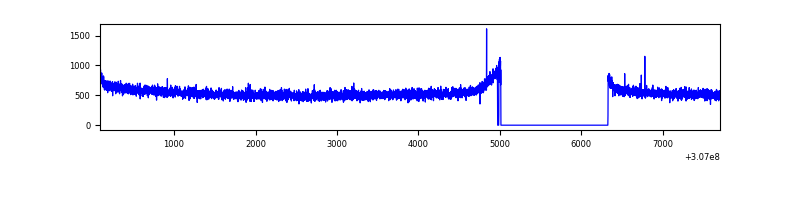 |
| D | 7610 | 6282 | 96 | 96 | 1.26% | 1.53% | 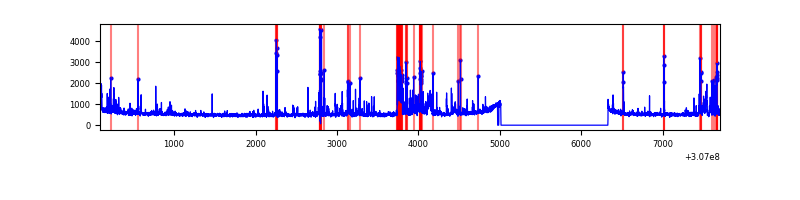 |
Top three noisy pixels from each quadrant. If the there are fewer than three noisy pixels in the level2.evt file, extra rows are filled as -1
| Pixel properties | Quadrant properties | ||||||
|---|---|---|---|---|---|---|---|
| Quadrant | DetID | PixID | Counts | Sigma | Mean | Median | Sigma |
| A | 13 | 254 | 8059 | 42.57 | 857 | 842 | 169.5 |
| A | 0 | 226 | 7744 | 40.72 | 857 | 842 | 169.5 |
| A | 12 | 96 | 6455 | 33.11 | 857 | 842 | 169.5 |
| B | 0 | 230 | 46747 | 291.5 | 849 | 831 | 157.5 |
| B | 0 | 228 | 33095 | 204.83 | 849 | 831 | 157.5 |
| B | 0 | 190 | 24273 | 148.82 | 849 | 831 | 157.5 |
| C | 14 | 238 | 131589 | 680.98 | 831 | 840 | 192.0 |
| C | 13 | 61 | 5862 | 26.16 | 831 | 840 | 192.0 |
| C | 3 | 233 | 4701 | 20.11 | 831 | 840 | 192.0 |
| D | 1 | 52 | 473035 | 2366.53 | 839 | 818 | 199.5 |
| D | 12 | 235 | 99644 | 495.27 | 839 | 818 | 199.5 |
| D | 13 | 153 | 74746 | 370.49 | 839 | 818 | 199.5 |
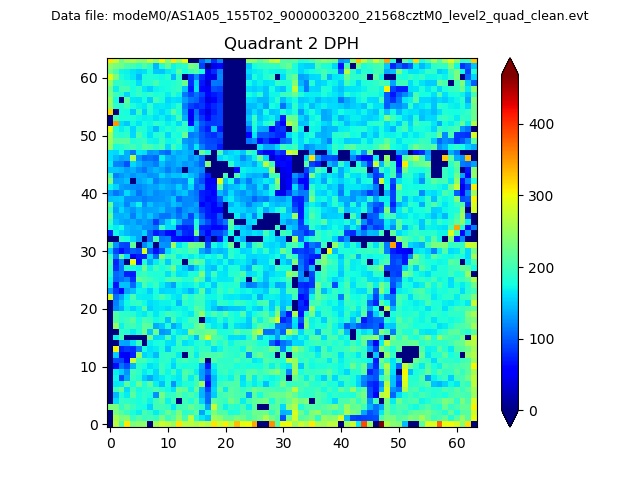
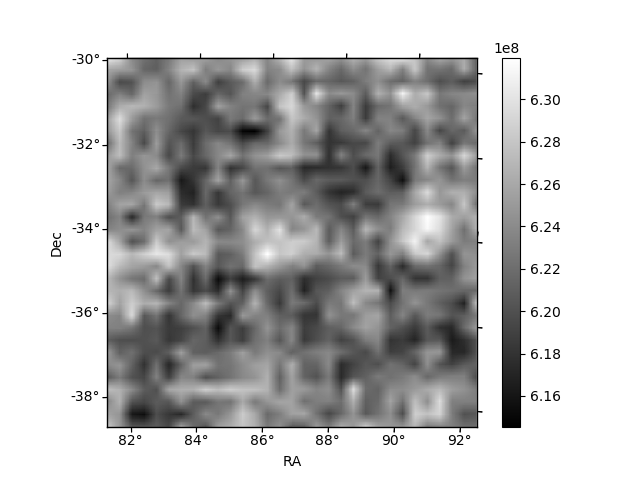
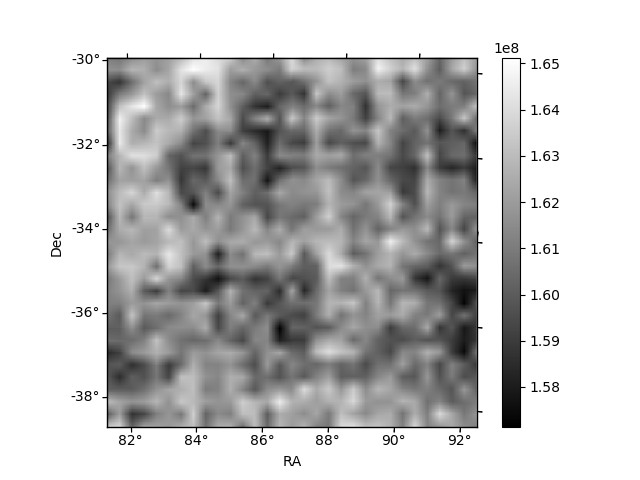
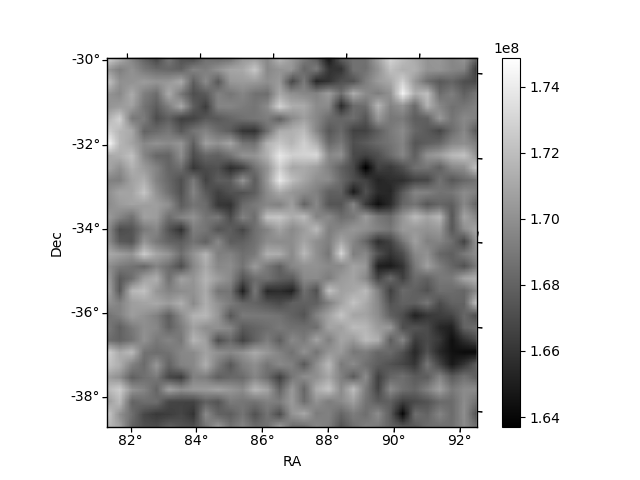
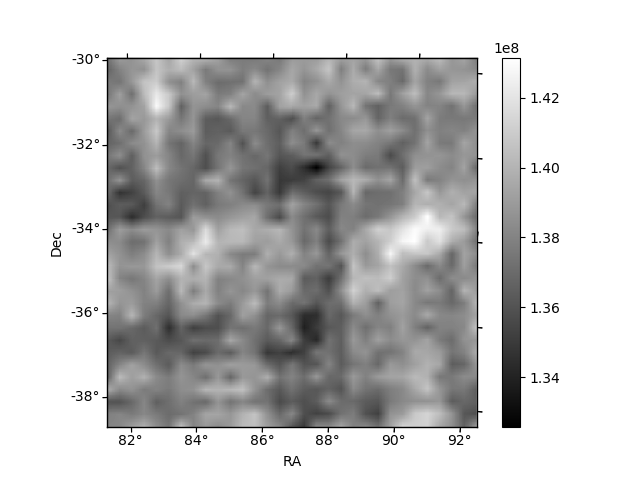
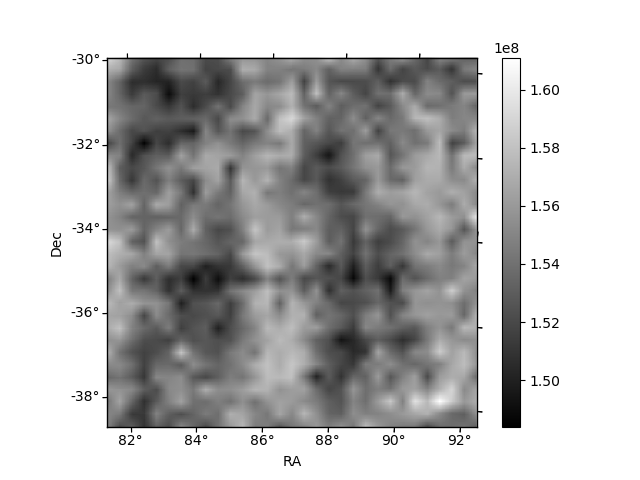
Histogram calculated using DETX and DETY for each event in the final _common_clean file
| Quadrant A | 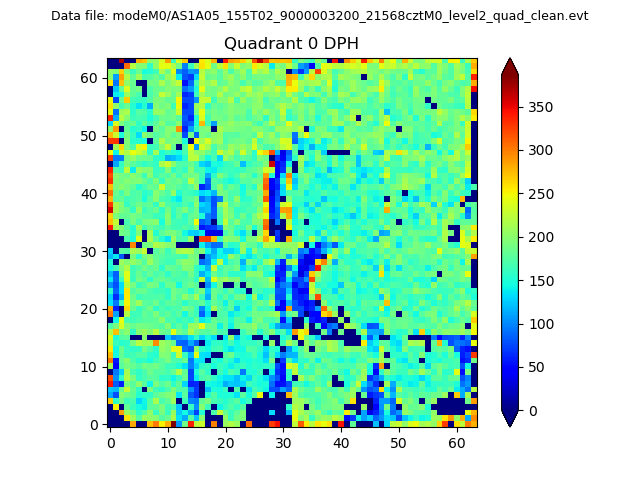 |
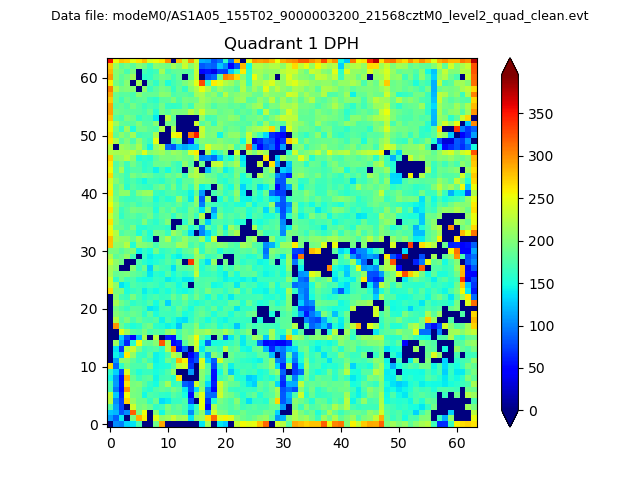 |
Quadrant B |
|---|---|---|---|
| Quadrant D | 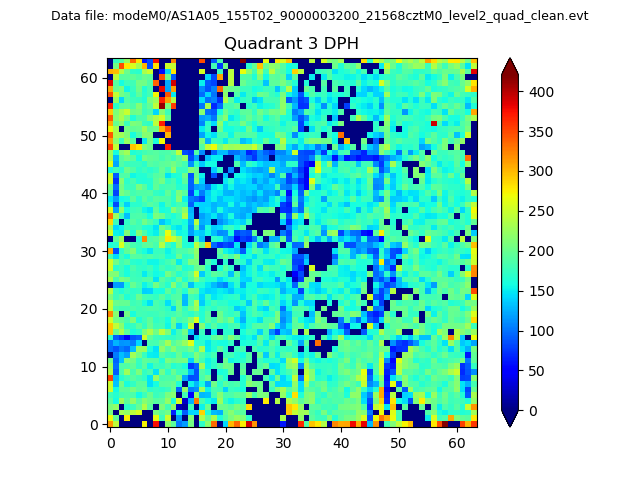 |
 |
Quadrant C |
| Plot type | Count rate plots | Images |
|---|---|---|
| Comparison with Poisson distribution Blue bars denote a histogram of data divided into 1 sec bins. Red curve is a Poisson curve with rate = median count rate of data. |
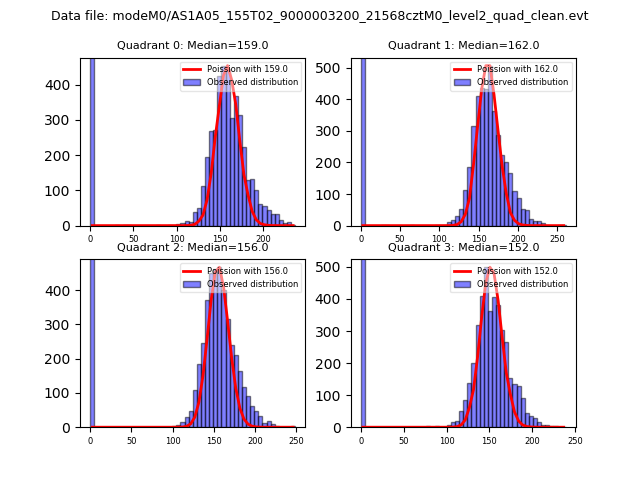 |
 |
| Quadrant-wise count rates Data is divided into 100 sec bins |
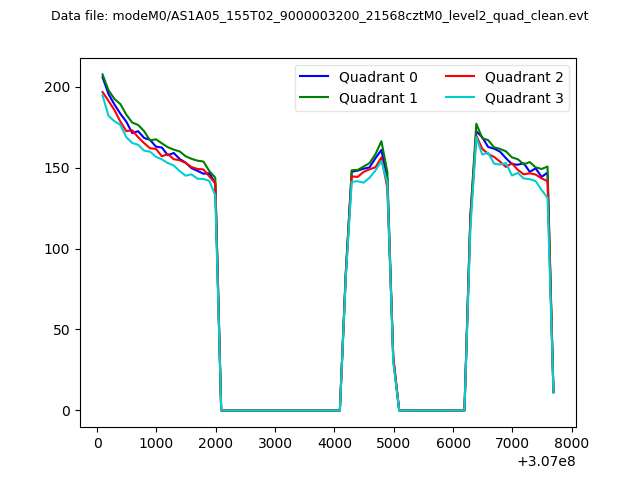 |
|
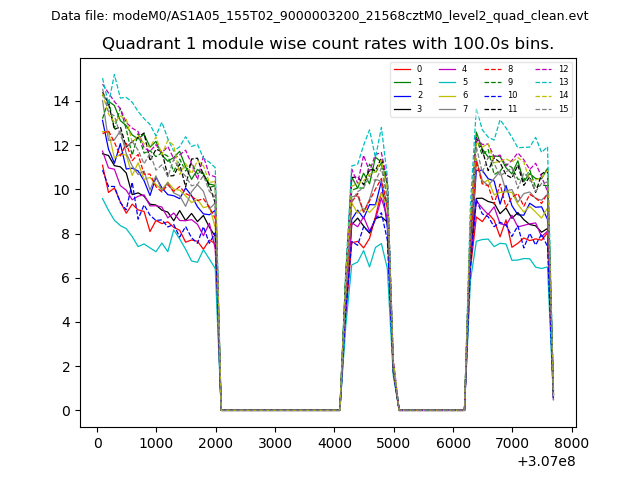
| Module-wise count rates for Quadrant A Data is divided into 100 sec bins |
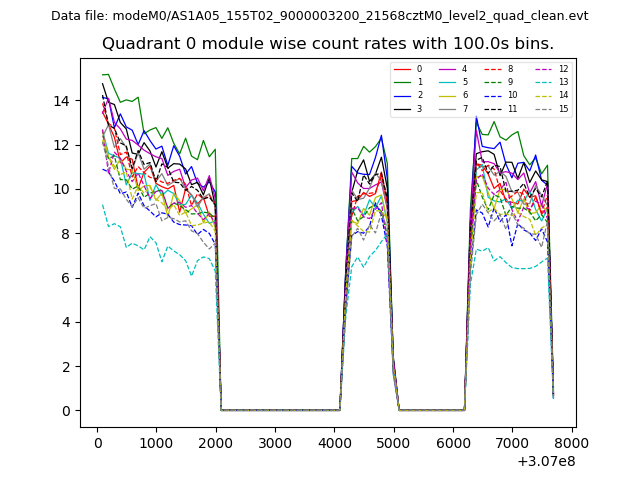 |
 |
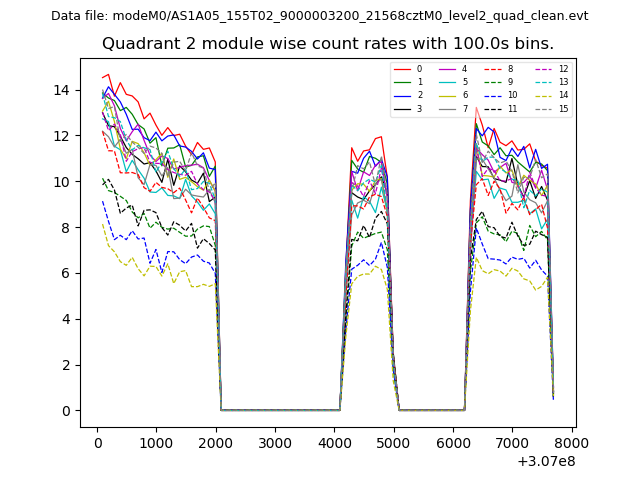
| Module-wise count rates for Quadrant B Data is divided into 100 sec bins |
 |
 |
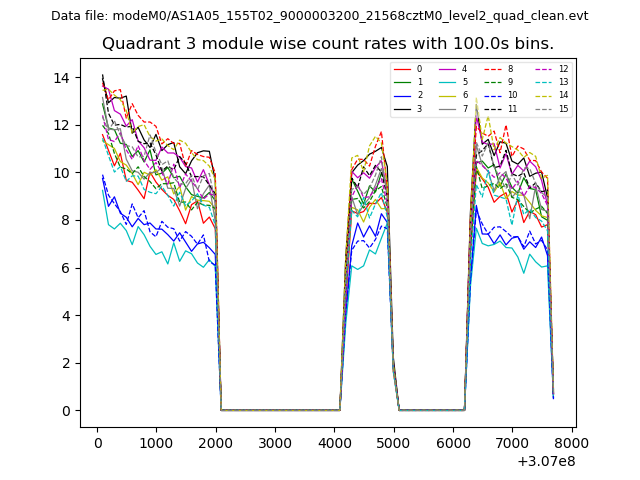
| Module-wise count rates for Quadrant C Data is divided into 100 sec bins |
 |
 |
| Module-wise count rates for Quadrant D Data is divided into 100 sec bins |
 |
 |
| Parameter | Plot |
|---|---|
| CZT HV Monitor | 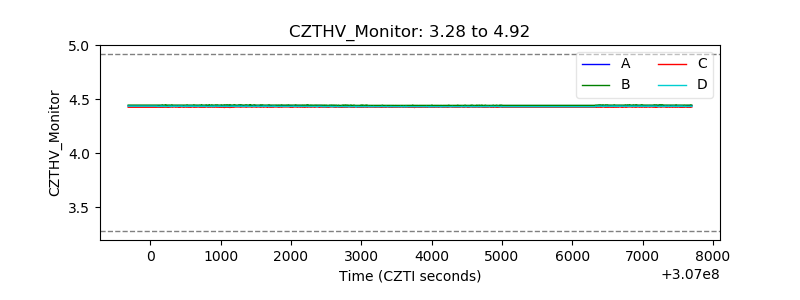 |
| D_VDD | 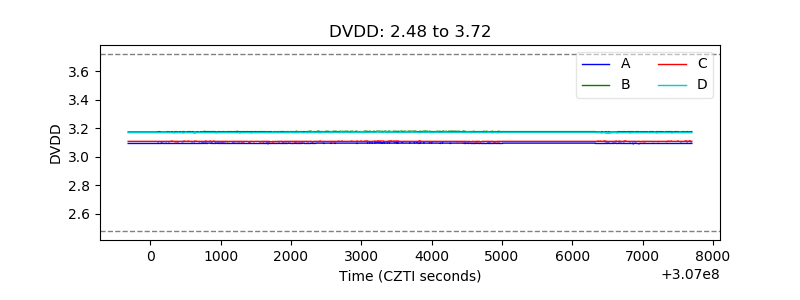 |
| Temperature 1 | 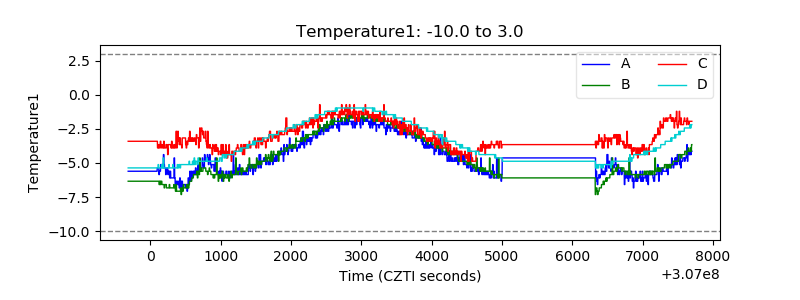 |
| Veto HV Monitor | 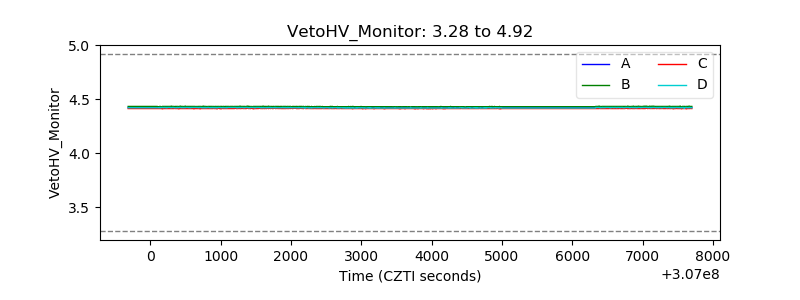 |
| Veto LLD | 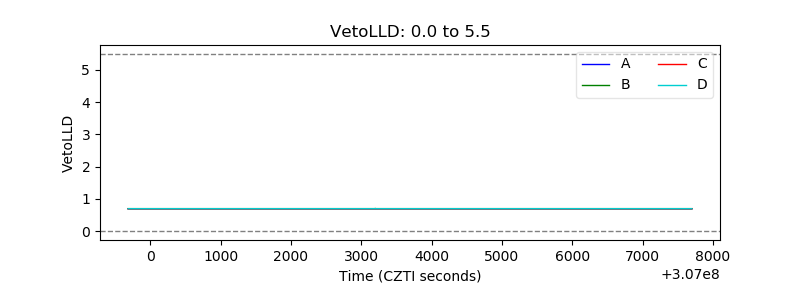 |
| Alpha Counter | 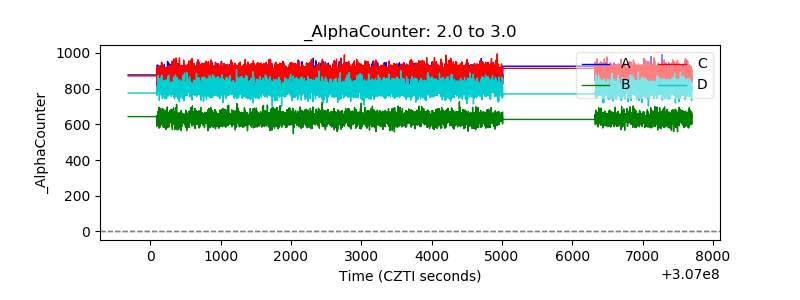 |
| _CPM_Rate | 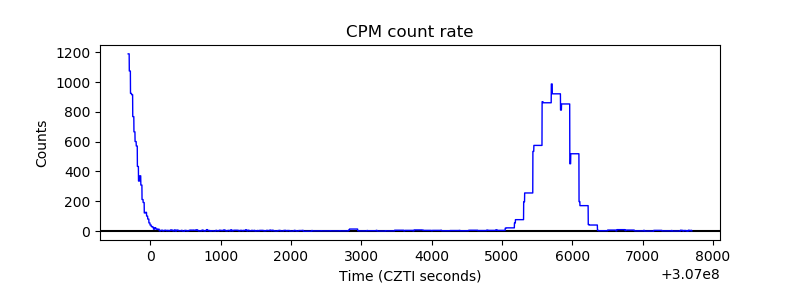 |
| CZT Counter | 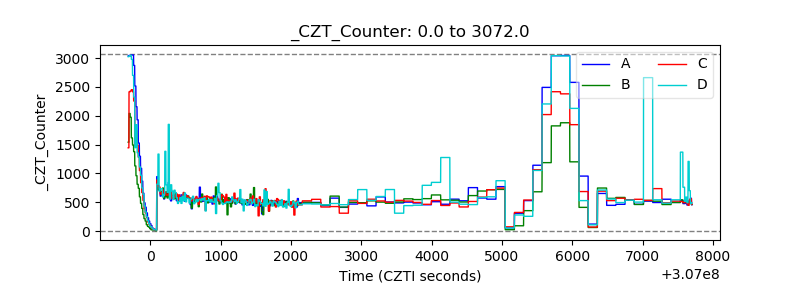 |
| +2.5 Volts monitor |  |
| +5 Volts monitor |  |
| _ROLL_ROT | 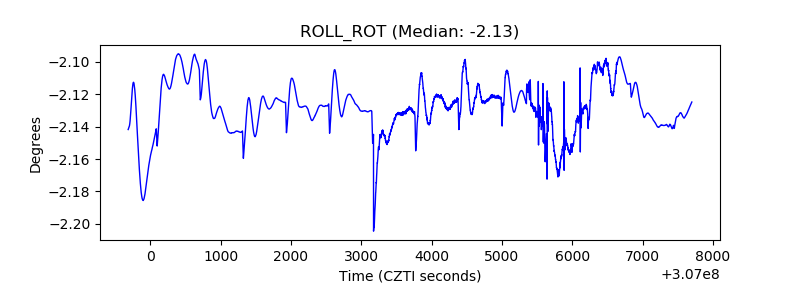 |
| _Roll_DEC | 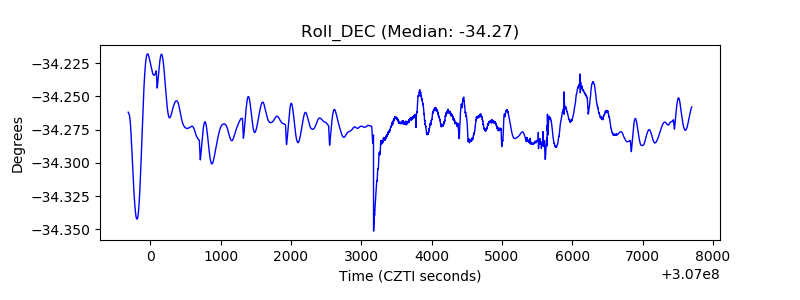 |
| _Roll_RA | 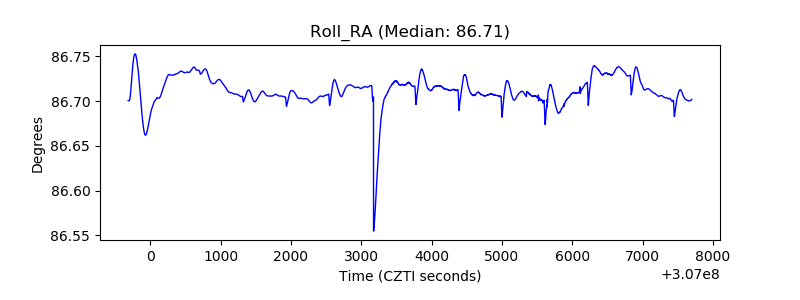 |
| Veto Counter | 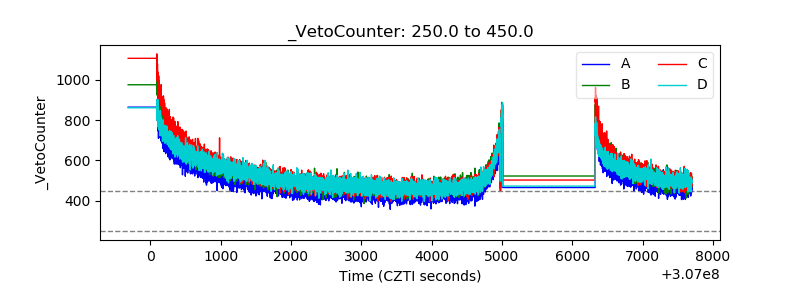 |