| Param | Original file | Final file |
|---|---|---|
| Filename | modeM0/AS1A05_155T02_9000003200_21569cztM0_level2.evt | modeM0/AS1A05_155T02_9000003200_21569cztM0_level2_quad_clean.evt |
| Size (bytes) | 451,477,440 | 92,053,440 |
| Size | 430.6 MB | 87.8 MB |
| Events in quadrant A | 3,174,814 | 594,225 |
| Events in quadrant B | 3,284,830 | 605,034 |
| Events in quadrant C | 3,217,790 | 580,815 |
| Events in quadrant D | 3,569,408 | 570,006 |
| Mode SS | |||
|---|---|---|---|
| Quadrant | BADHDUFLAG | Total packets | Discarded packets |
| A | 0 | 128 | 0 |
| B | 0 | 128 | 0 |
| C | 0 | 128 | 0 |
| D | 0 | 128 | 0 |
| Mode M9 | |||
|---|---|---|---|
| Quadrant | BADHDUFLAG | Total packets | Discarded packets |
| A | 0 | 10 | 0 |
| B | 0 | 10 | 0 |
| C | 0 | 10 | 0 |
| D | 0 | 10 | 0 |
| Mode M0 | |||
|---|---|---|---|
| Quadrant | BADHDUFLAG | Total packets | Discarded packets |
| A | 0 | 12979 | 1 |
| B | 0 | 13401 | 1 |
| C | 0 | 13072 | 1 |
| D | 0 | 14385 | 1 |
| Quadrant | Total seconds | Saturated seconds | Saturation percentage |
|---|---|---|---|
| A | 6268 | 100 | 1.595405% |
| B | 6269 | 103 | 1.643005% |
| C | 6269 | 129 | 2.057744% |
| D | 6269 | 134 | 2.137502% |
Noise dominated data is calculated using 1-second bins in cleaned event files. If a bin has >2000 counts, and if more than 50% of those come from <1% of pixels, then it is considered to be noise-dominated and hence unusable.
| Quadrant | # 1 sec bins | Bins with >0 counts | Bins with >2000 counts | High rate bins dominated by noise | Noise dominated (total time) | Noise dominated (detector-on time) | Marked lightcurve |
|---|---|---|---|---|---|---|---|
| A | 7293 | 6269 | 0 | 0 | 0.00% | 0.00% | 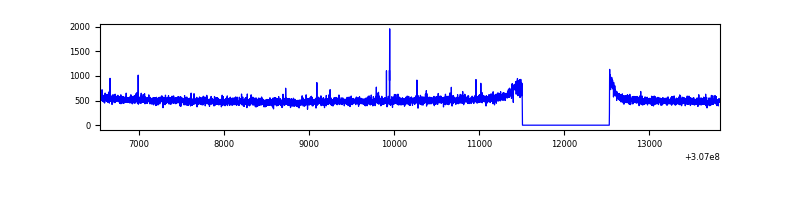 |
| B | 7294 | 6270 | 1 | 1 | 0.01% | 0.02% | 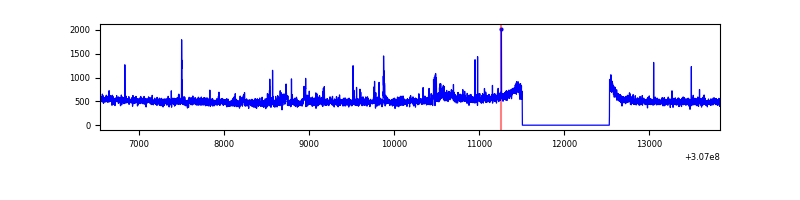 |
| C | 7294 | 6270 | 0 | 0 | 0.00% | 0.00% |  |
| D | 7294 | 6270 | 25 | 25 | 0.34% | 0.40% | 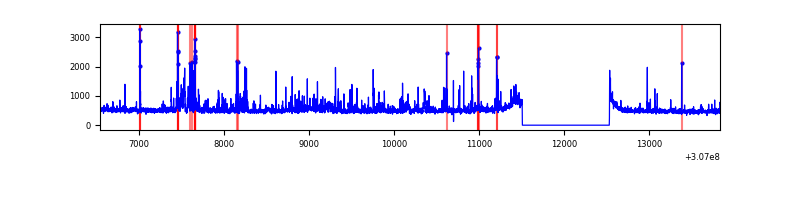 |
Top three noisy pixels from each quadrant. If the there are fewer than three noisy pixels in the level2.evt file, extra rows are filled as -1
| Pixel properties | Quadrant properties | ||||||
|---|---|---|---|---|---|---|---|
| Quadrant | DetID | PixID | Counts | Sigma | Mean | Median | Sigma |
| A | 12 | 96 | 18101 | 104.95 | 819 | 801 | 164.8 |
| A | 13 | 254 | 8267 | 45.29 | 819 | 801 | 164.8 |
| A | 0 | 226 | 7195 | 38.79 | 819 | 801 | 164.8 |
| B | 0 | 228 | 38222 | 245.4 | 811 | 791 | 152.5 |
| B | 0 | 190 | 32383 | 207.12 | 811 | 791 | 152.5 |
| B | 0 | 230 | 22817 | 144.4 | 811 | 791 | 152.5 |
| C | 14 | 238 | 124729 | 668.2 | 792 | 797 | 185.5 |
| C | 13 | 61 | 5608 | 25.94 | 792 | 797 | 185.5 |
| C | 3 | 233 | 4222 | 18.47 | 792 | 797 | 185.5 |
| D | 1 | 52 | 295497 | 1507.47 | 807 | 786 | 195.5 |
| D | 2 | 136 | 52978 | 266.97 | 807 | 786 | 195.5 |
| D | 13 | 153 | 51191 | 257.83 | 807 | 786 | 195.5 |
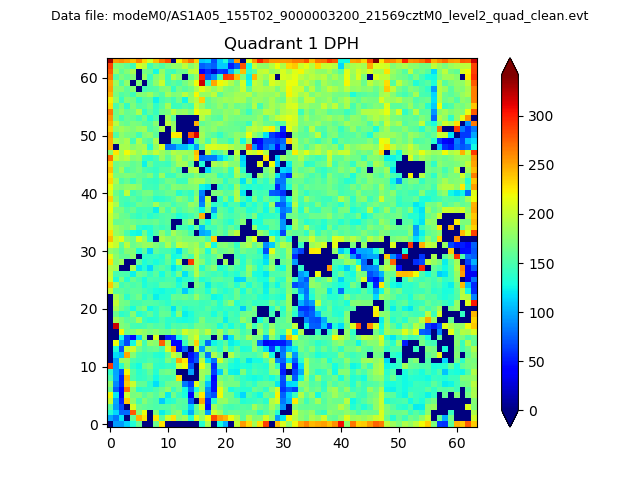
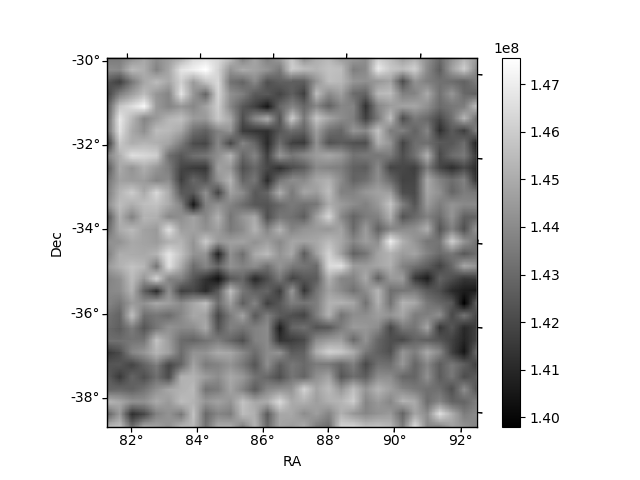
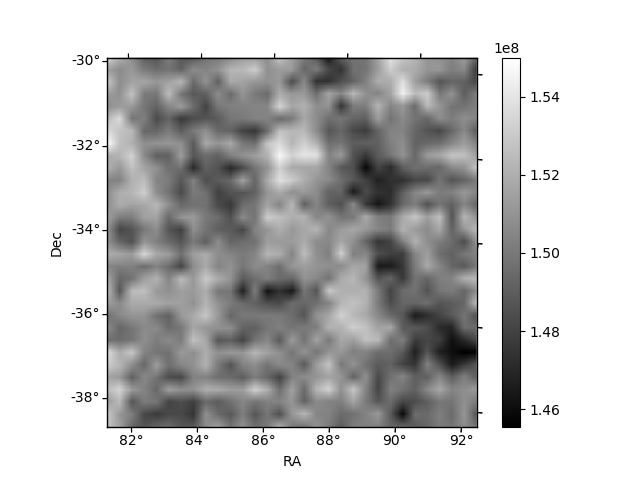
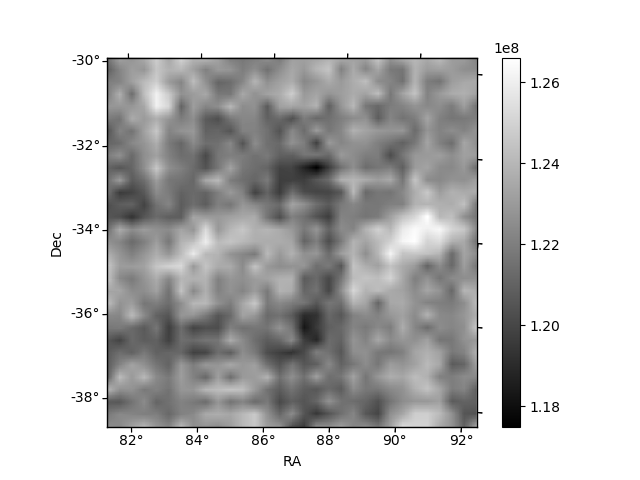
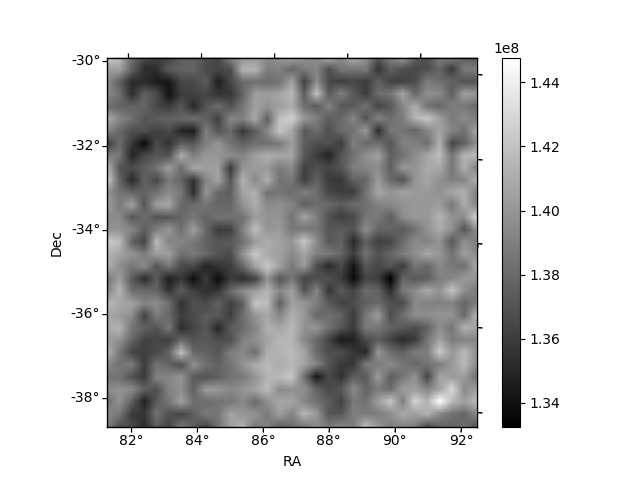
Histogram calculated using DETX and DETY for each event in the final _common_clean file
| Quadrant A |  |
 |
Quadrant B |
|---|---|---|---|
| Quadrant D | 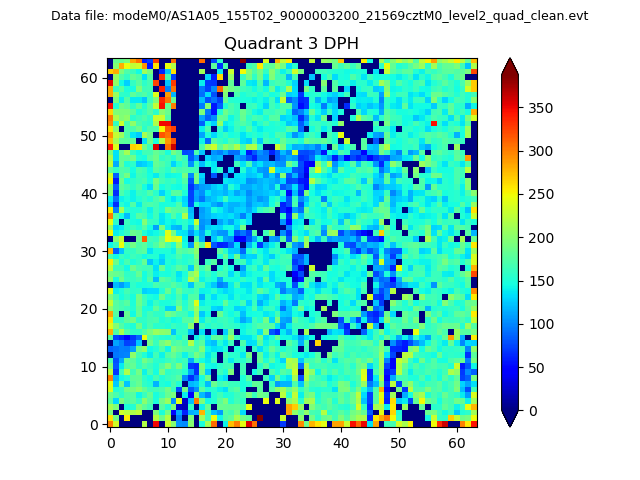 |
 |
Quadrant C |
| Plot type | Count rate plots | Images |
|---|---|---|
| Comparison with Poisson distribution Blue bars denote a histogram of data divided into 1 sec bins. Red curve is a Poisson curve with rate = median count rate of data. |
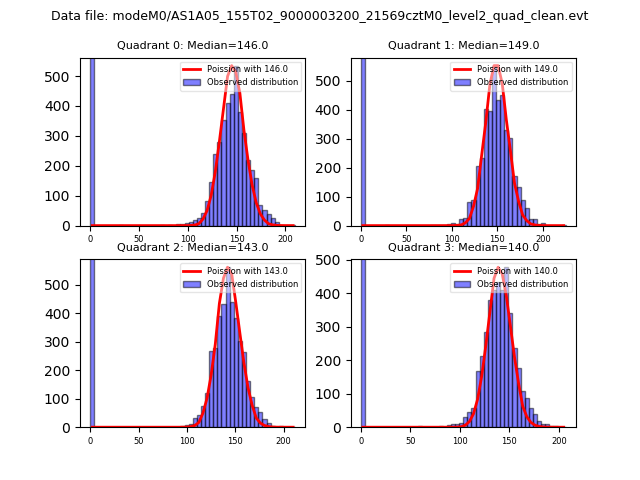 |
 |
| Quadrant-wise count rates Data is divided into 100 sec bins |
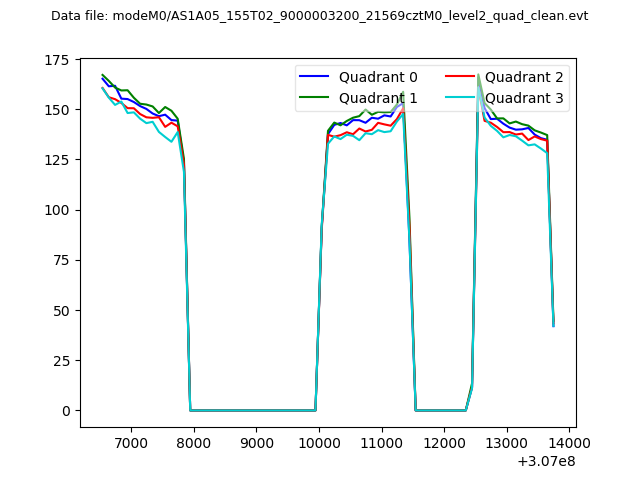 |
|
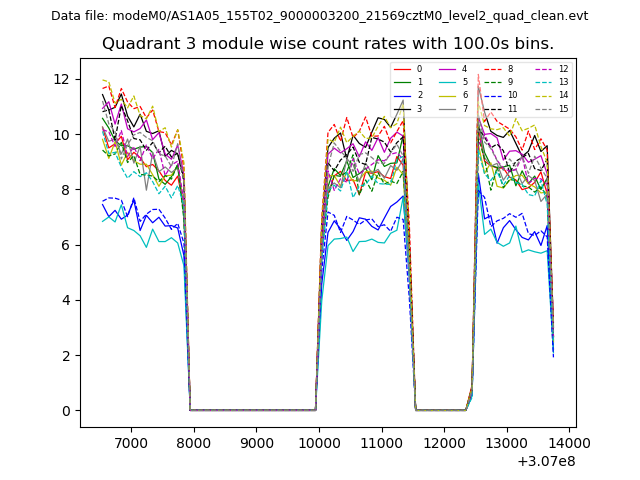
| Module-wise count rates for Quadrant A Data is divided into 100 sec bins |
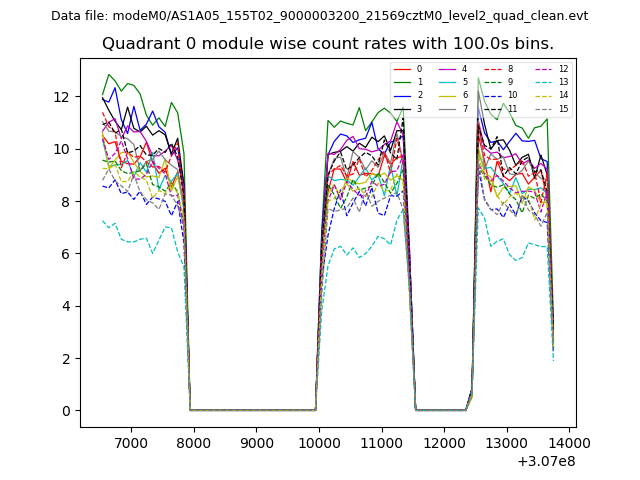 |
 |
| Module-wise count rates for Quadrant B Data is divided into 100 sec bins |
 |
 |
| Module-wise count rates for Quadrant C Data is divided into 100 sec bins |
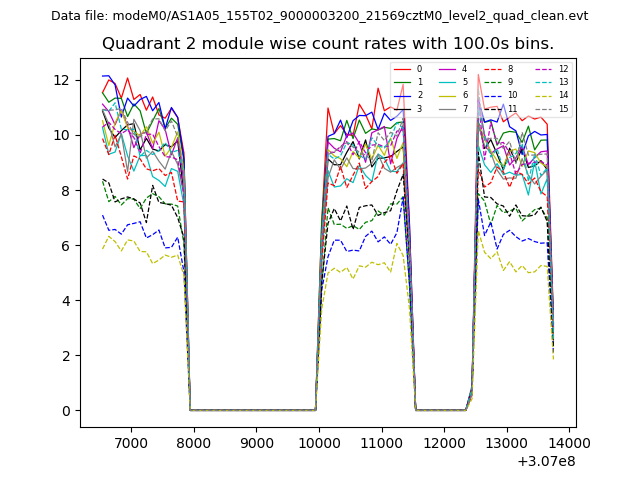 |
 |
| Module-wise count rates for Quadrant D Data is divided into 100 sec bins |
 |
 |
| Parameter | Plot |
|---|---|
| CZT HV Monitor | 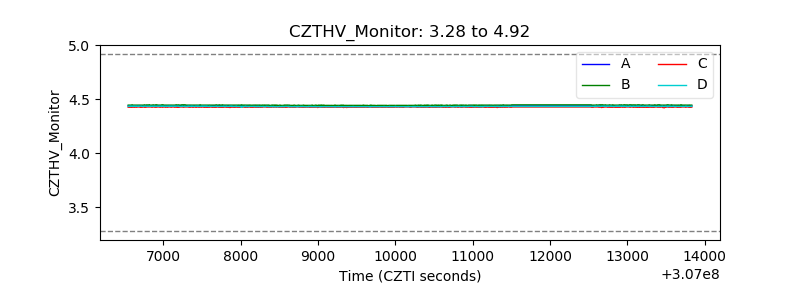 |
| D_VDD |  |
| Temperature 1 | 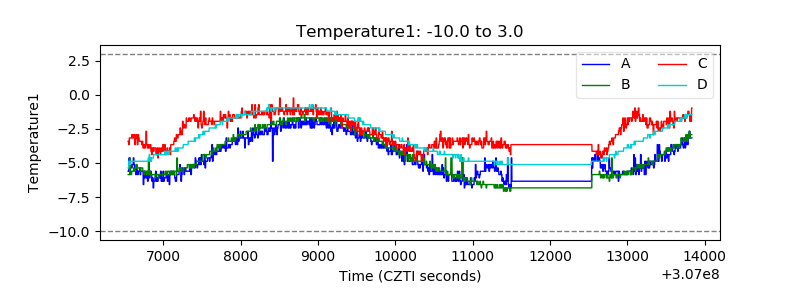 |
| Veto HV Monitor | 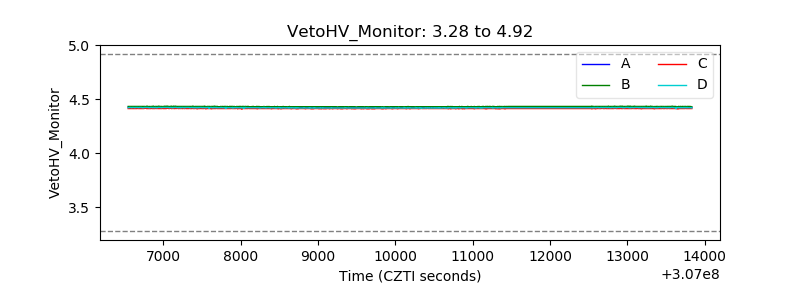 |
| Veto LLD | 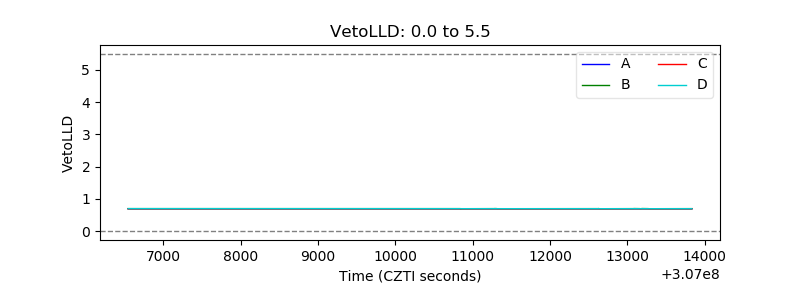 |
| Alpha Counter | 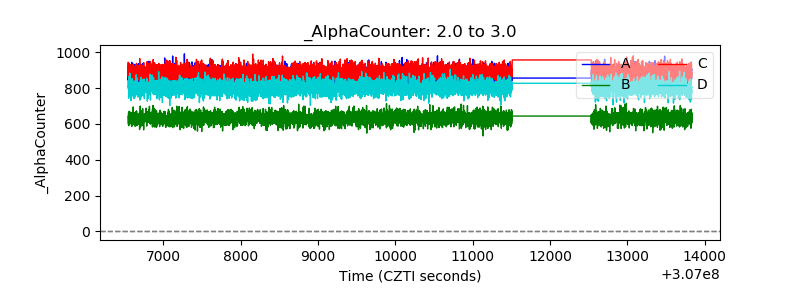 |
| _CPM_Rate | 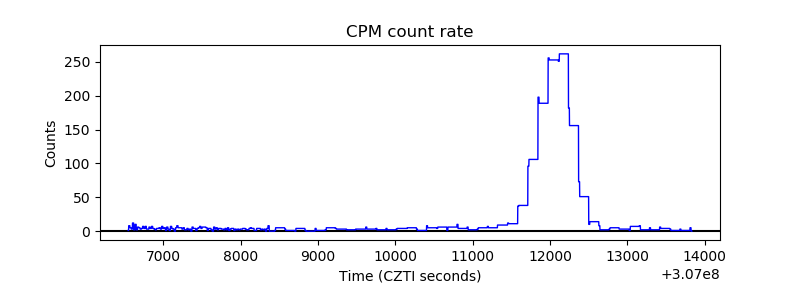 |
| CZT Counter | 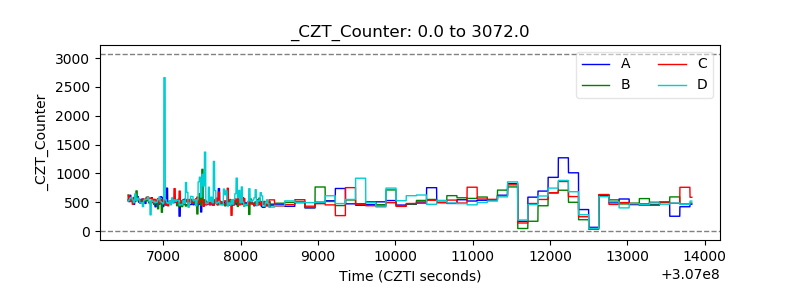 |
| +2.5 Volts monitor | 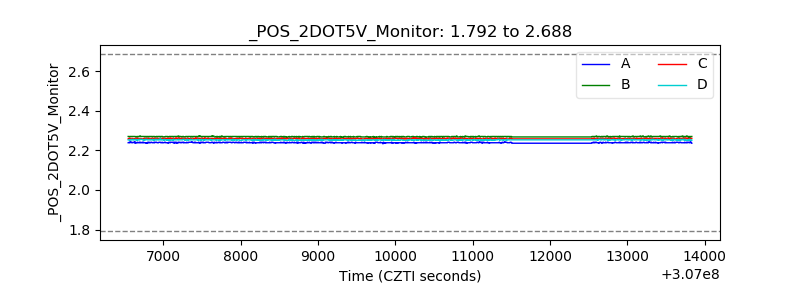 |
| +5 Volts monitor | 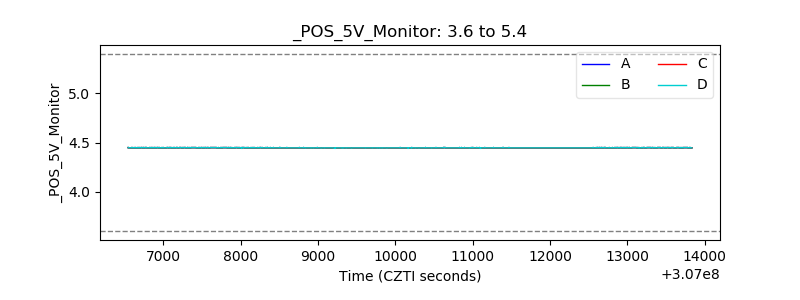 |
| _ROLL_ROT | 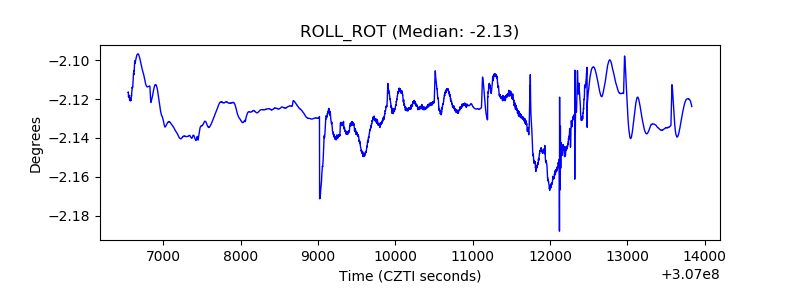 |
| _Roll_DEC | 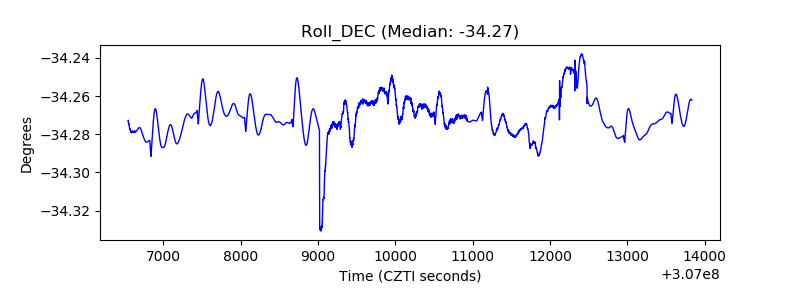 |
| _Roll_RA | 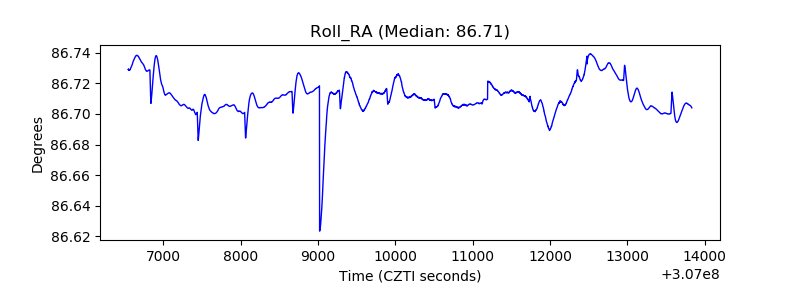 |
| Veto Counter | 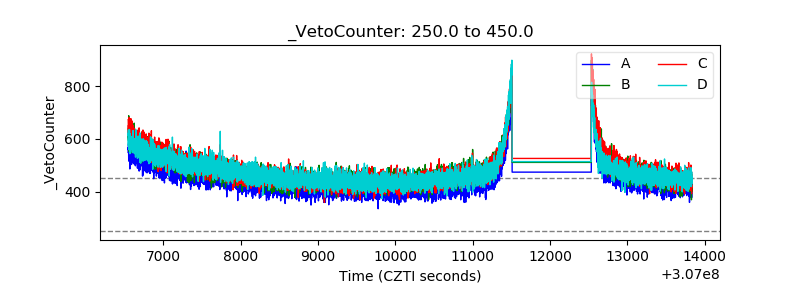 |