| Param | Original file | Final file |
|---|---|---|
| Filename | modeM0/AS1A05_155T02_9000003200_21570cztM0_level2.evt | modeM0/AS1A05_155T02_9000003200_21570cztM0_level2_quad_clean.evt |
| Size (bytes) | 491,927,040 | 93,087,360 |
| Size | 469.1 MB | 88.8 MB |
| Events in quadrant A | 3,502,824 | 584,944 |
| Events in quadrant B | 3,638,211 | 595,225 |
| Events in quadrant C | 3,566,347 | 571,786 |
| Events in quadrant D | 3,698,950 | 563,152 |
| Mode SS | |||
|---|---|---|---|
| Quadrant | BADHDUFLAG | Total packets | Discarded packets |
| A | 0 | 148 | 0 |
| B | 0 | 148 | 0 |
| C | 0 | 148 | 0 |
| D | 0 | 148 | 0 |
| Mode M9 | |||
|---|---|---|---|
| Quadrant | BADHDUFLAG | Total packets | Discarded packets |
| A | 0 | 6 | 0 |
| B | 0 | 6 | 0 |
| C | 0 | 6 | 0 |
| D | 0 | 6 | 0 |
| Mode M0 | |||
|---|---|---|---|
| Quadrant | BADHDUFLAG | Total packets | Discarded packets |
| A | 0 | 14881 | 2 |
| B | 0 | 15142 | 2 |
| C | 0 | 14920 | 2 |
| D | 0 | 15597 | 2 |
| Quadrant | Total seconds | Saturated seconds | Saturation percentage |
|---|---|---|---|
| A | 7231 | 137 | 1.894620% |
| B | 7230 | 159 | 2.199170% |
| C | 7230 | 160 | 2.213001% |
| D | 7231 | 125 | 1.728668% |
Noise dominated data is calculated using 1-second bins in cleaned event files. If a bin has >2000 counts, and if more than 50% of those come from <1% of pixels, then it is considered to be noise-dominated and hence unusable.
| Quadrant | # 1 sec bins | Bins with >0 counts | Bins with >2000 counts | High rate bins dominated by noise | Noise dominated (total time) | Noise dominated (detector-on time) | Marked lightcurve |
|---|---|---|---|---|---|---|---|
| A | 7876 | 7233 | 0 | 0 | 0.00% | 0.00% | 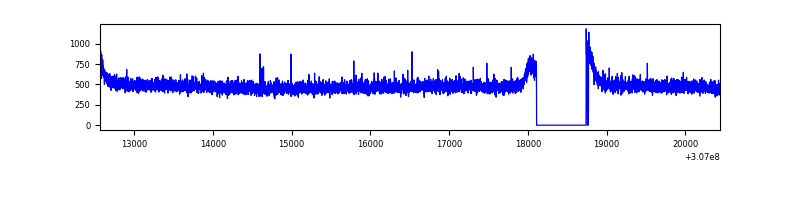 |
| B | 7875 | 7232 | 1 | 1 | 0.01% | 0.01% | 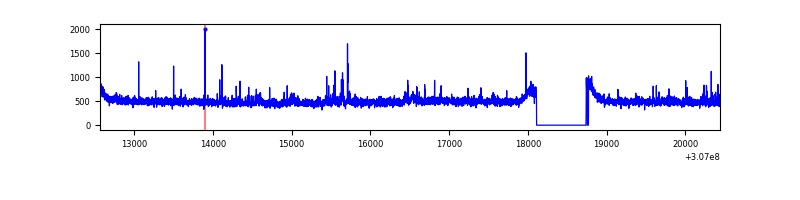 |
| C | 7875 | 7232 | 0 | 0 | 0.00% | 0.00% | 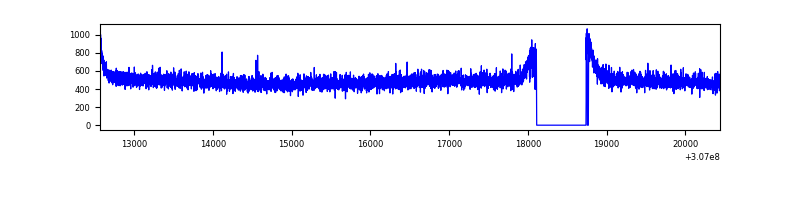 |
| D | 7876 | 7233 | 18 | 18 | 0.23% | 0.25% | 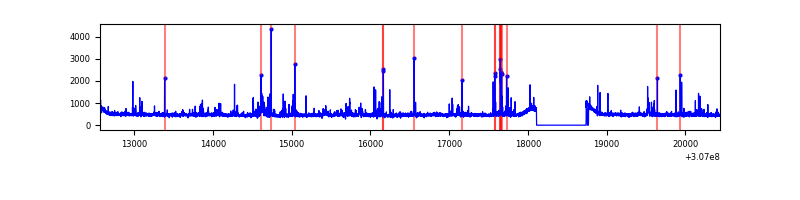 |
Top three noisy pixels from each quadrant. If the there are fewer than three noisy pixels in the level2.evt file, extra rows are filled as -1
| Pixel properties | Quadrant properties | ||||||
|---|---|---|---|---|---|---|---|
| Quadrant | DetID | PixID | Counts | Sigma | Mean | Median | Sigma |
| A | 13 | 254 | 9874 | 48.96 | 906 | 886 | 183.6 |
| A | 0 | 226 | 7802 | 37.67 | 906 | 886 | 183.6 |
| A | 3 | 137 | 7531 | 36.2 | 906 | 886 | 183.6 |
| B | 0 | 190 | 32186 | 180.66 | 902 | 877 | 173.3 |
| B | 0 | 230 | 27129 | 151.48 | 902 | 877 | 173.3 |
| B | 12 | 111 | 20365 | 112.45 | 902 | 877 | 173.3 |
| C | 14 | 238 | 137827 | 672.51 | 875 | 882 | 203.6 |
| C | 3 | 233 | 10148 | 45.5 | 875 | 882 | 203.6 |
| C | 13 | 61 | 6149 | 25.87 | 875 | 882 | 203.6 |
| D | 2 | 136 | 84846 | 389.81 | 892 | 868 | 215.4 |
| D | 13 | 153 | 54154 | 247.34 | 892 | 868 | 215.4 |
| D | 1 | 52 | 46671 | 212.61 | 892 | 868 | 215.4 |
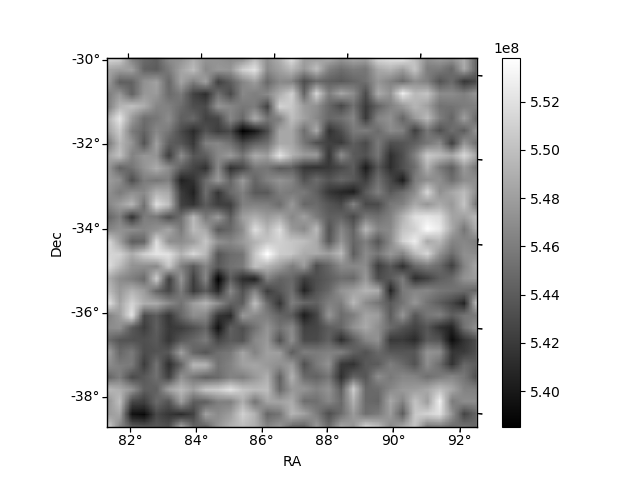
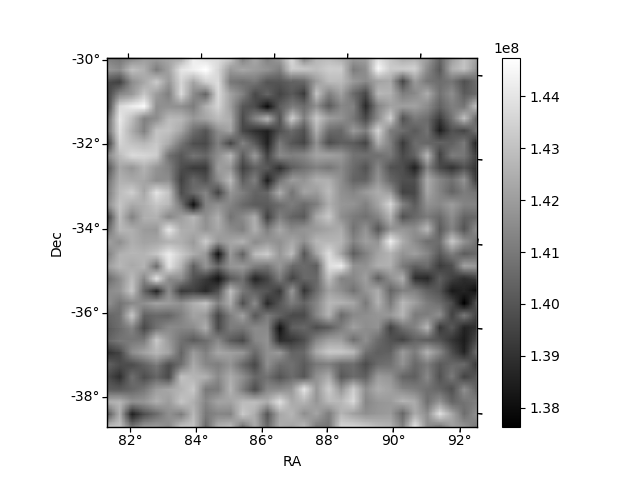
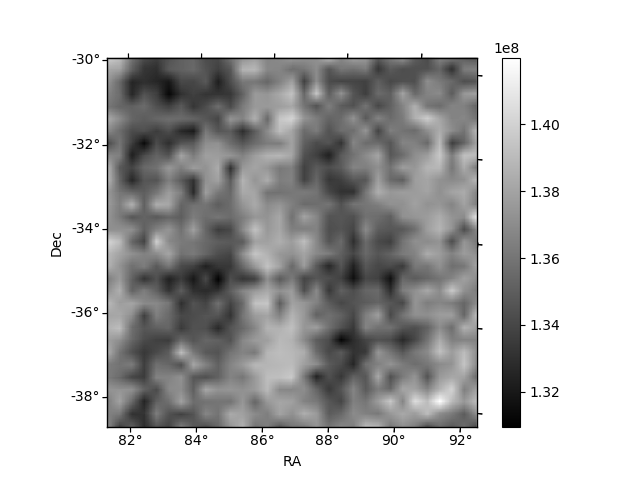
Histogram calculated using DETX and DETY for each event in the final _common_clean file
| Quadrant A | 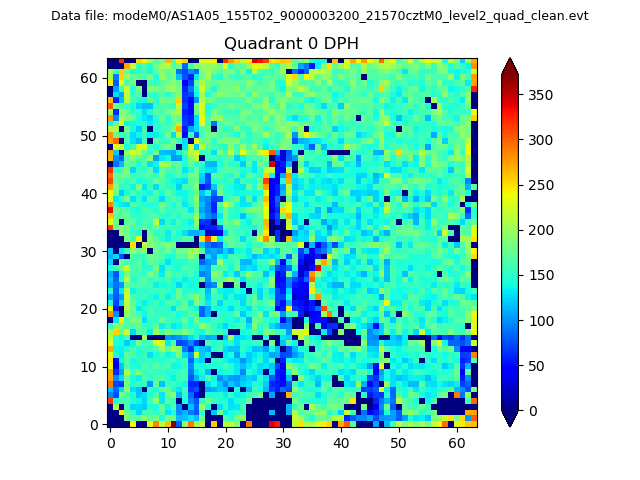 |
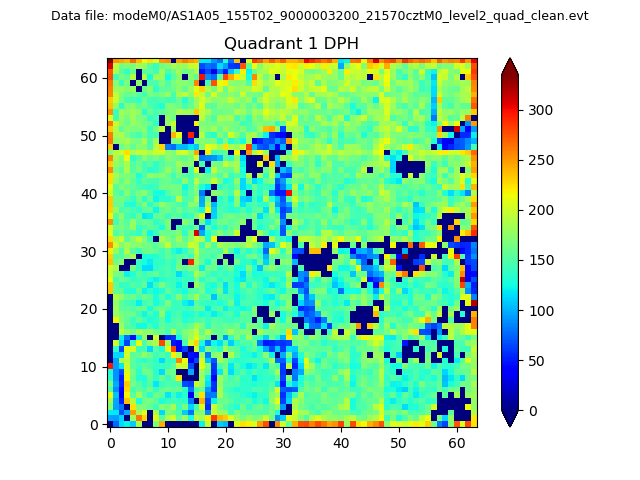 |
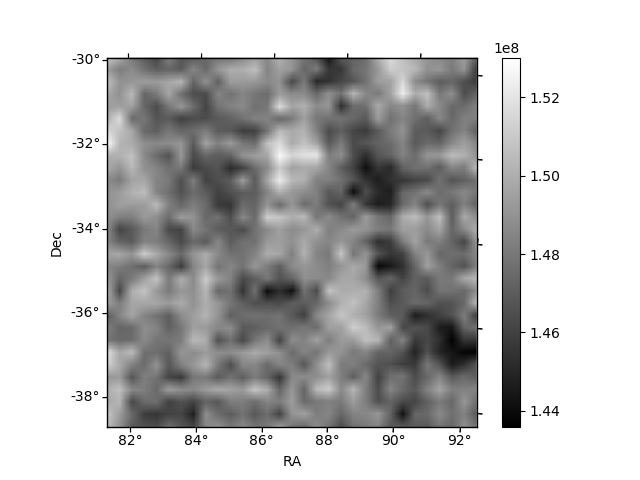
Quadrant B |
|---|---|---|---|
| Quadrant D | 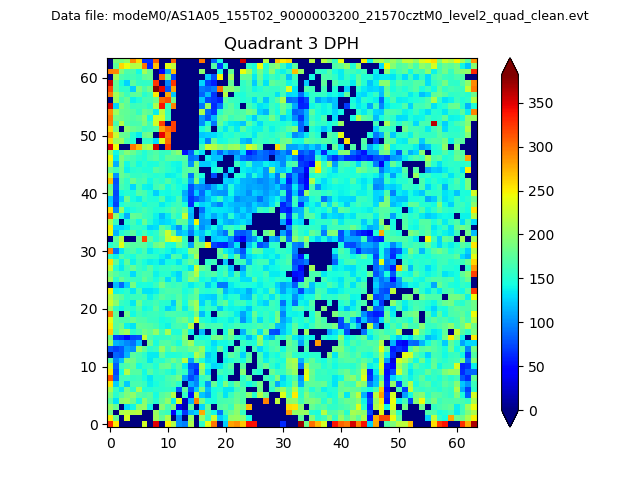 |
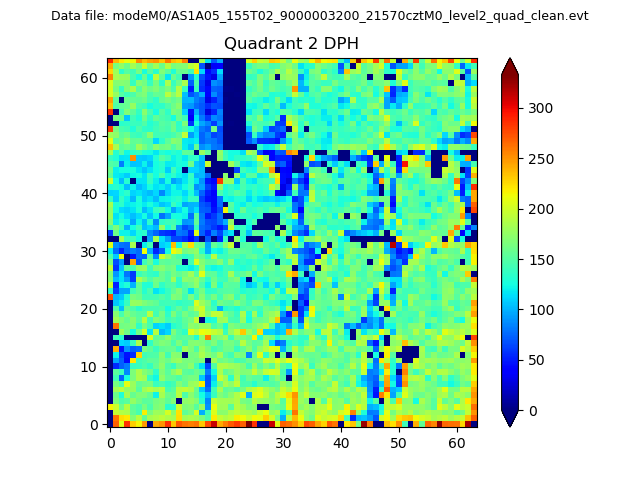 |
Quadrant C |
| Plot type | Count rate plots | Images |
|---|---|---|
| Comparison with Poisson distribution Blue bars denote a histogram of data divided into 1 sec bins. Red curve is a Poisson curve with rate = median count rate of data. |
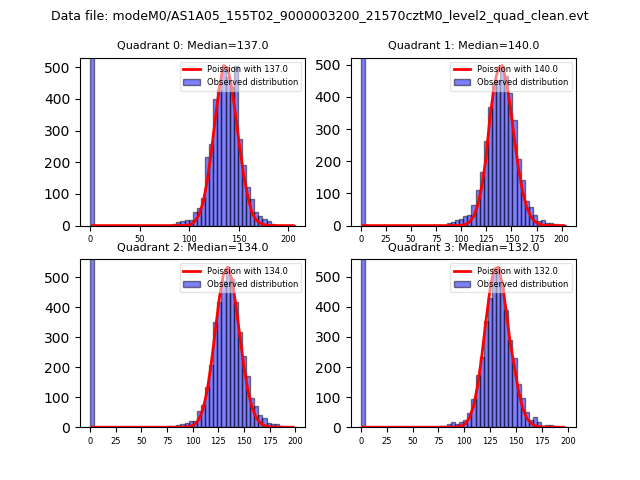 |
 |
| Quadrant-wise count rates Data is divided into 100 sec bins |
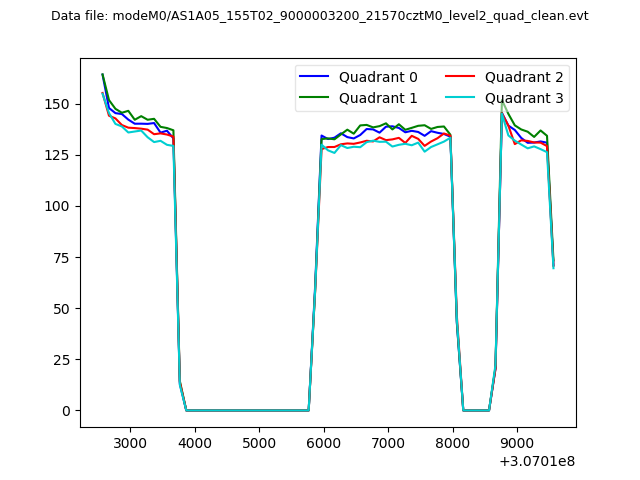 |
|
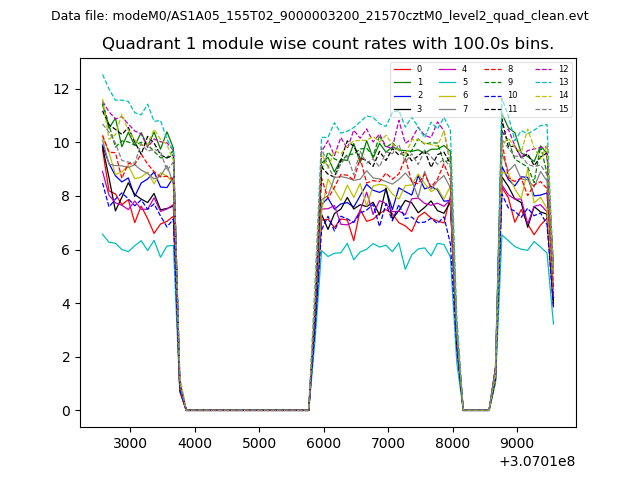
| Module-wise count rates for Quadrant A Data is divided into 100 sec bins |
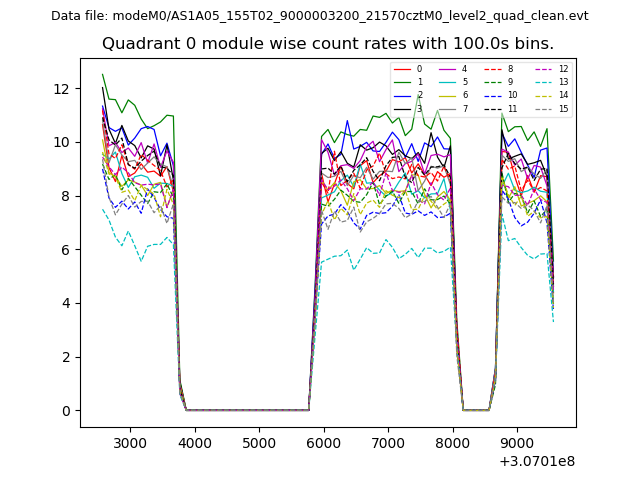 |
 |
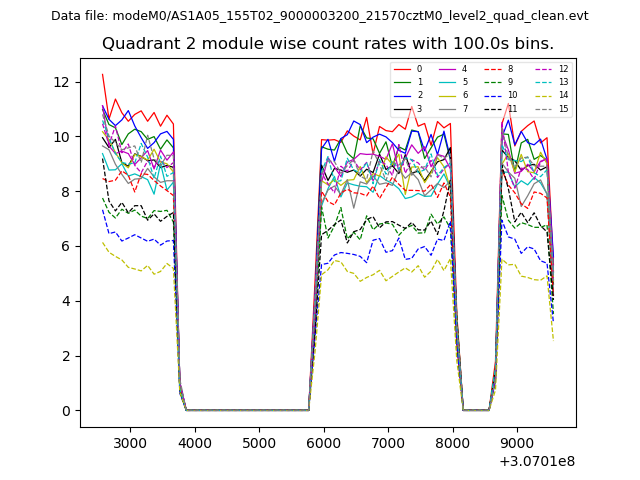
| Module-wise count rates for Quadrant B Data is divided into 100 sec bins |
 |
 |
| Module-wise count rates for Quadrant C Data is divided into 100 sec bins |
 |
 |
| Module-wise count rates for Quadrant D Data is divided into 100 sec bins |
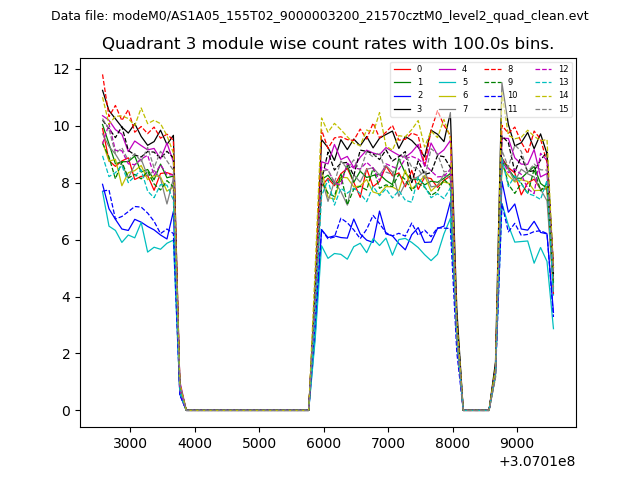 |
 |
| Parameter | Plot |
|---|---|
| CZT HV Monitor | 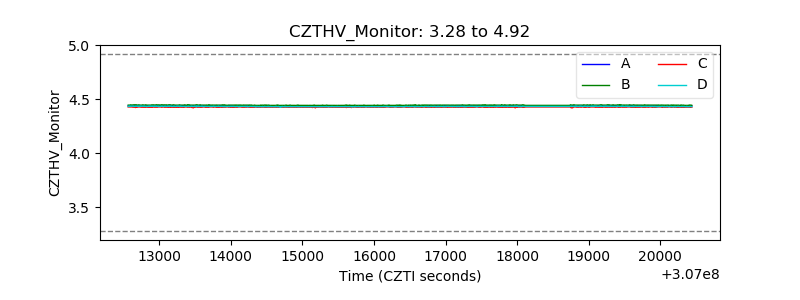 |
| D_VDD | 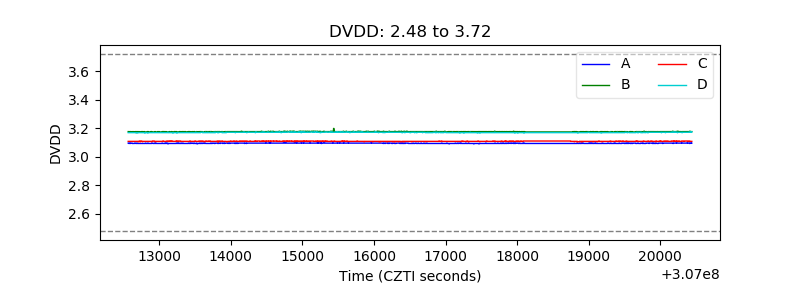 |
| Temperature 1 | 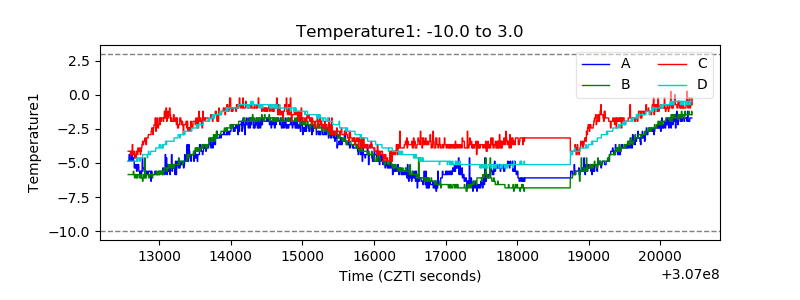 |
| Veto HV Monitor | 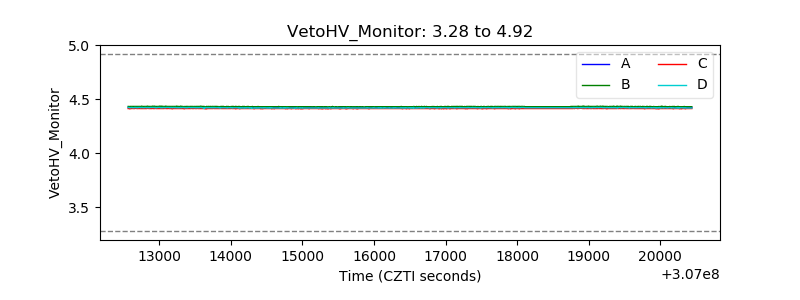 |
| Veto LLD |  |
| Alpha Counter | 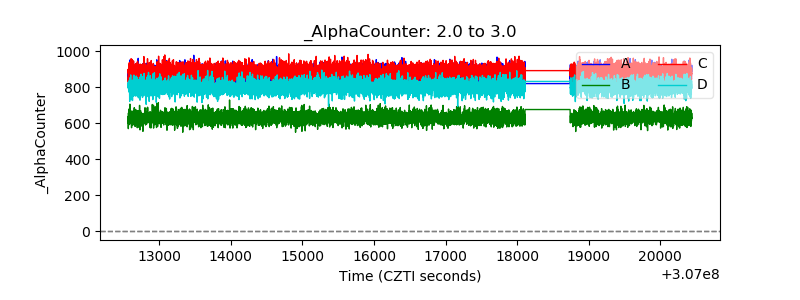 |
| _CPM_Rate | 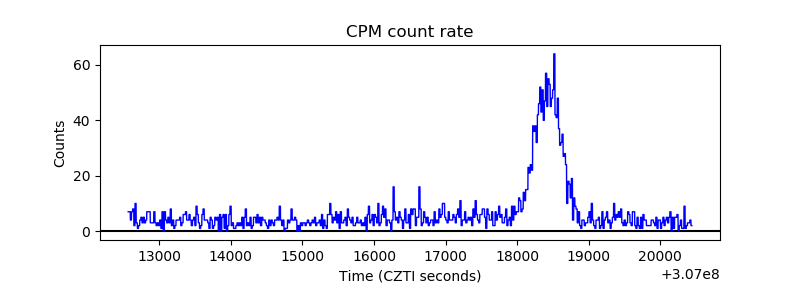 |
| CZT Counter | 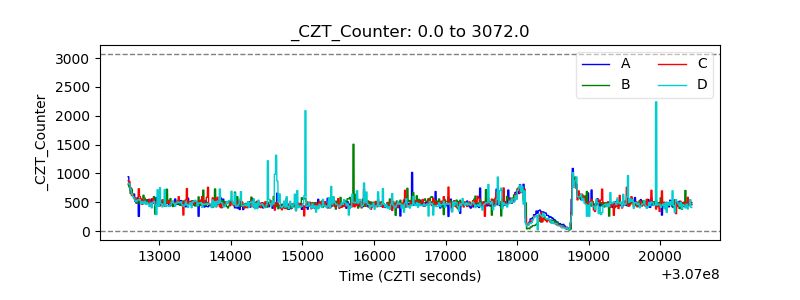 |
| +2.5 Volts monitor |  |
| +5 Volts monitor |  |
| _ROLL_ROT | 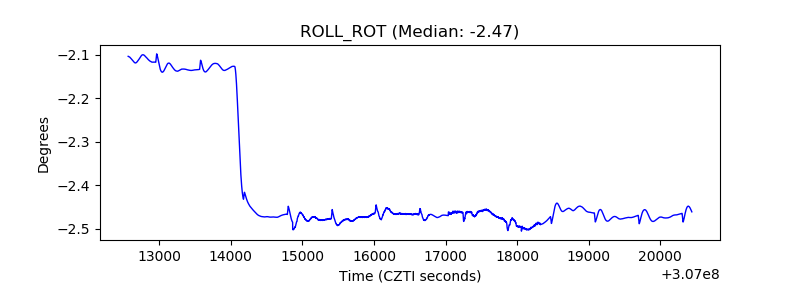 |
| _Roll_DEC | 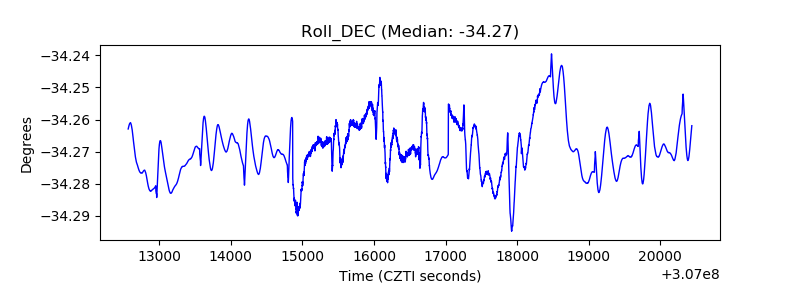 |
| _Roll_RA | 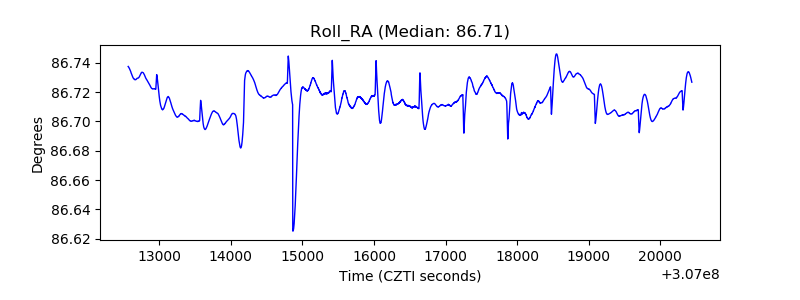 |
| Veto Counter | 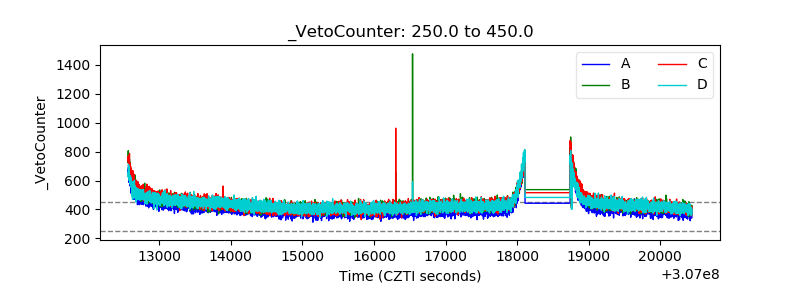 |