| Param | Original file | Final file |
|---|---|---|
| Filename | modeM0/AS1A05_155T02_9000003200_21571cztM0_level2.evt | modeM0/AS1A05_155T02_9000003200_21571cztM0_level2_quad_clean.evt |
| Size (bytes) | 557,539,200 | 95,492,160 |
| Size | 531.7 MB | 91.1 MB |
| Events in quadrant A | 3,886,022 | 589,153 |
| Events in quadrant B | 4,091,924 | 600,428 |
| Events in quadrant C | 3,986,432 | 582,361 |
| Events in quadrant D | 4,385,801 | 571,756 |
| Mode SS | |||
|---|---|---|---|
| Quadrant | BADHDUFLAG | Total packets | Discarded packets |
| A | 0 | 160 | 0 |
| B | 0 | 160 | 0 |
| C | 0 | 160 | 0 |
| D | 0 | 160 | 0 |
| Mode M9 | |||
|---|---|---|---|
| Quadrant | BADHDUFLAG | Total packets | Discarded packets |
| A | 0 | 1 | 0 |
| B | 0 | 2 | 0 |
| C | 0 | 2 | 0 |
| D | 0 | 2 | 0 |
| Mode M0 | |||
|---|---|---|---|
| Quadrant | BADHDUFLAG | Total packets | Discarded packets |
| A | 0 | 16669 | 44 |
| B | 0 | 17047 | 47 |
| C | 0 | 16845 | 45 |
| D | 0 | 18274 | 38 |
| Quadrant | Total seconds | Saturated seconds | Saturation percentage |
|---|---|---|---|
| A | 7874 | 353 | 4.483109% |
| B | 7873 | 371 | 4.712308% |
| C | 7873 | 340 | 4.318557% |
| D | 7878 | 348 | 4.417365% |
Noise dominated data is calculated using 1-second bins in cleaned event files. If a bin has >2000 counts, and if more than 50% of those come from <1% of pixels, then it is considered to be noise-dominated and hence unusable.
| Quadrant | # 1 sec bins | Bins with >0 counts | Bins with >2000 counts | High rate bins dominated by noise | Noise dominated (total time) | Noise dominated (detector-on time) | Marked lightcurve |
|---|---|---|---|---|---|---|---|
| A | 7988 | 7895 | 0 | 0 | 0.00% | 0.00% | 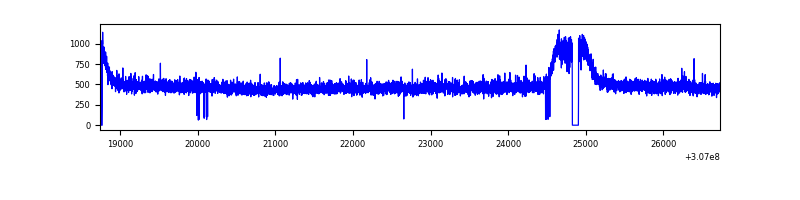 |
| B | 7988 | 7887 | 9 | 9 | 0.11% | 0.11% | 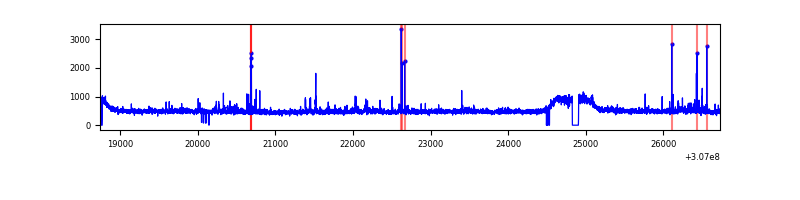 |
| C | 7988 | 7891 | 0 | 0 | 0.00% | 0.00% | 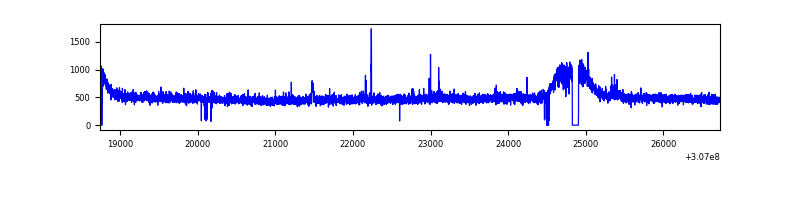 |
| D | 7988 | 7895 | 67 | 67 | 0.84% | 0.85% | 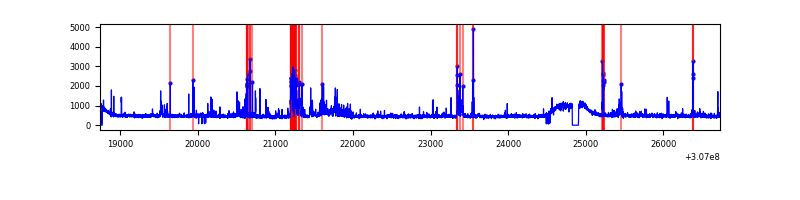 |
Top three noisy pixels from each quadrant. If the there are fewer than three noisy pixels in the level2.evt file, extra rows are filled as -1
| Pixel properties | Quadrant properties | ||||||
|---|---|---|---|---|---|---|---|
| Quadrant | DetID | PixID | Counts | Sigma | Mean | Median | Sigma |
| A | 13 | 254 | 9683 | 42.35 | 1008 | 981 | 205.5 |
| A | 0 | 226 | 8808 | 38.09 | 1008 | 981 | 205.5 |
| A | 3 | 137 | 8633 | 37.24 | 1008 | 981 | 205.5 |
| B | 3 | 64 | 52057 | 262.11 | 998 | 973 | 194.9 |
| B | 0 | 230 | 43028 | 215.78 | 998 | 973 | 194.9 |
| B | 0 | 190 | 32434 | 161.43 | 998 | 973 | 194.9 |
| C | 14 | 238 | 149887 | 648.23 | 972 | 976 | 229.7 |
| C | 3 | 233 | 25498 | 106.75 | 972 | 976 | 229.7 |
| C | 0 | 239 | 10209 | 40.19 | 972 | 976 | 229.7 |
| D | 7 | 38 | 219625 | 905.75 | 994 | 964 | 241.4 |
| D | 13 | 153 | 101342 | 415.79 | 994 | 964 | 241.4 |
| D | 2 | 136 | 100363 | 411.73 | 994 | 964 | 241.4 |
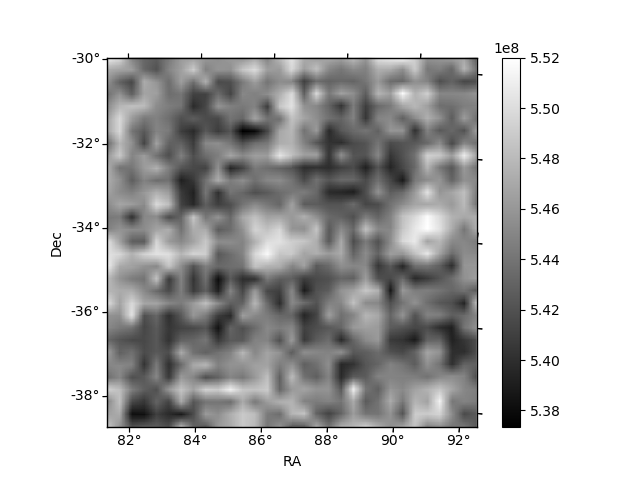
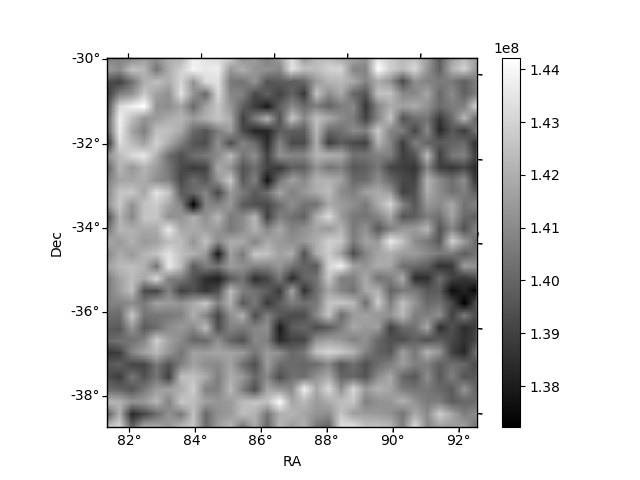
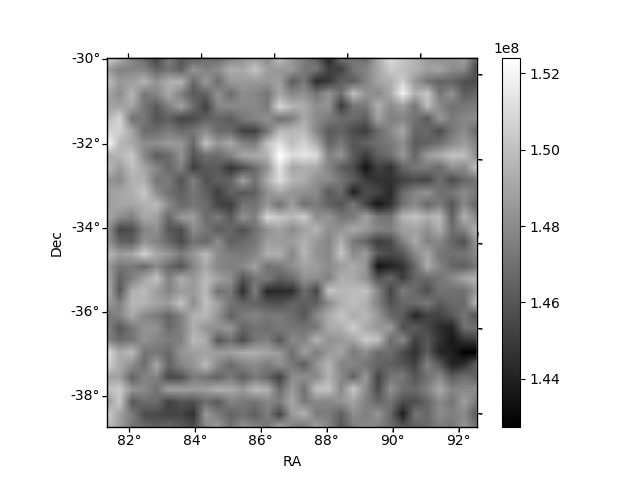
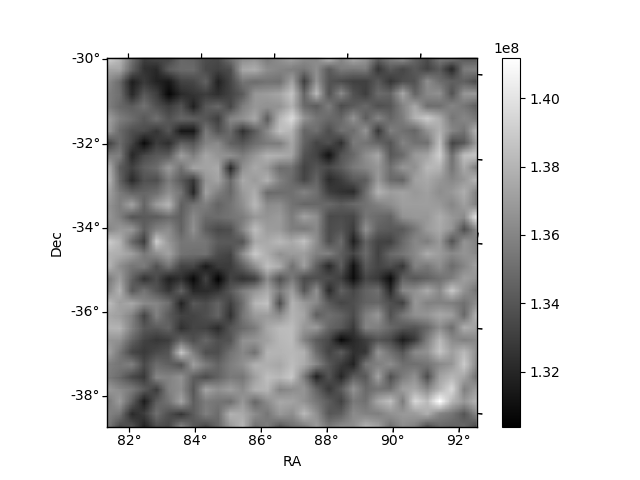
Histogram calculated using DETX and DETY for each event in the final _common_clean file
| Quadrant A | 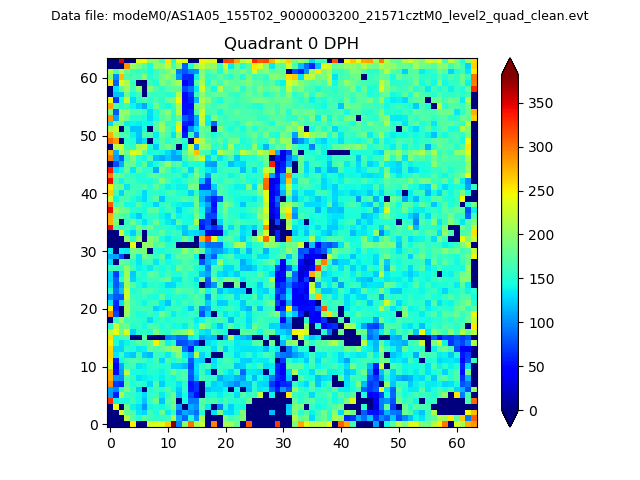 |
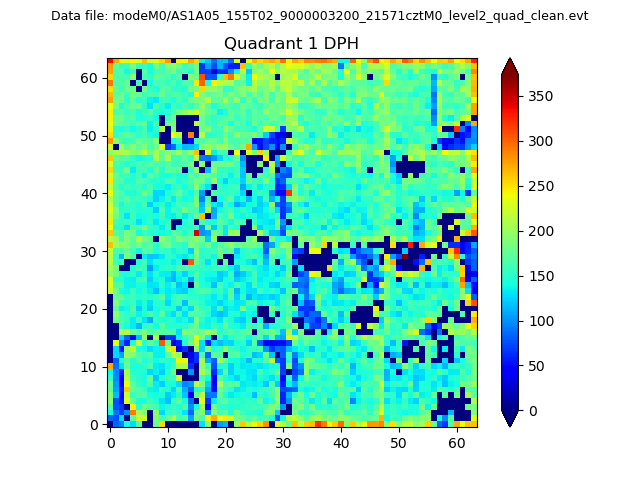 |
Quadrant B |
|---|---|---|---|
| Quadrant D | 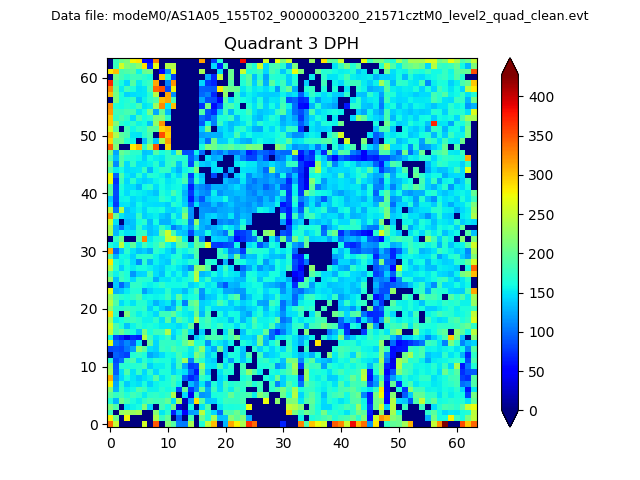 |
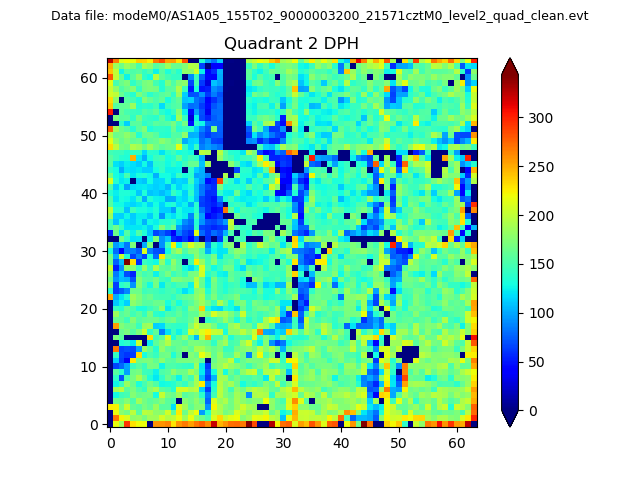 |
Quadrant C |
| Plot type | Count rate plots | Images |
|---|---|---|
| Comparison with Poisson distribution Blue bars denote a histogram of data divided into 1 sec bins. Red curve is a Poisson curve with rate = median count rate of data. |
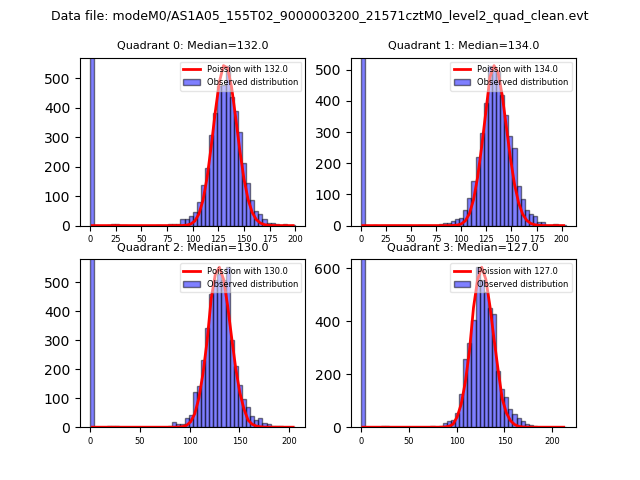 |
 |
| Quadrant-wise count rates Data is divided into 100 sec bins |
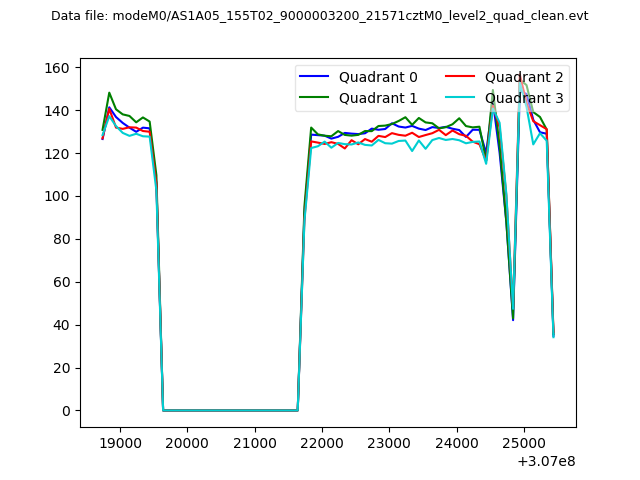 |
|
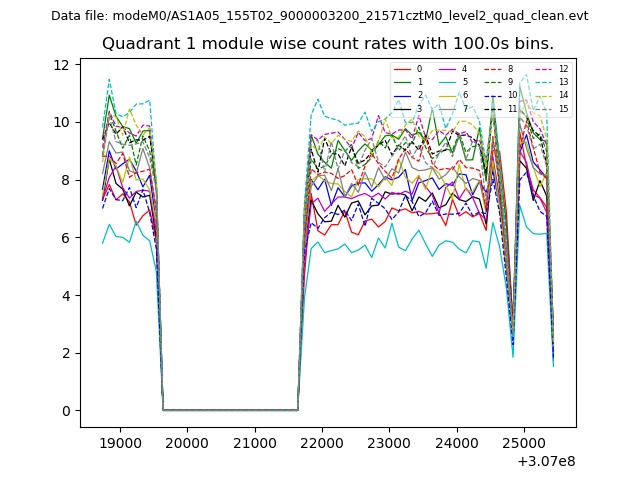
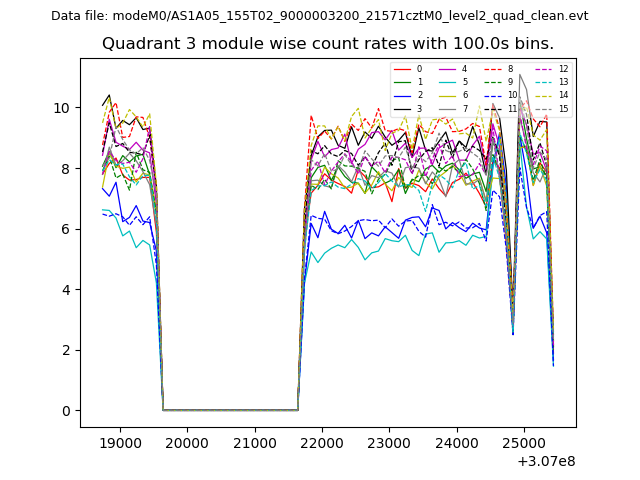
| Module-wise count rates for Quadrant A Data is divided into 100 sec bins |
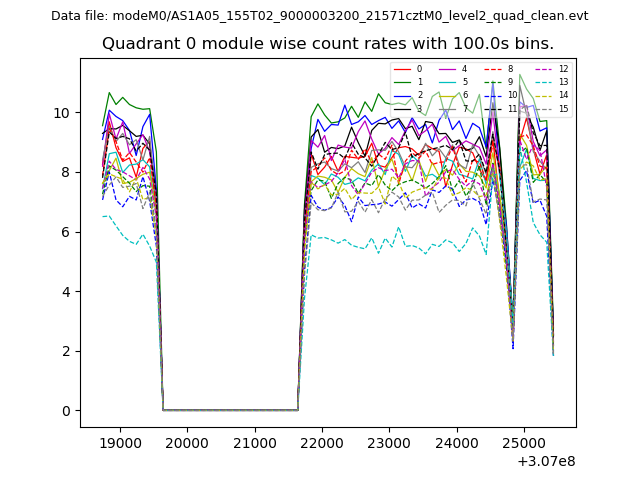 |
 |
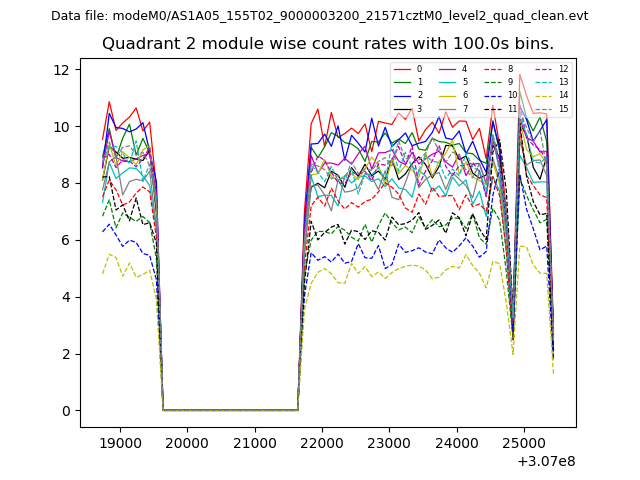
| Module-wise count rates for Quadrant B Data is divided into 100 sec bins |
 |
 |
| Module-wise count rates for Quadrant C Data is divided into 100 sec bins |
 |
 |
| Module-wise count rates for Quadrant D Data is divided into 100 sec bins |
 |
 |
| Parameter | Plot |
|---|---|
| CZT HV Monitor | 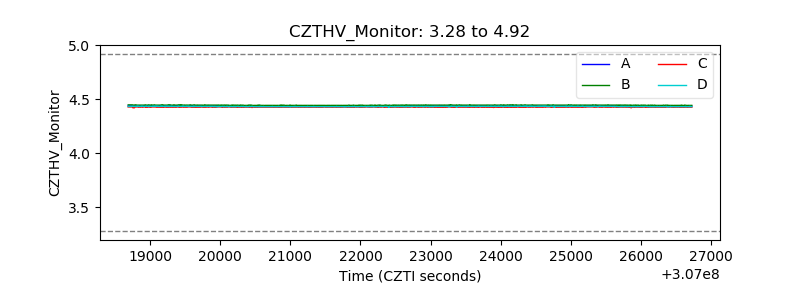 |
| D_VDD | 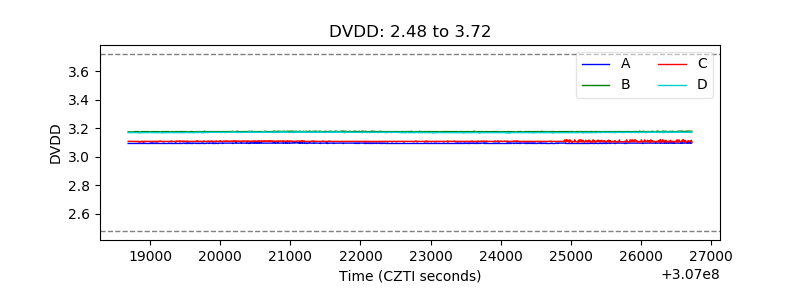 |
| Temperature 1 |  |
| Veto HV Monitor | 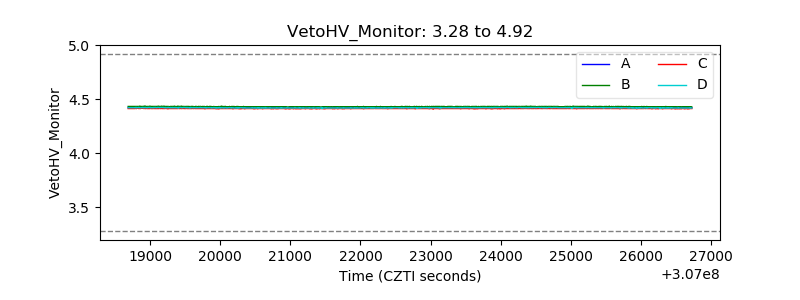 |
| Veto LLD | 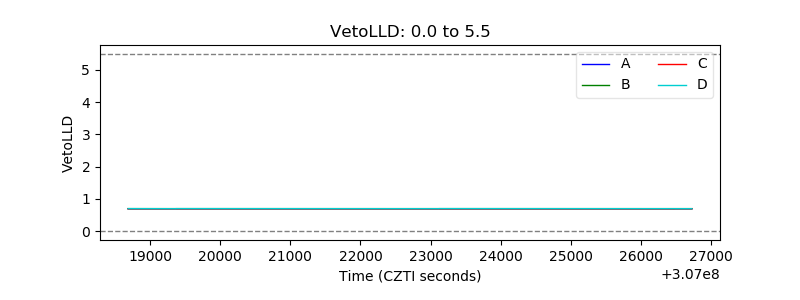 |
| Alpha Counter | 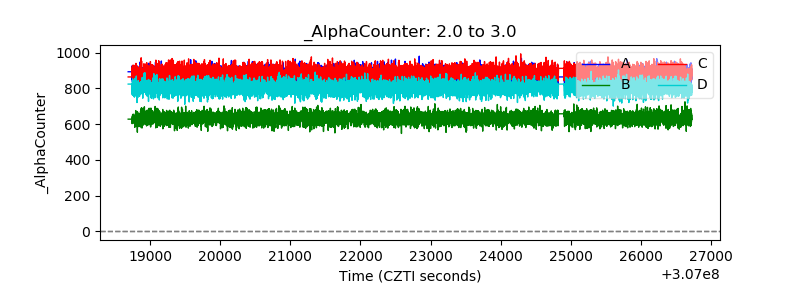 |
| _CPM_Rate | 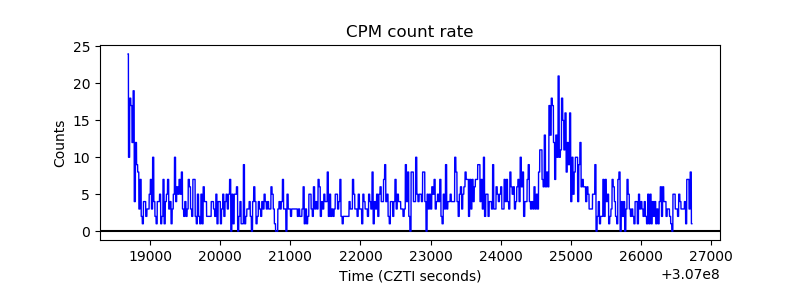 |
| CZT Counter | 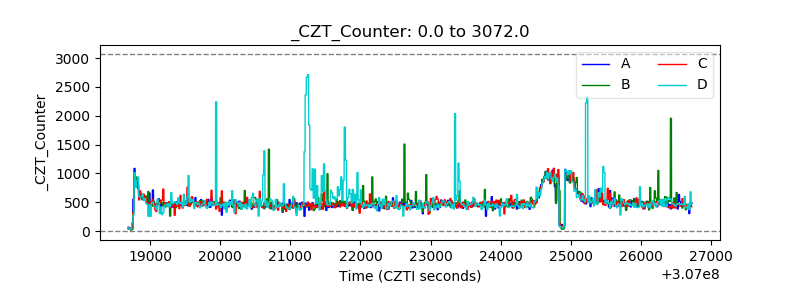 |
| +2.5 Volts monitor | 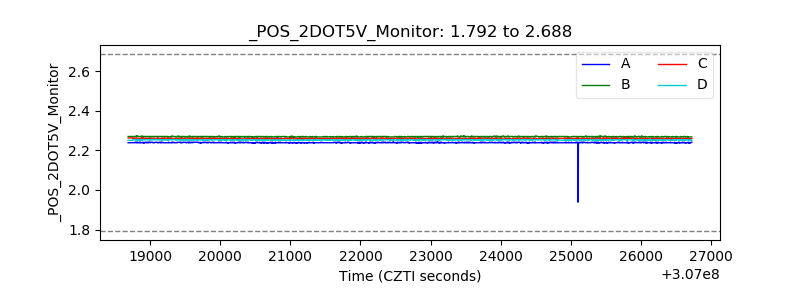 |
| +5 Volts monitor |  |
| _ROLL_ROT | 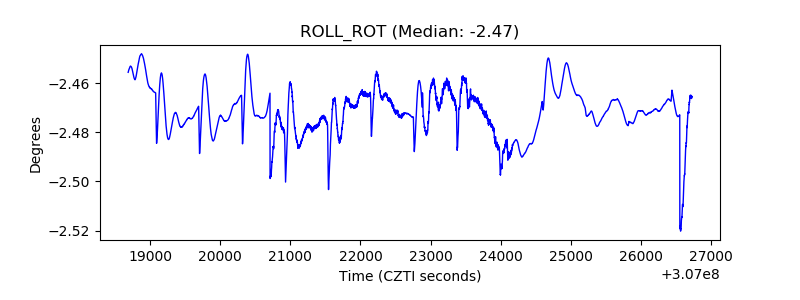 |
| _Roll_DEC | 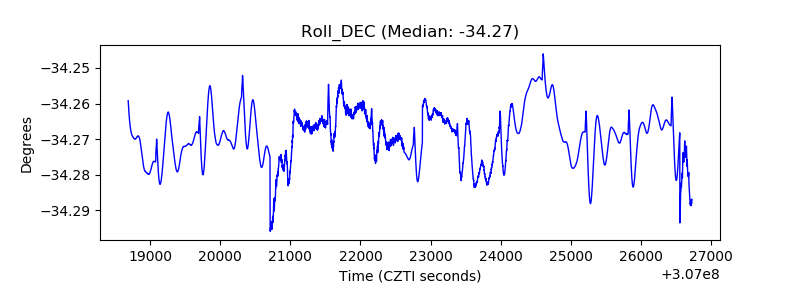 |
| _Roll_RA | 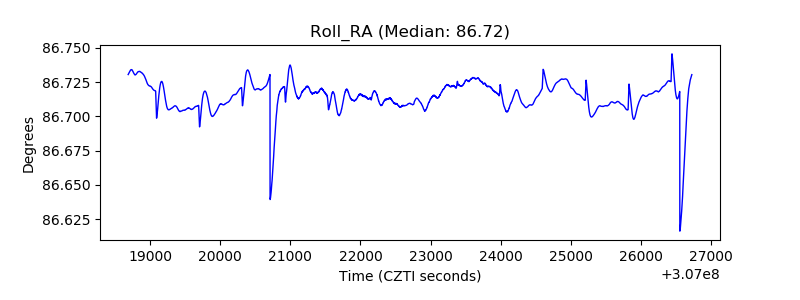 |
| Veto Counter | 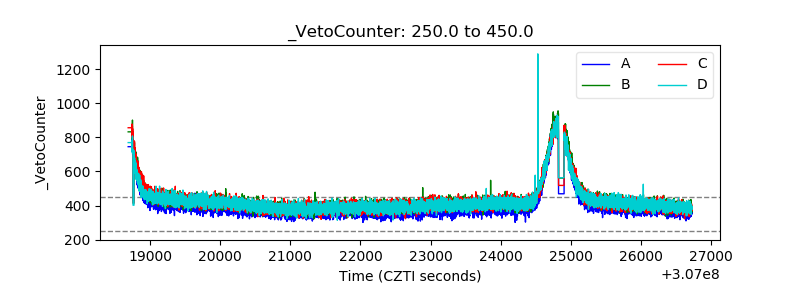 |