| Param | Original file | Final file |
|---|---|---|
| Filename | modeM0/AS1A05_155T02_9000003200_21573cztM0_level2.evt | modeM0/AS1A05_155T02_9000003200_21573cztM0_level2_quad_clean.evt |
| Size (bytes) | 556,750,080 | 78,393,600 |
| Size | 531.0 MB | 74.8 MB |
| Events in quadrant A | 4,375,335 | 466,447 |
| Events in quadrant B | 3,684,332 | 476,882 |
| Events in quadrant C | 3,678,793 | 458,715 |
| Events in quadrant D | 4,618,736 | 454,545 |
| Mode SS | |||
|---|---|---|---|
| Quadrant | BADHDUFLAG | Total packets | Discarded packets |
| A | 0 | 150 | 0 |
| B | 0 | 150 | 0 |
| C | 0 | 150 | 0 |
| D | 0 | 150 | 0 |
| Mode M9 | |||
|---|---|---|---|
| Quadrant | BADHDUFLAG | Total packets | Discarded packets |
| A | 0 | 4 | 0 |
| B | 0 | 4 | 0 |
| C | 0 | 4 | 0 |
| D | 0 | 4 | 0 |
| Mode M0 | |||
|---|---|---|---|
| Quadrant | BADHDUFLAG | Total packets | Discarded packets |
| A | 0 | 17790 | 1 |
| B | 0 | 15571 | 1 |
| C | 0 | 15515 | 1 |
| D | 0 | 18719 | 1 |
| Quadrant | Total seconds | Saturated seconds | Saturation percentage |
|---|---|---|---|
| A | 7431 | 271 | 3.646885% |
| B | 7432 | 102 | 1.372443% |
| C | 7432 | 102 | 1.372443% |
| D | 7432 | 238 | 3.202368% |
Noise dominated data is calculated using 1-second bins in cleaned event files. If a bin has >2000 counts, and if more than 50% of those come from <1% of pixels, then it is considered to be noise-dominated and hence unusable.
| Quadrant | # 1 sec bins | Bins with >0 counts | Bins with >2000 counts | High rate bins dominated by noise | Noise dominated (total time) | Noise dominated (detector-on time) | Marked lightcurve |
|---|---|---|---|---|---|---|---|
| A | 7836 | 7432 | 143 | 143 | 1.82% | 1.92% | 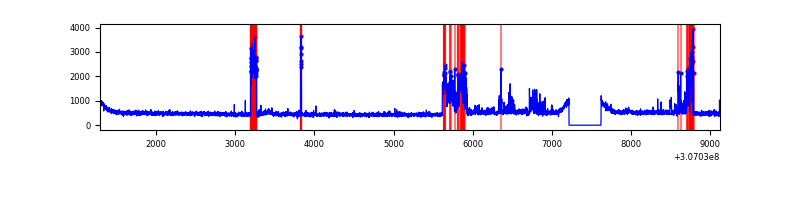 |
| B | 7837 | 7433 | 3 | 3 | 0.04% | 0.04% | 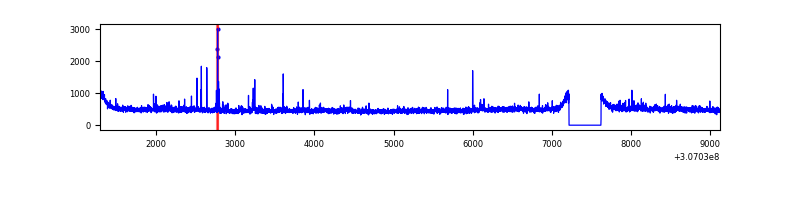 |
| C | 7837 | 7433 | 0 | 0 | 0.00% | 0.00% | 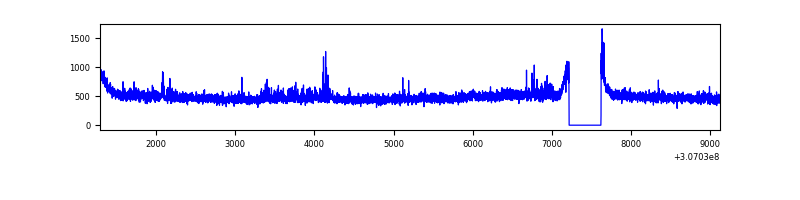 |
| D | 7837 | 7433 | 187 | 187 | 2.39% | 2.52% | 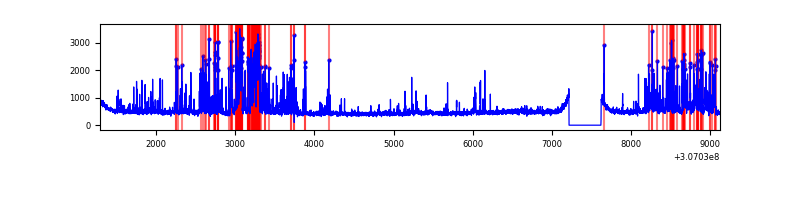 |
Top three noisy pixels from each quadrant. If the there are fewer than three noisy pixels in the level2.evt file, extra rows are filled as -1
| Pixel properties | Quadrant properties | ||||||
|---|---|---|---|---|---|---|---|
| Quadrant | DetID | PixID | Counts | Sigma | Mean | Median | Sigma |
| A | 15 | 236 | 792017 | 4327.51 | 903 | 881 | 182.8 |
| A | 15 | 174 | 101148 | 548.46 | 903 | 881 | 182.8 |
| A | 13 | 254 | 11148 | 56.16 | 903 | 881 | 182.8 |
| B | 0 | 230 | 40245 | 225.7 | 905 | 881 | 174.4 |
| B | 3 | 64 | 34568 | 193.15 | 905 | 881 | 174.4 |
| B | 0 | 190 | 27745 | 154.03 | 905 | 881 | 174.4 |
| C | 14 | 238 | 137655 | 662.89 | 875 | 880 | 206.3 |
| C | 3 | 233 | 51262 | 244.18 | 875 | 880 | 206.3 |
| C | 0 | 239 | 48732 | 231.92 | 875 | 880 | 206.3 |
| D | 2 | 136 | 595489 | 2792.42 | 880 | 856 | 212.9 |
| D | 7 | 38 | 457238 | 2143.19 | 880 | 856 | 212.9 |
| D | 13 | 153 | 87164 | 405.31 | 880 | 856 | 212.9 |
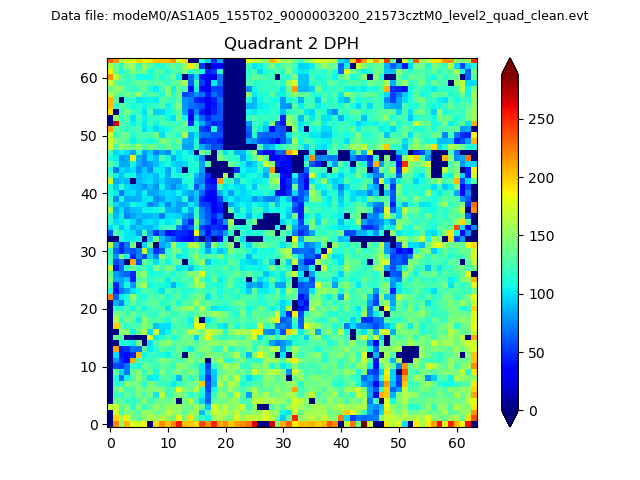
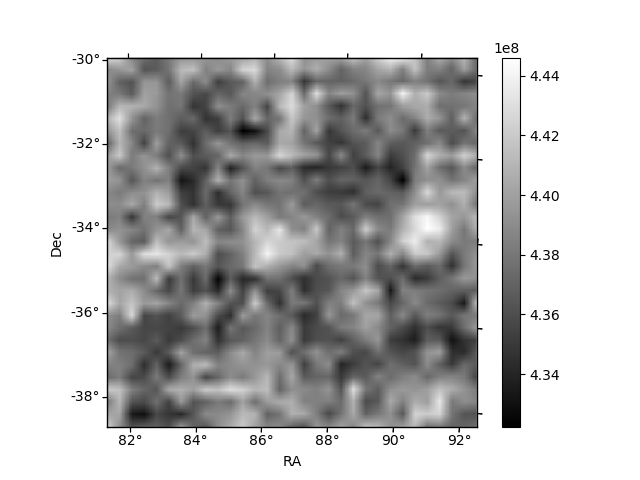
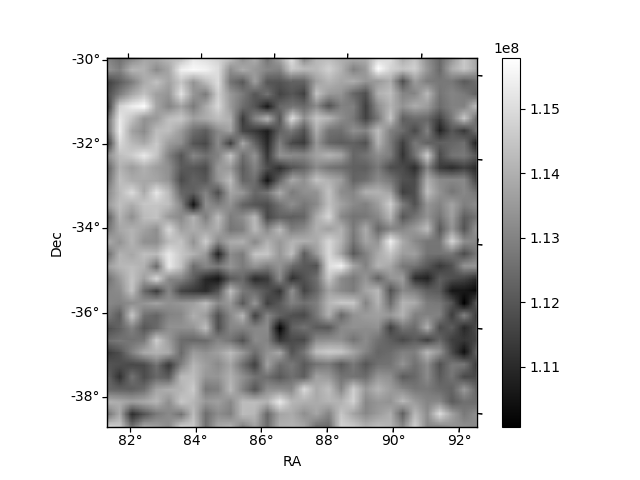
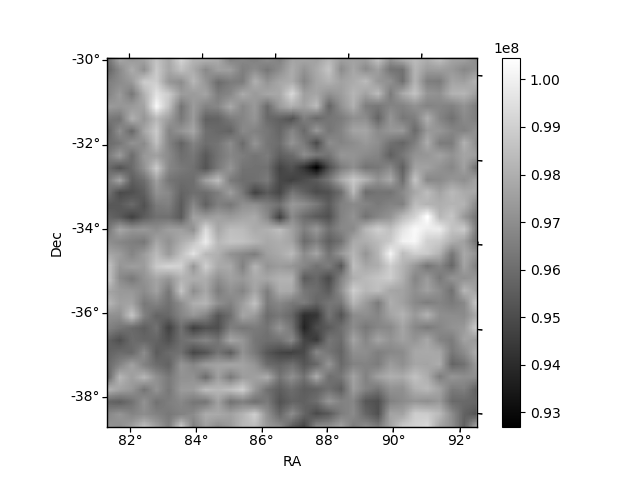
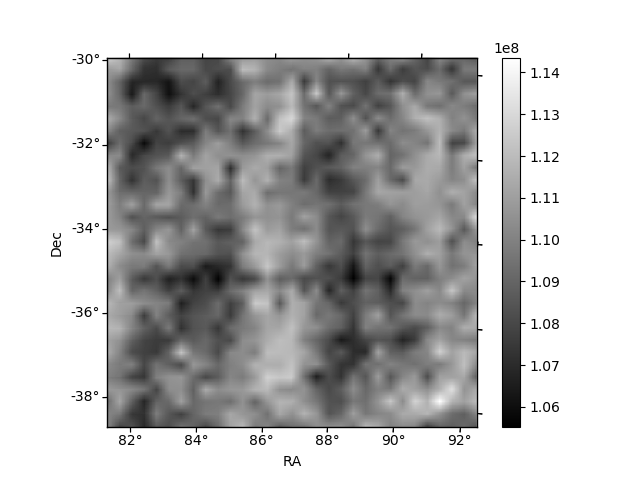
Histogram calculated using DETX and DETY for each event in the final _common_clean file
| Quadrant A | 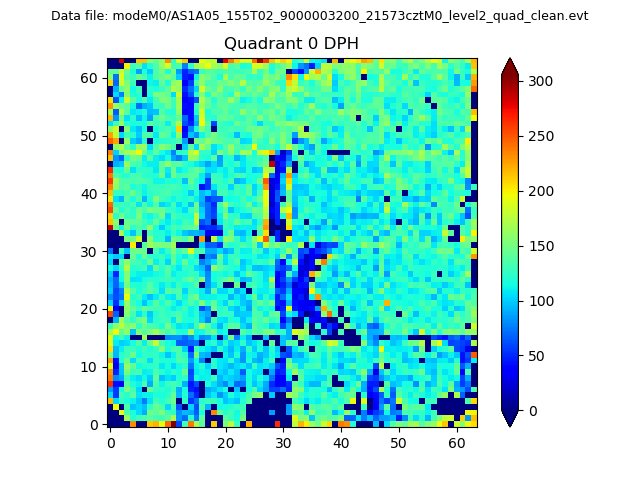 |
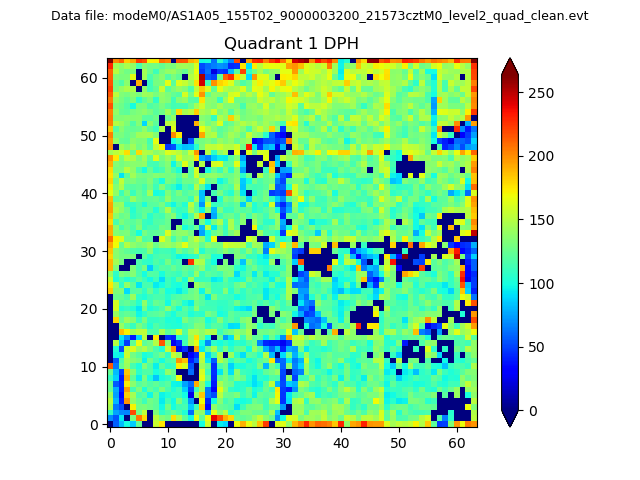 |
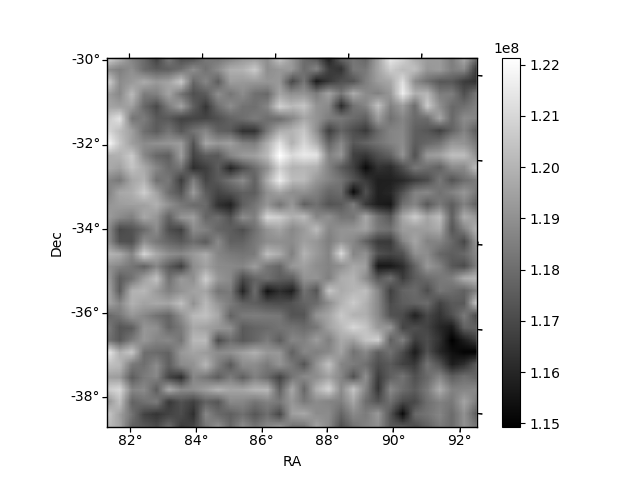
Quadrant B |
|---|---|---|---|
| Quadrant D | 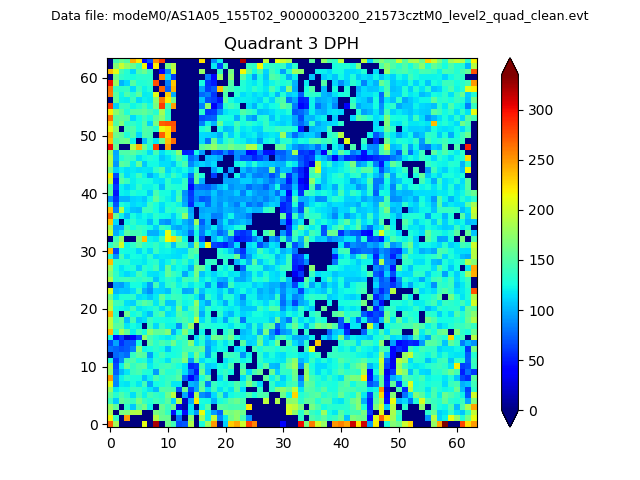 |
 |
Quadrant C |
| Plot type | Count rate plots | Images |
|---|---|---|
| Comparison with Poisson distribution Blue bars denote a histogram of data divided into 1 sec bins. Red curve is a Poisson curve with rate = median count rate of data. |
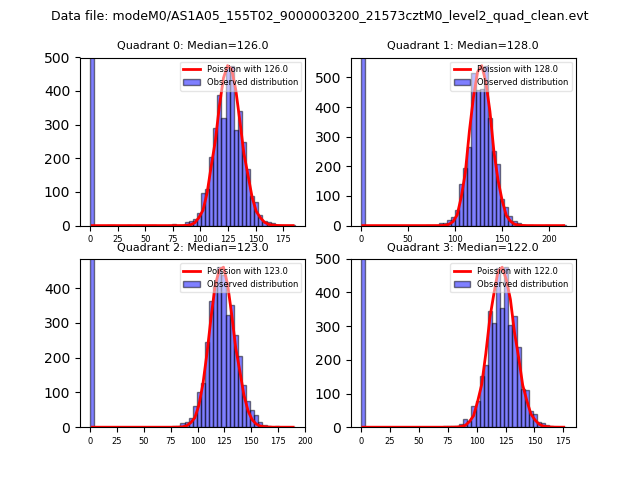 |
 |
| Quadrant-wise count rates Data is divided into 100 sec bins |
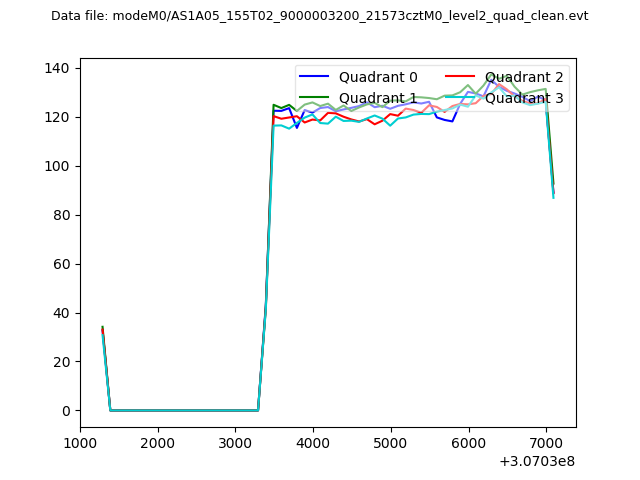 |
|
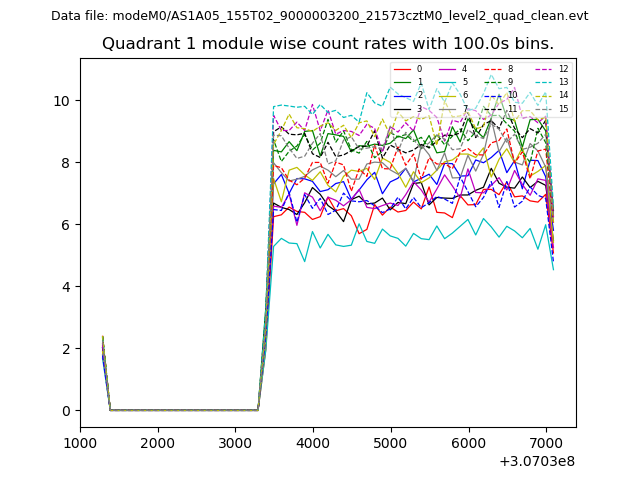
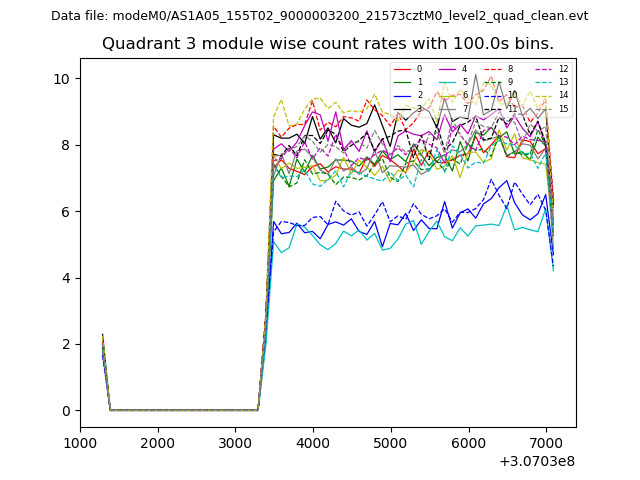
| Module-wise count rates for Quadrant A Data is divided into 100 sec bins |
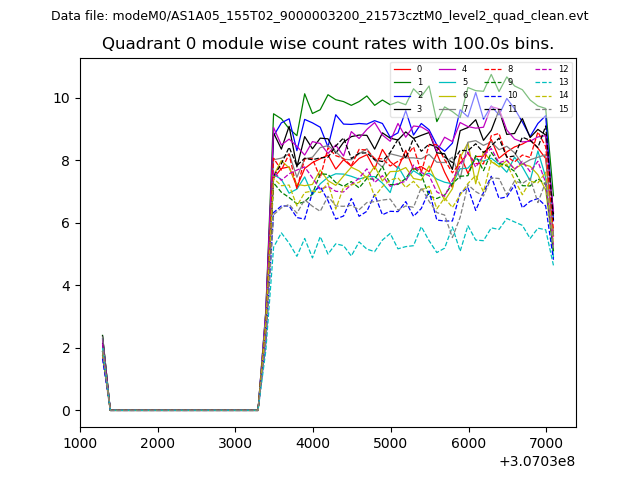 |
 |
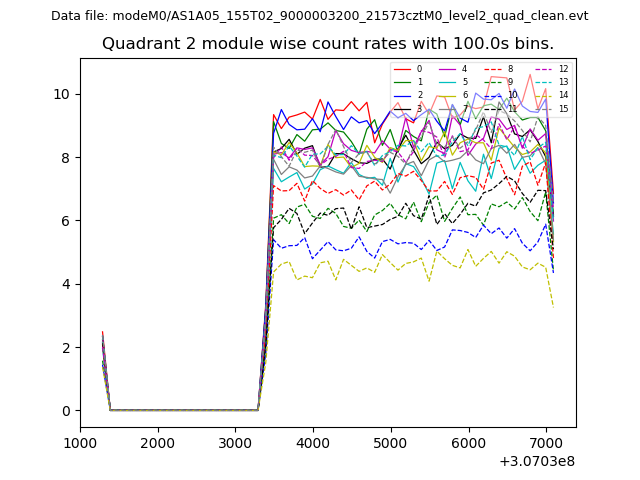
| Module-wise count rates for Quadrant B Data is divided into 100 sec bins |
 |
 |
| Module-wise count rates for Quadrant C Data is divided into 100 sec bins |
 |
 |
| Module-wise count rates for Quadrant D Data is divided into 100 sec bins |
 |
 |
| Parameter | Plot |
|---|---|
| CZT HV Monitor | 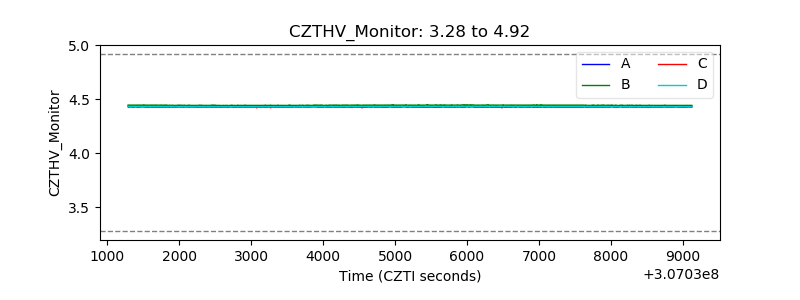 |
| D_VDD |  |
| Temperature 1 | 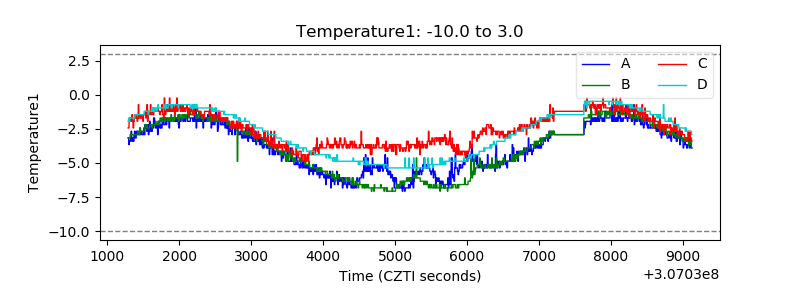 |
| Veto HV Monitor | 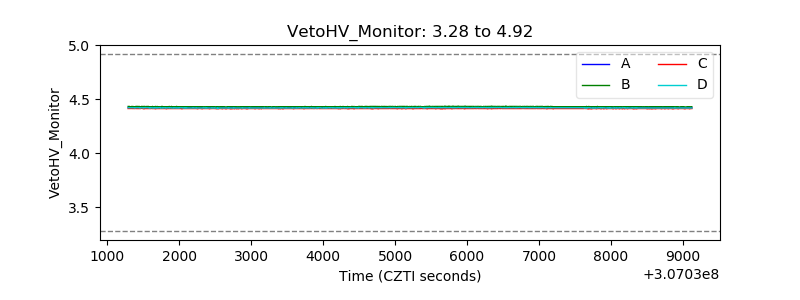 |
| Veto LLD | 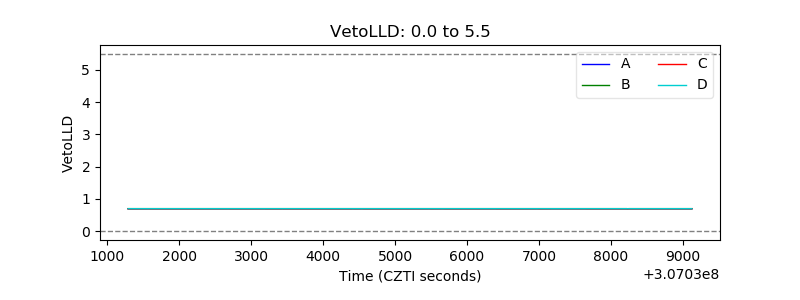 |
| Alpha Counter | 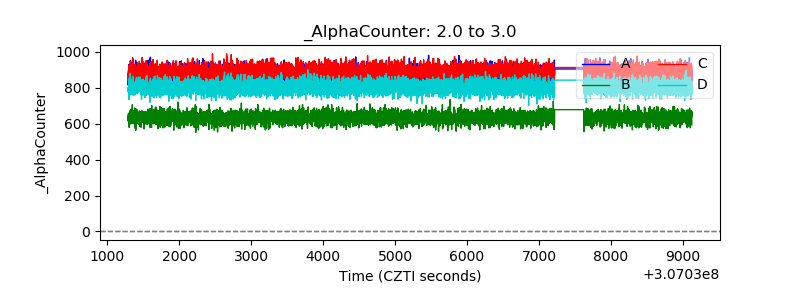 |
| _CPM_Rate | 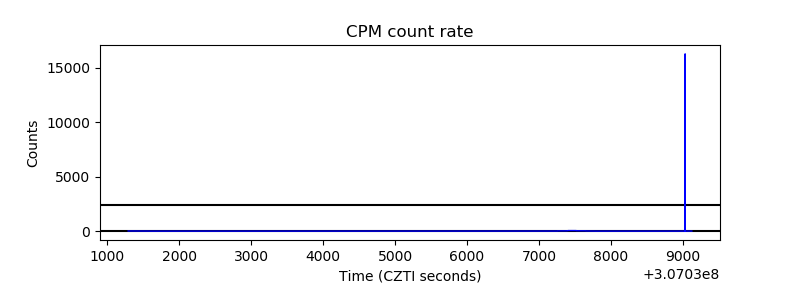 |
| CZT Counter | 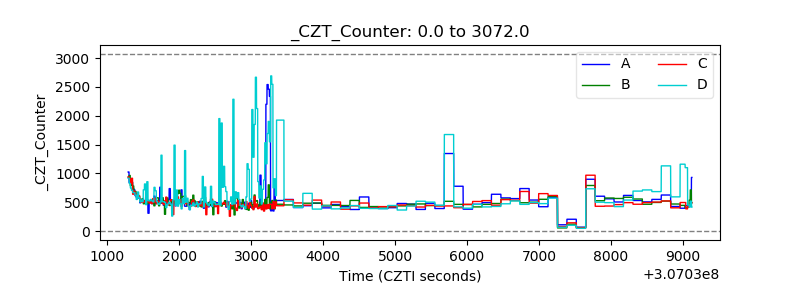 |
| +2.5 Volts monitor |  |
| +5 Volts monitor |  |
| _ROLL_ROT | 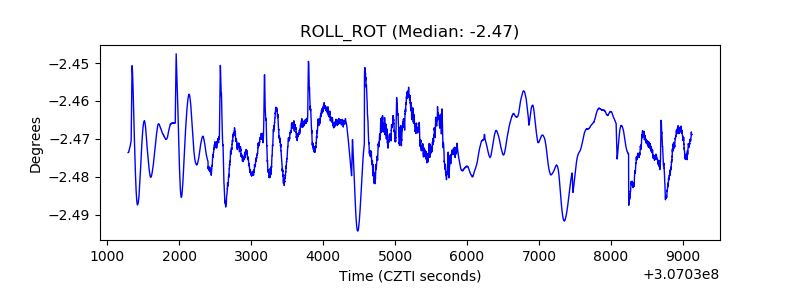 |
| _Roll_DEC |  |
| _Roll_RA | 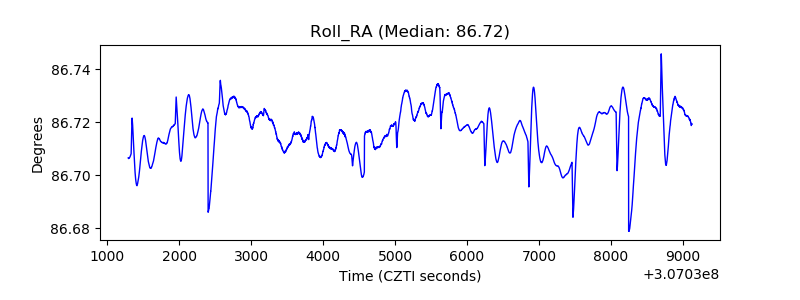 |
| Veto Counter | 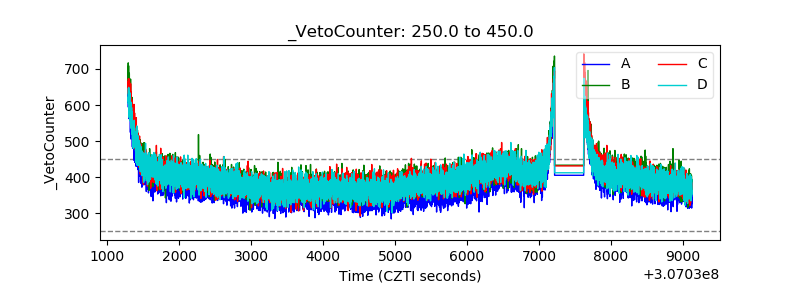 |