| Param | Original file | Final file |
|---|---|---|
| Filename | modeM0/AS1A05_182T02_9000003202_21575cztM0_level2.evt | modeM0/AS1A05_182T02_9000003202_21575cztM0_level2_quad_clean.evt |
| Size (bytes) | 226,699,200 | 46,471,680 |
| Size | 216.2 MB | 44.3 MB |
| Events in quadrant A | 1,566,647 | 296,628 |
| Events in quadrant B | 1,623,391 | 303,433 |
| Events in quadrant C | 1,585,264 | 295,070 |
| Events in quadrant D | 1,872,194 | 285,598 |
| Mode M9 | |||
|---|---|---|---|
| Quadrant | BADHDUFLAG | Total packets | Discarded packets |
| A | 0 | 7 | 0 |
| B | 0 | 7 | 0 |
| C | 0 | 7 | 0 |
| D | 0 | 7 | 0 |
| Mode M0 | |||
|---|---|---|---|
| Quadrant | BADHDUFLAG | Total packets | Discarded packets |
| A | 0 | 6559 | 1 |
| B | 0 | 6714 | 1 |
| C | 0 | 6598 | 1 |
| D | 0 | 7614 | 1 |
| Mode SS | |||
|---|---|---|---|
| Quadrant | BADHDUFLAG | Total packets | Discarded packets |
| A | 0 | 66 | 0 |
| B | 0 | 66 | 0 |
| C | 0 | 66 | 0 |
| D | 0 | 66 | 0 |
| Quadrant | Total seconds | Saturated seconds | Saturation percentage |
|---|---|---|---|
| A | 3180 | 17 | 0.534591% |
| B | 3180 | 33 | 1.037736% |
| C | 3180 | 62 | 1.949686% |
| D | 3179 | 61 | 1.918842% |
Noise dominated data is calculated using 1-second bins in cleaned event files. If a bin has >2000 counts, and if more than 50% of those come from <1% of pixels, then it is considered to be noise-dominated and hence unusable.
| Quadrant | # 1 sec bins | Bins with >0 counts | Bins with >2000 counts | High rate bins dominated by noise | Noise dominated (total time) | Noise dominated (detector-on time) | Marked lightcurve |
|---|---|---|---|---|---|---|---|
| A | 3940 | 3181 | 0 | 0 | 0.00% | 0.00% | 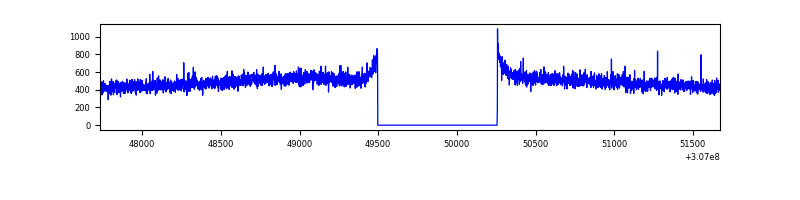 |
| B | 3940 | 3181 | 1 | 1 | 0.03% | 0.03% |  |
| C | 3940 | 3181 | 0 | 0 | 0.00% | 0.00% | 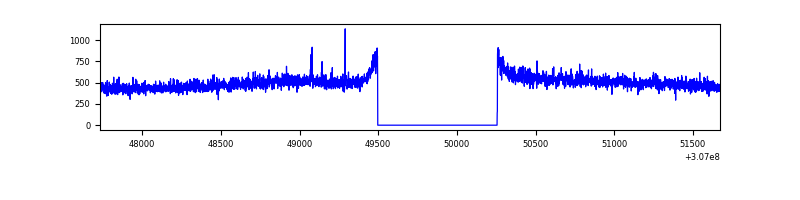 |
| D | 3939 | 3180 | 27 | 27 | 0.69% | 0.85% | 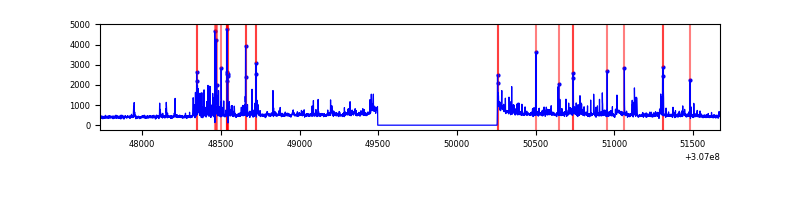 |
Top three noisy pixels from each quadrant. If the there are fewer than three noisy pixels in the level2.evt file, extra rows are filled as -1
| Pixel properties | Quadrant properties | ||||||
|---|---|---|---|---|---|---|---|
| Quadrant | DetID | PixID | Counts | Sigma | Mean | Median | Sigma |
| A | 13 | 254 | 4609 | 50.6 | 405 | 395 | 83.3 |
| A | 0 | 226 | 3626 | 38.79 | 405 | 395 | 83.3 |
| A | 3 | 137 | 3423 | 36.36 | 405 | 395 | 83.3 |
| B | 0 | 190 | 16307 | 201.22 | 403 | 392 | 79.1 |
| B | 3 | 64 | 9584 | 116.22 | 403 | 392 | 79.1 |
| B | 12 | 111 | 9448 | 114.5 | 403 | 392 | 79.1 |
| C | 14 | 238 | 61984 | 663.24 | 389 | 389 | 92.9 |
| C | 3 | 233 | 4135 | 40.34 | 389 | 389 | 92.9 |
| C | 13 | 61 | 2731 | 25.22 | 389 | 389 | 92.9 |
| D | 1 | 52 | 105681 | 1096.96 | 394 | 381 | 96.0 |
| D | 12 | 235 | 102391 | 1062.69 | 394 | 381 | 96.0 |
| D | 13 | 153 | 93242 | 967.38 | 394 | 381 | 96.0 |
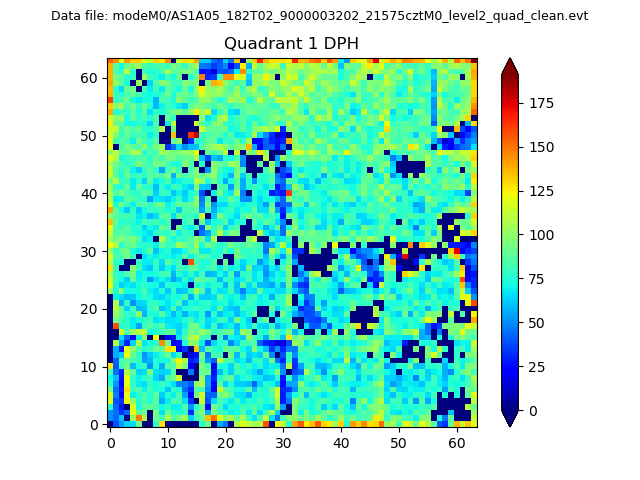
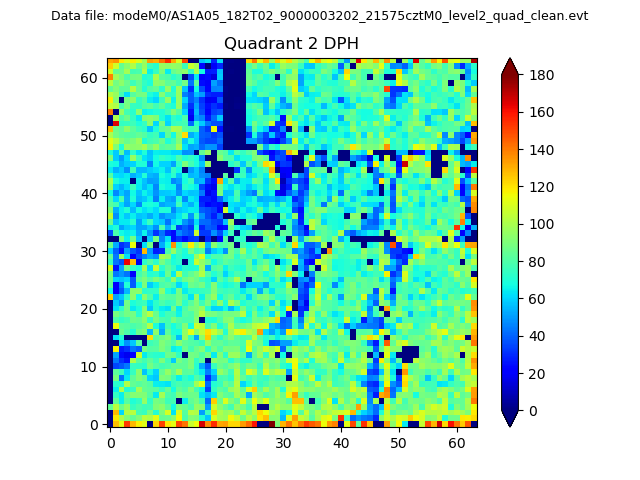
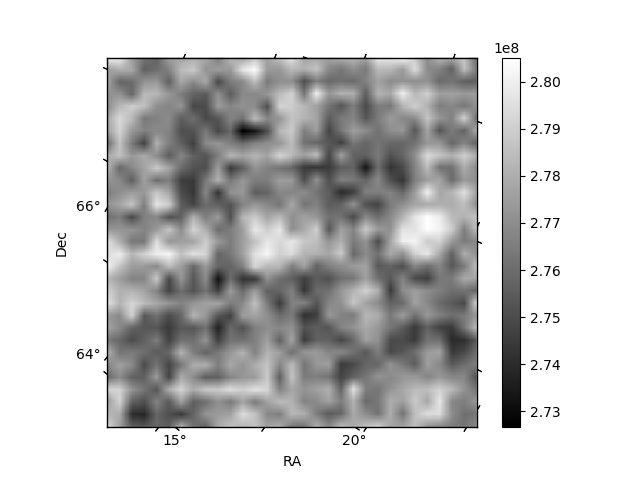
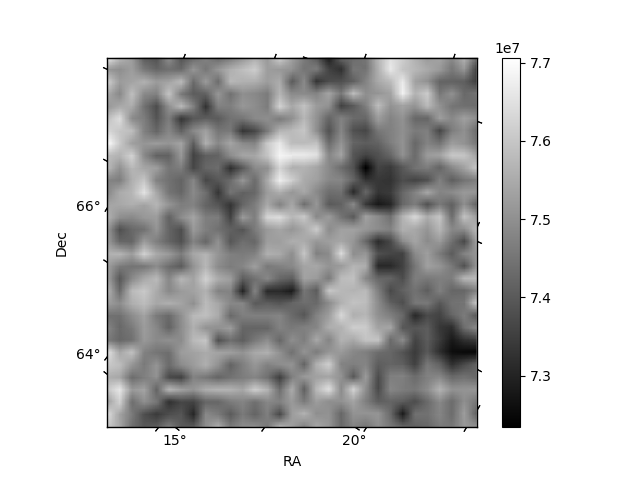
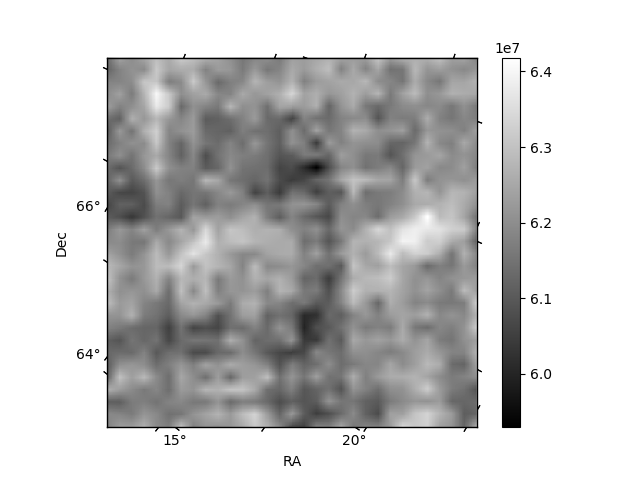
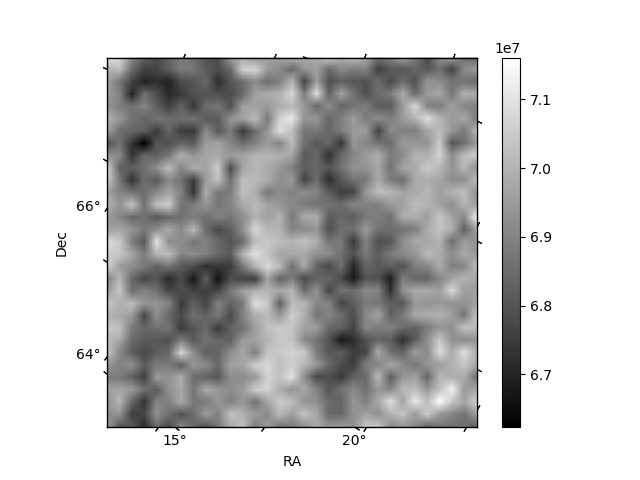
Histogram calculated using DETX and DETY for each event in the final _common_clean file
| Quadrant A | 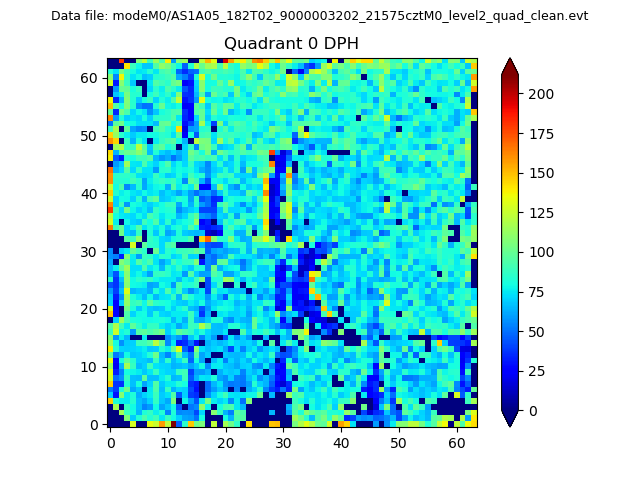 |
 |
Quadrant B |
|---|---|---|---|
| Quadrant D | 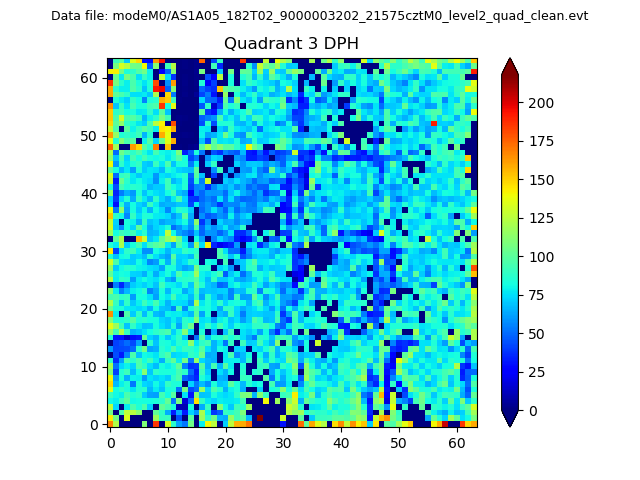 |
 |
Quadrant C |
| Plot type | Count rate plots | Images |
|---|---|---|
| Comparison with Poisson distribution Blue bars denote a histogram of data divided into 1 sec bins. Red curve is a Poisson curve with rate = median count rate of data. |
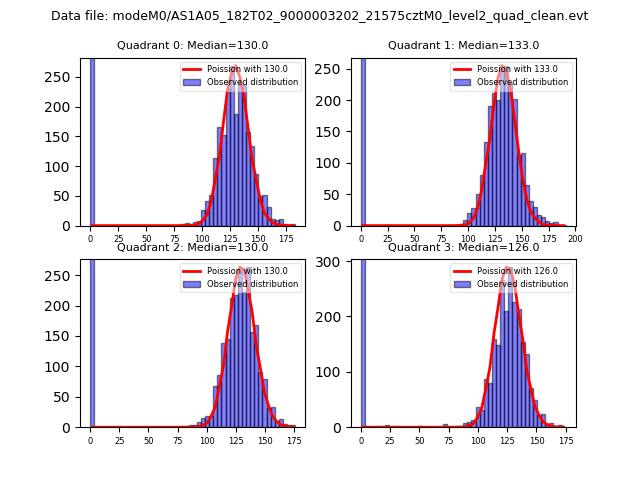 |
 |
| Quadrant-wise count rates Data is divided into 100 sec bins |
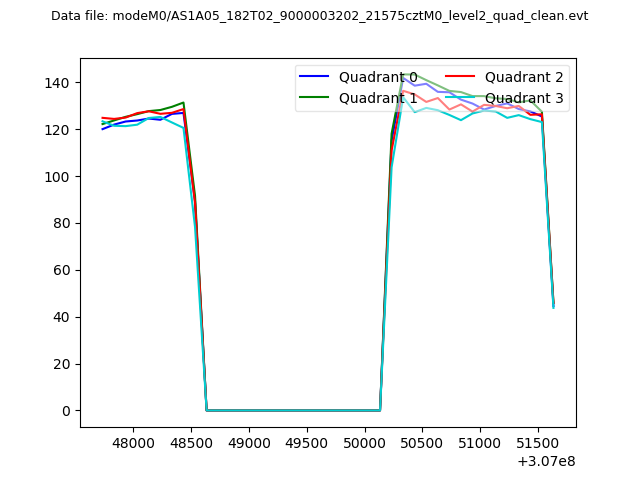 |
|
| Module-wise count rates for Quadrant A Data is divided into 100 sec bins |
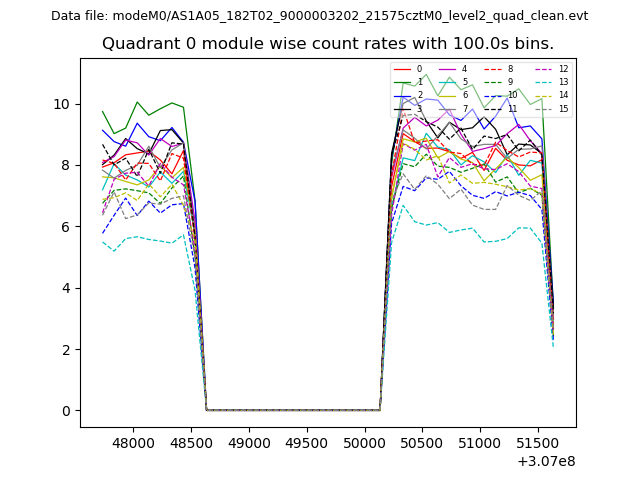 |
 |
| Module-wise count rates for Quadrant B Data is divided into 100 sec bins |
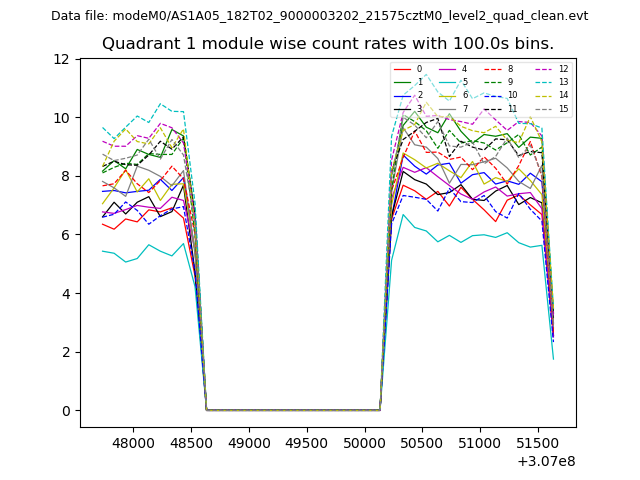 |
 |
| Module-wise count rates for Quadrant C Data is divided into 100 sec bins |
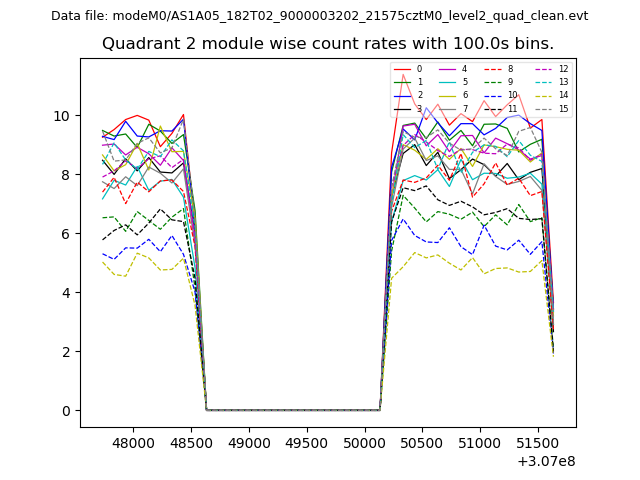 |
 |
| Module-wise count rates for Quadrant D Data is divided into 100 sec bins |
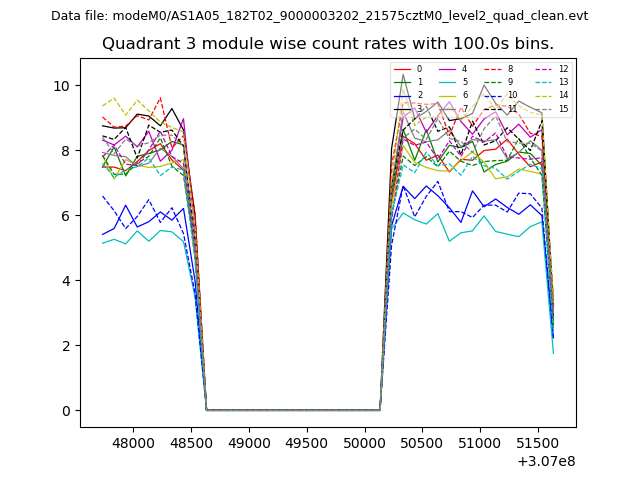 |
 |
| Parameter | Plot |
|---|---|
| CZT HV Monitor | 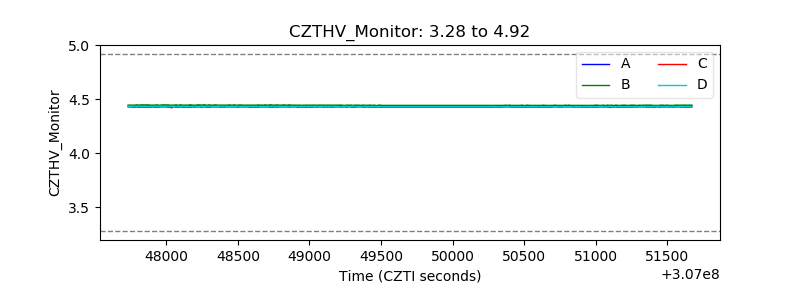 |
| D_VDD | 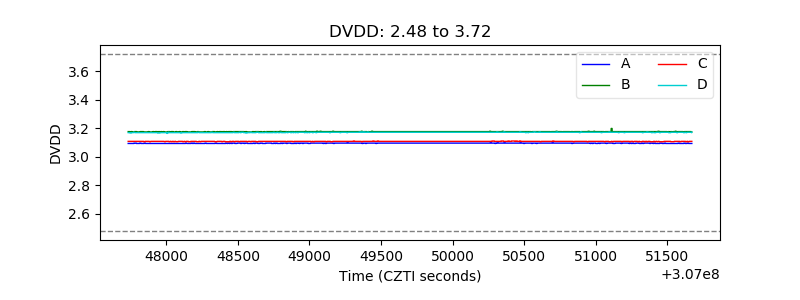 |
| Temperature 1 | 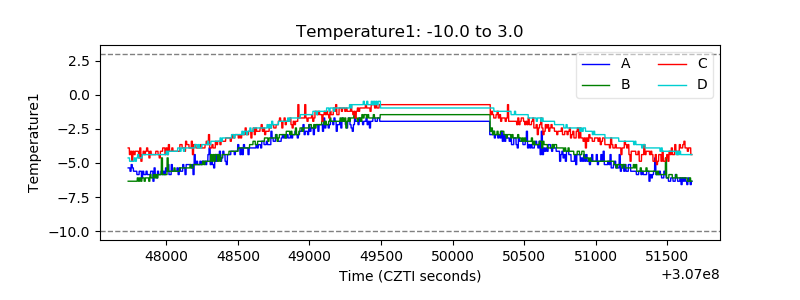 |
| Veto HV Monitor | 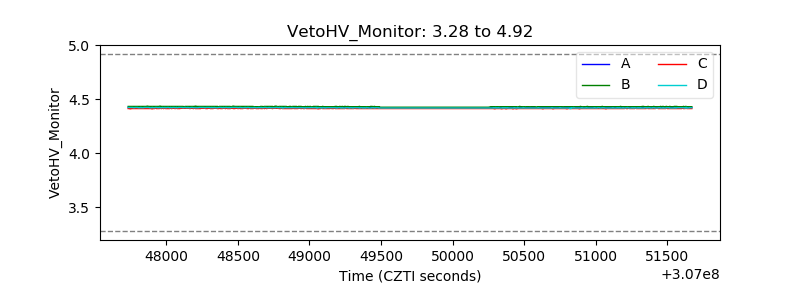 |
| Veto LLD | 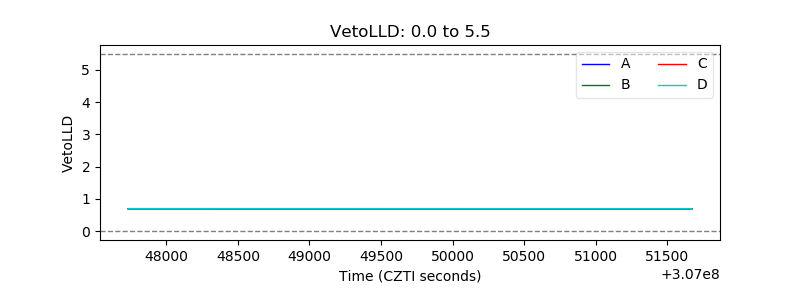 |
| Alpha Counter | 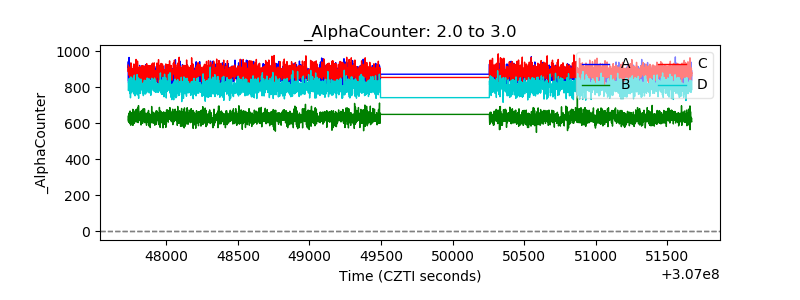 |
| _CPM_Rate | 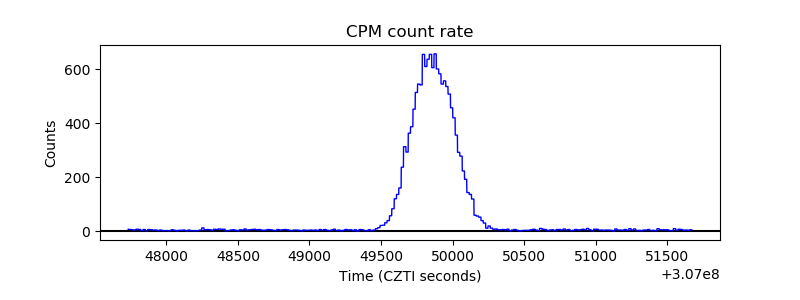 |
| CZT Counter | 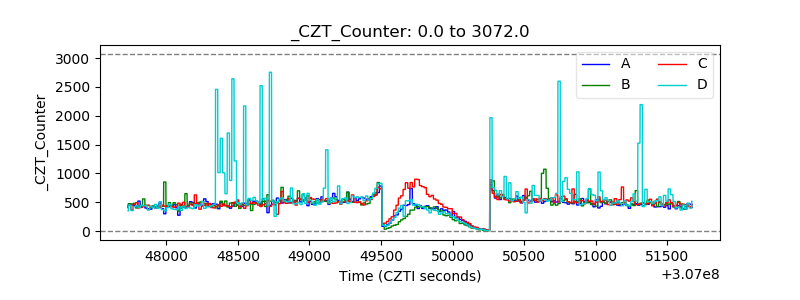 |
| +2.5 Volts monitor |  |
| +5 Volts monitor |  |
| _ROLL_ROT | 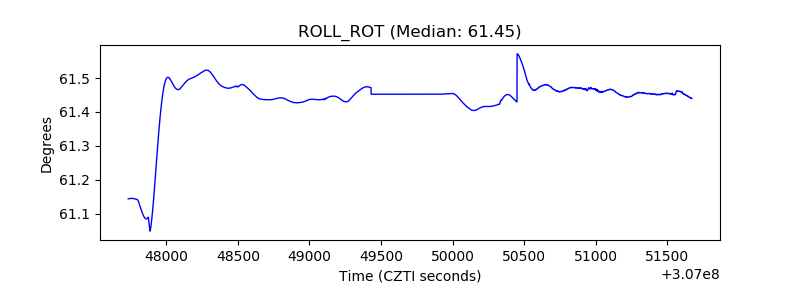 |
| _Roll_DEC | 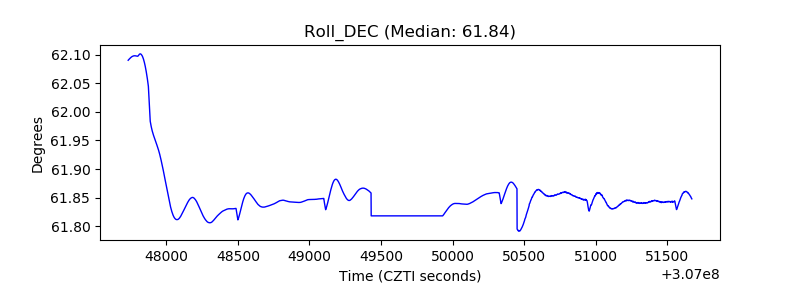 |
| _Roll_RA | 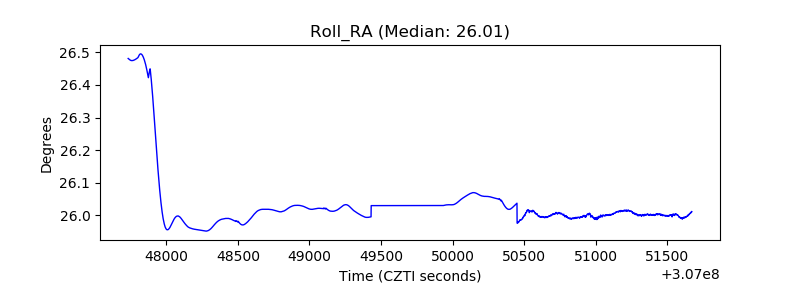 |
| Veto Counter | 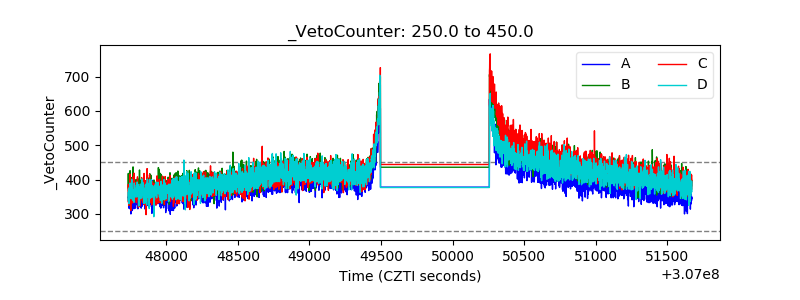 |