| Param | Original file | Final file |
|---|---|---|
| Filename | modeM0/AS1A05_182T02_9000003202_21576cztM0_level2.evt | modeM0/AS1A05_182T02_9000003202_21576cztM0_level2_quad_clean.evt |
| Size (bytes) | 472,032,000 | 110,073,600 |
| Size | 450.2 MB | 105.0 MB |
| Events in quadrant A | 3,275,448 | 710,963 |
| Events in quadrant B | 3,427,264 | 725,567 |
| Events in quadrant C | 3,357,151 | 714,006 |
| Events in quadrant D | 3,756,603 | 692,180 |
| Mode M9 | |||
|---|---|---|---|
| Quadrant | BADHDUFLAG | Total packets | Discarded packets |
| A | 0 | 17 | 0 |
| B | 0 | 17 | 0 |
| C | 0 | 17 | 0 |
| D | 0 | 17 | 0 |
| Mode M0 | |||
|---|---|---|---|
| Quadrant | BADHDUFLAG | Total packets | Discarded packets |
| A | 0 | 14472 | 2 |
| B | 0 | 14877 | 3 |
| C | 0 | 14601 | 2 |
| D | 0 | 16111 | 2 |
| Mode SS | |||
|---|---|---|---|
| Quadrant | BADHDUFLAG | Total packets | Discarded packets |
| A | 0 | 146 | 0 |
| B | 0 | 146 | 0 |
| C | 0 | 146 | 0 |
| D | 0 | 146 | 0 |
| Quadrant | Total seconds | Saturated seconds | Saturation percentage |
|---|---|---|---|
| A | 7048 | 50 | 0.709421% |
| B | 7047 | 86 | 1.220377% |
| C | 7047 | 112 | 1.589329% |
| D | 7048 | 106 | 1.503973% |
Noise dominated data is calculated using 1-second bins in cleaned event files. If a bin has >2000 counts, and if more than 50% of those come from <1% of pixels, then it is considered to be noise-dominated and hence unusable.
| Quadrant | # 1 sec bins | Bins with >0 counts | Bins with >2000 counts | High rate bins dominated by noise | Noise dominated (total time) | Noise dominated (detector-on time) | Marked lightcurve |
|---|---|---|---|---|---|---|---|
| A | 8748 | 7050 | 0 | 0 | 0.00% | 0.00% | 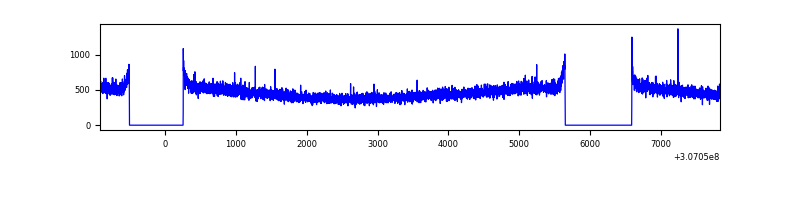 |
| B | 8747 | 7049 | 4 | 4 | 0.05% | 0.06% | 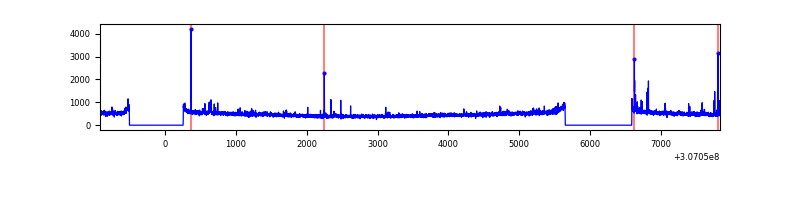 |
| C | 8747 | 7049 | 0 | 0 | 0.00% | 0.00% | 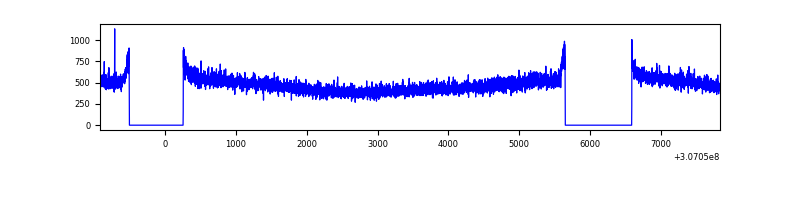 |
| D | 8748 | 7050 | 41 | 41 | 0.47% | 0.58% | 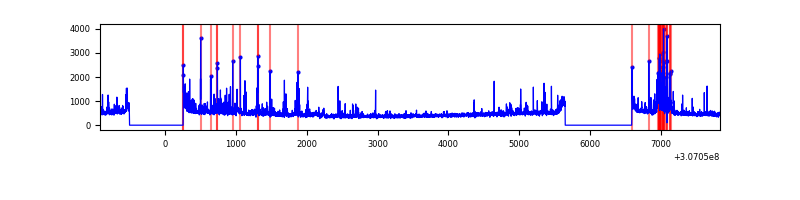 |
Top three noisy pixels from each quadrant. If the there are fewer than three noisy pixels in the level2.evt file, extra rows are filled as -1
| Pixel properties | Quadrant properties | ||||||
|---|---|---|---|---|---|---|---|
| Quadrant | DetID | PixID | Counts | Sigma | Mean | Median | Sigma |
| A | 13 | 254 | 9760 | 52.41 | 848 | 829 | 170.4 |
| A | 0 | 226 | 7324 | 38.11 | 848 | 829 | 170.4 |
| A | 3 | 137 | 7081 | 36.69 | 848 | 829 | 170.4 |
| B | 0 | 230 | 30327 | 182.25 | 849 | 826 | 161.9 |
| B | 3 | 64 | 28795 | 172.79 | 849 | 826 | 161.9 |
| B | 0 | 190 | 20447 | 121.21 | 849 | 826 | 161.9 |
| C | 14 | 238 | 130286 | 668.81 | 826 | 827 | 193.6 |
| C | 3 | 233 | 8141 | 37.79 | 826 | 827 | 193.6 |
| C | 13 | 61 | 5770 | 25.54 | 826 | 827 | 193.6 |
| D | 1 | 52 | 290939 | 1458.17 | 831 | 803 | 199.0 |
| D | 13 | 153 | 121205 | 605.12 | 831 | 803 | 199.0 |
| D | 13 | 104 | 71515 | 355.38 | 831 | 803 | 199.0 |
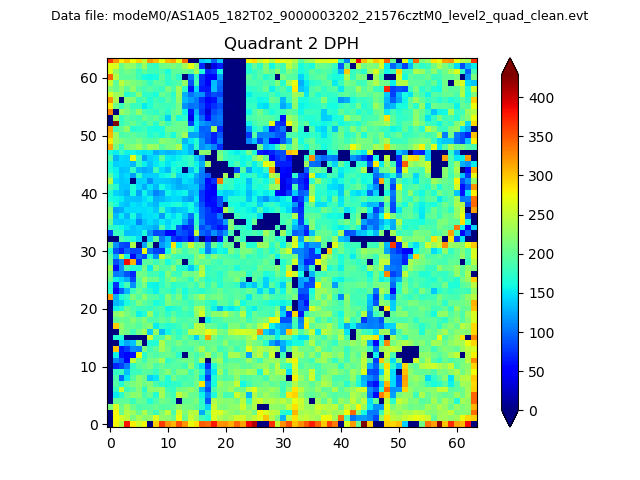
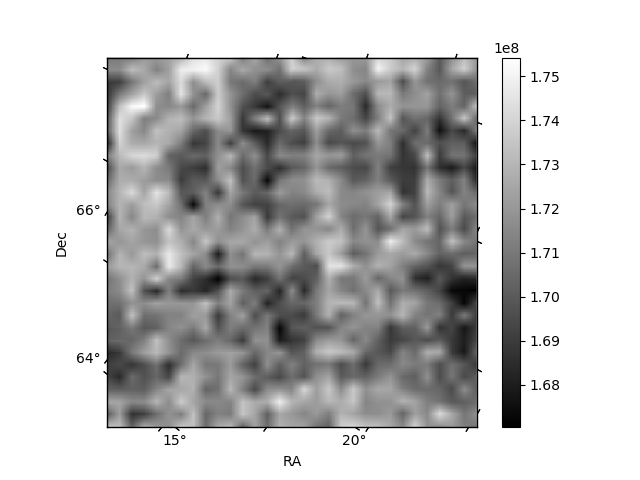
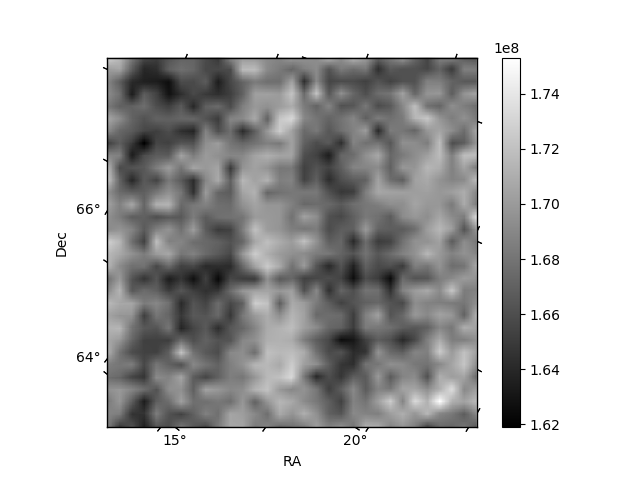
Histogram calculated using DETX and DETY for each event in the final _common_clean file
| Quadrant A |  |
 |
Quadrant B |
|---|---|---|---|
| Quadrant D | 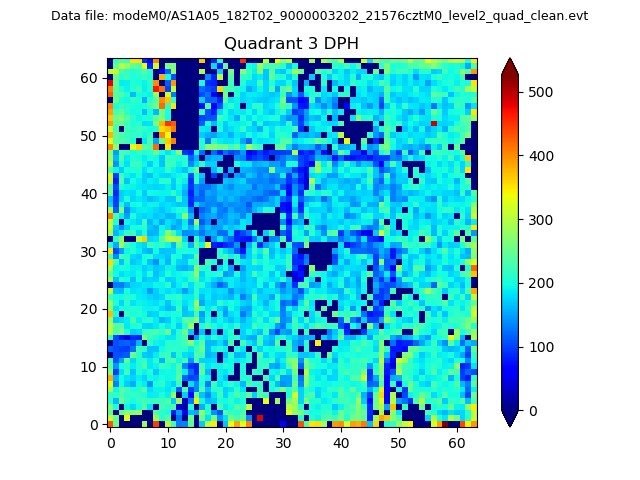 |
 |
Quadrant C |
| Plot type | Count rate plots | Images |
|---|---|---|
| Comparison with Poisson distribution Blue bars denote a histogram of data divided into 1 sec bins. Red curve is a Poisson curve with rate = median count rate of data. |
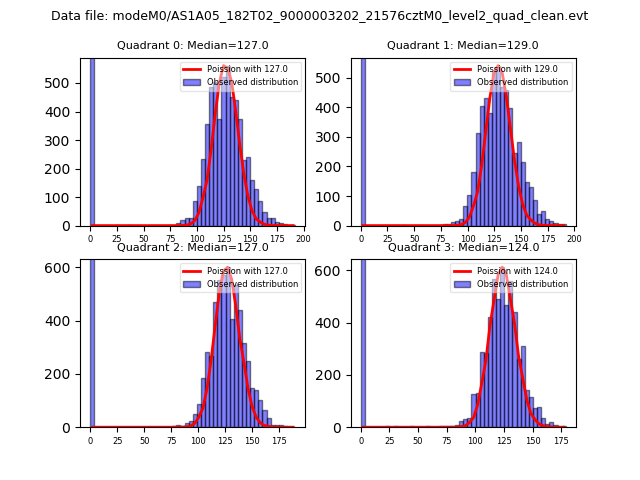 |
 |
| Quadrant-wise count rates Data is divided into 100 sec bins |
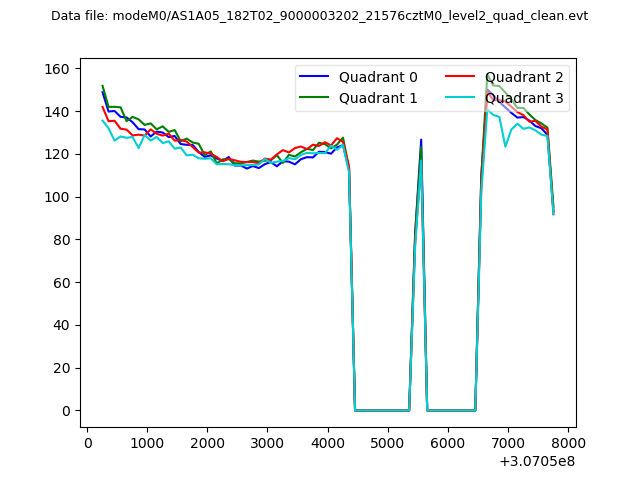 |
|
| Module-wise count rates for Quadrant A Data is divided into 100 sec bins |
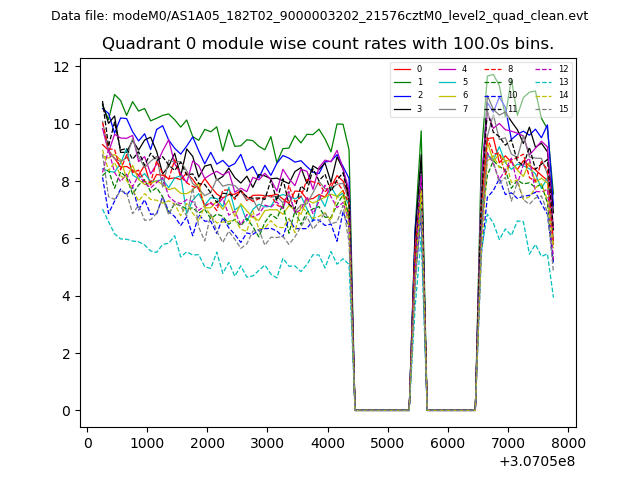 |
 |
| Module-wise count rates for Quadrant B Data is divided into 100 sec bins |
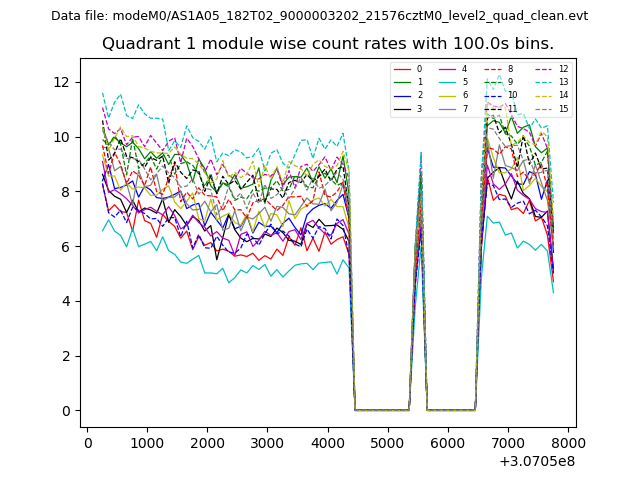 |
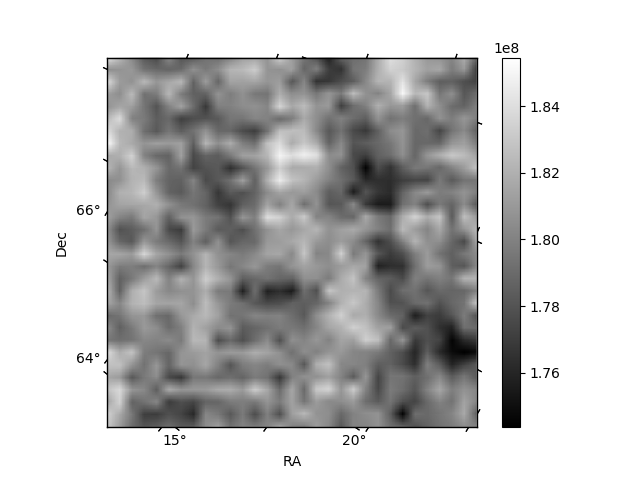 |
| Module-wise count rates for Quadrant C Data is divided into 100 sec bins |
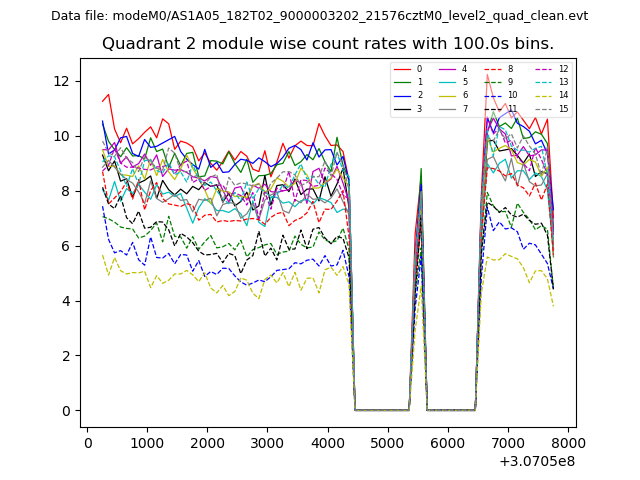 |
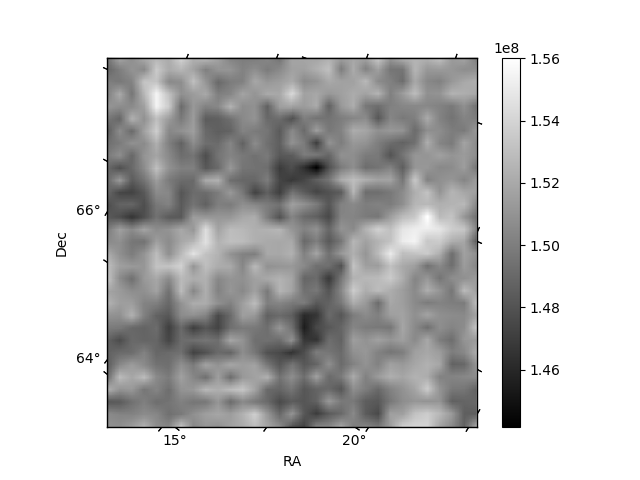 |
| Module-wise count rates for Quadrant D Data is divided into 100 sec bins |
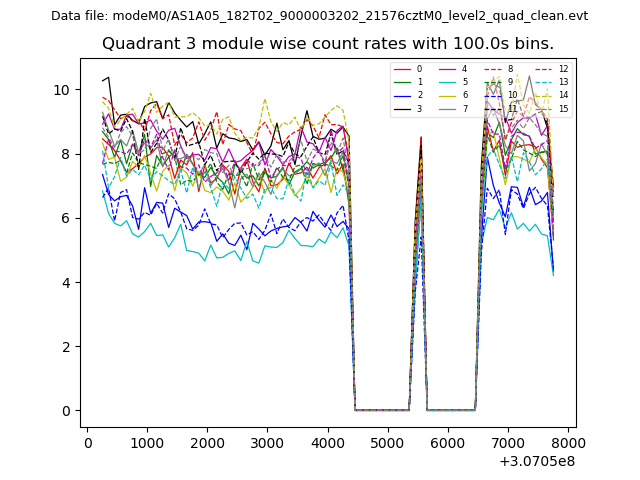 |
 |
| Parameter | Plot |
|---|---|
| CZT HV Monitor | 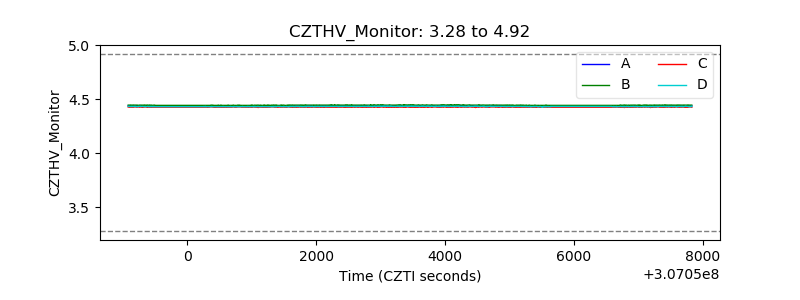 |
| D_VDD | 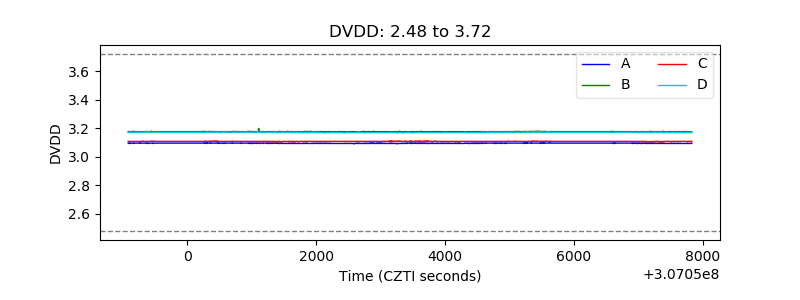 |
| Temperature 1 | 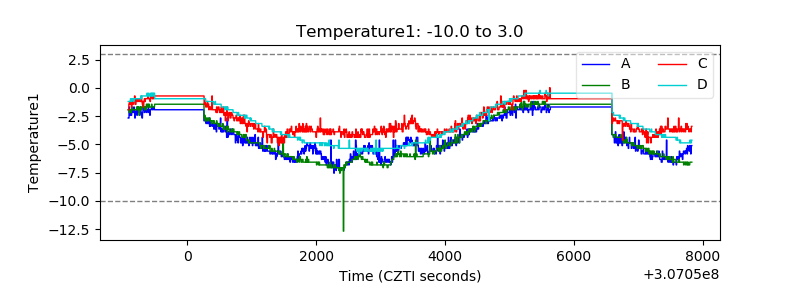 |
| Veto HV Monitor | 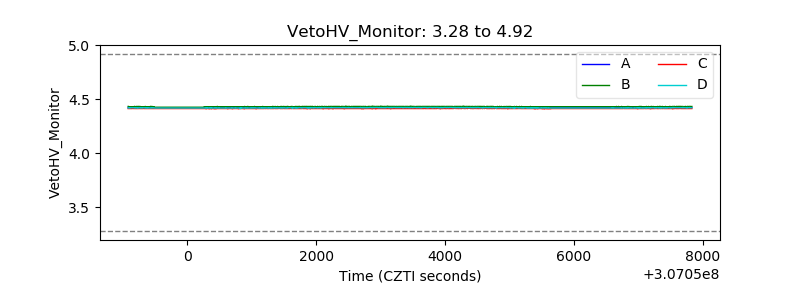 |
| Veto LLD | 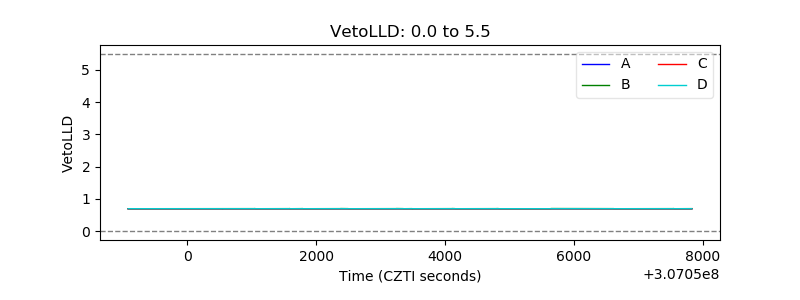 |
| Alpha Counter | 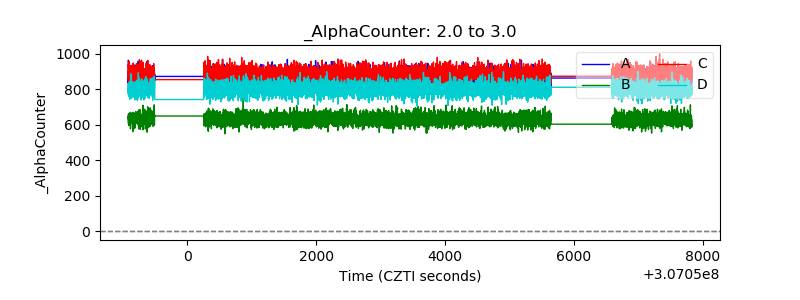 |
| _CPM_Rate | 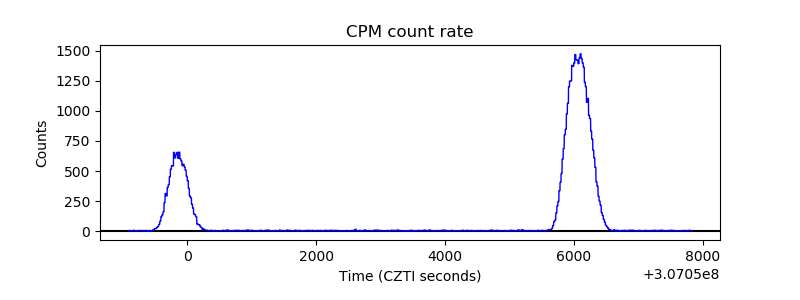 |
| CZT Counter |  |
| +2.5 Volts monitor |  |
| +5 Volts monitor |  |
| _ROLL_ROT | 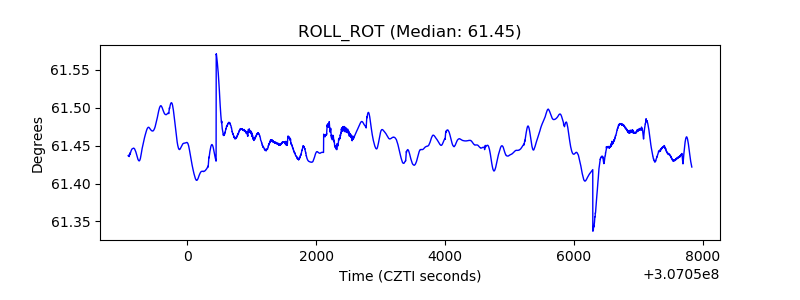 |
| _Roll_DEC | 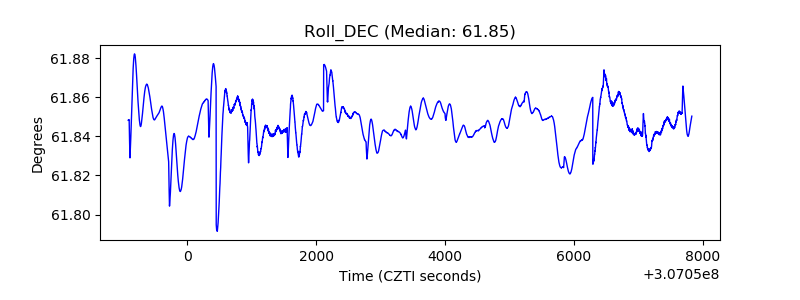 |
| _Roll_RA |  |
| Veto Counter | 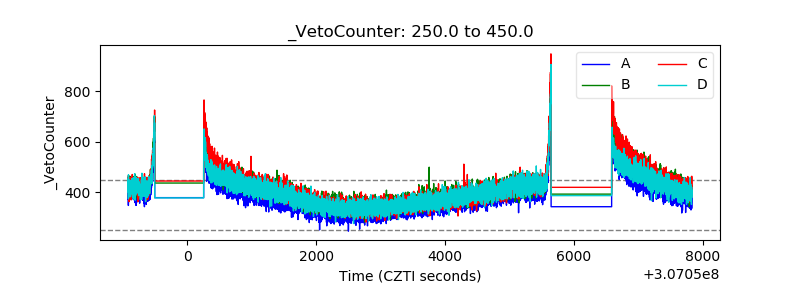 |