| Param | Original file | Final file |
|---|---|---|
| Filename | modeM0/AS1A05_182T02_9000003202_21579cztM0_level2.evt | modeM0/AS1A05_182T02_9000003202_21579cztM0_level2_quad_clean.evt |
| Size (bytes) | 387,247,680 | 97,764,480 |
| Size | 369.3 MB | 93.2 MB |
| Events in quadrant A | 2,684,617 | 643,166 |
| Events in quadrant B | 2,791,993 | 663,644 |
| Events in quadrant C | 2,742,972 | 642,528 |
| Events in quadrant D | 3,123,610 | 616,247 |
| Mode M9 | |||
|---|---|---|---|
| Quadrant | BADHDUFLAG | Total packets | Discarded packets |
| A | 0 | 17 | 0 |
| B | 0 | 18 | 0 |
| C | 0 | 18 | 0 |
| D | 0 | 18 | 0 |
| Mode M0 | |||
|---|---|---|---|
| Quadrant | BADHDUFLAG | Total packets | Discarded packets |
| A | 0 | 11757 | 2 |
| B | 0 | 12040 | 2 |
| C | 0 | 11915 | 2 |
| D | 0 | 13197 | 2 |
| Mode SS | |||
|---|---|---|---|
| Quadrant | BADHDUFLAG | Total packets | Discarded packets |
| A | 0 | 116 | 0 |
| B | 0 | 116 | 0 |
| C | 0 | 116 | 0 |
| D | 0 | 116 | 0 |
| Quadrant | Total seconds | Saturated seconds | Saturation percentage |
|---|---|---|---|
| A | 5648 | 20 | 0.354108% |
| B | 5648 | 37 | 0.655099% |
| C | 5648 | 65 | 1.150850% |
| D | 5648 | 88 | 1.558074% |
Noise dominated data is calculated using 1-second bins in cleaned event files. If a bin has >2000 counts, and if more than 50% of those come from <1% of pixels, then it is considered to be noise-dominated and hence unusable.
| Quadrant | # 1 sec bins | Bins with >0 counts | Bins with >2000 counts | High rate bins dominated by noise | Noise dominated (total time) | Noise dominated (detector-on time) | Marked lightcurve |
|---|---|---|---|---|---|---|---|
| A | 6853 | 5649 | 0 | 0 | 0.00% | 0.00% | 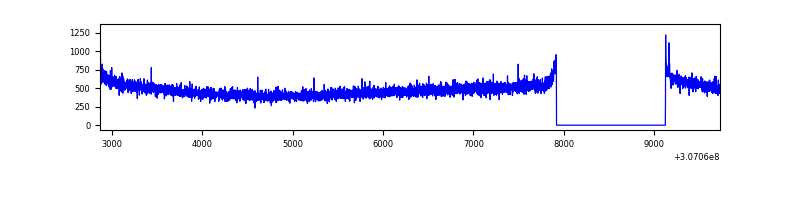 |
| B | 6853 | 5649 | 2 | 2 | 0.03% | 0.04% | 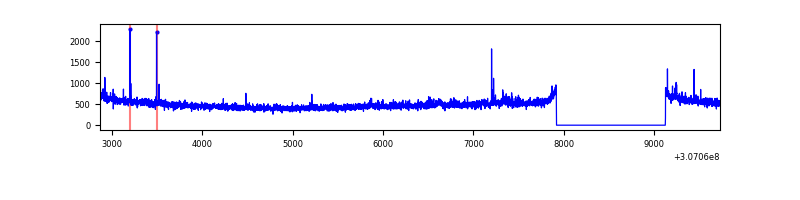 |
| C | 6853 | 5649 | 0 | 0 | 0.00% | 0.00% | 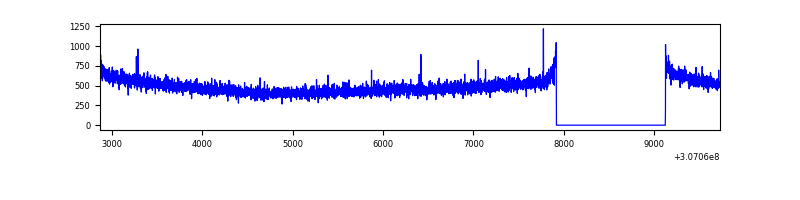 |
| D | 6853 | 5649 | 51 | 51 | 0.74% | 0.90% | 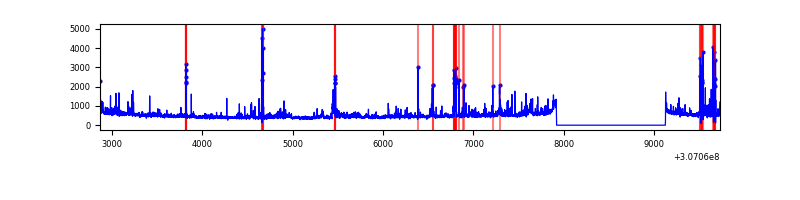 |
Top three noisy pixels from each quadrant. If the there are fewer than three noisy pixels in the level2.evt file, extra rows are filled as -1
| Pixel properties | Quadrant properties | ||||||
|---|---|---|---|---|---|---|---|
| Quadrant | DetID | PixID | Counts | Sigma | Mean | Median | Sigma |
| A | 13 | 254 | 8645 | 57.54 | 694 | 681 | 138.4 |
| A | 15 | 236 | 7093 | 46.33 | 694 | 681 | 138.4 |
| A | 0 | 226 | 5913 | 37.8 | 694 | 681 | 138.4 |
| B | 0 | 230 | 26497 | 196.51 | 699 | 682 | 131.4 |
| B | 12 | 111 | 15518 | 112.94 | 699 | 682 | 131.4 |
| B | 11 | 111 | 13291 | 95.98 | 699 | 682 | 131.4 |
| C | 14 | 238 | 108207 | 693.19 | 673 | 679 | 155.1 |
| C | 13 | 61 | 4894 | 27.17 | 673 | 679 | 155.1 |
| C | 3 | 233 | 3288 | 16.82 | 673 | 679 | 155.1 |
| D | 1 | 52 | 304151 | 1882.59 | 670 | 650 | 161.2 |
| D | 13 | 153 | 77015 | 473.69 | 670 | 650 | 161.2 |
| D | 2 | 136 | 68237 | 419.24 | 670 | 650 | 161.2 |
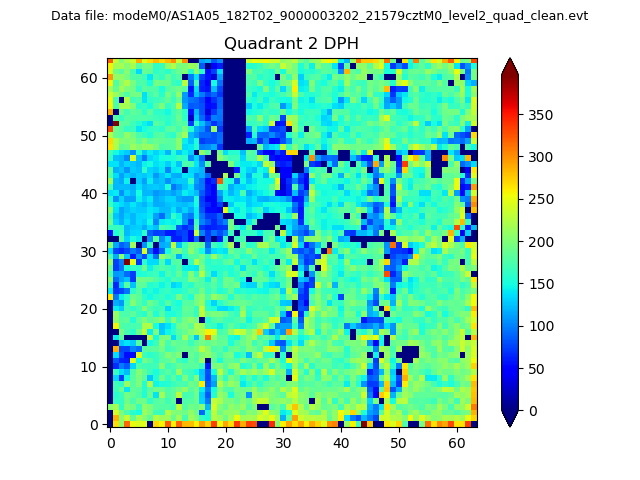
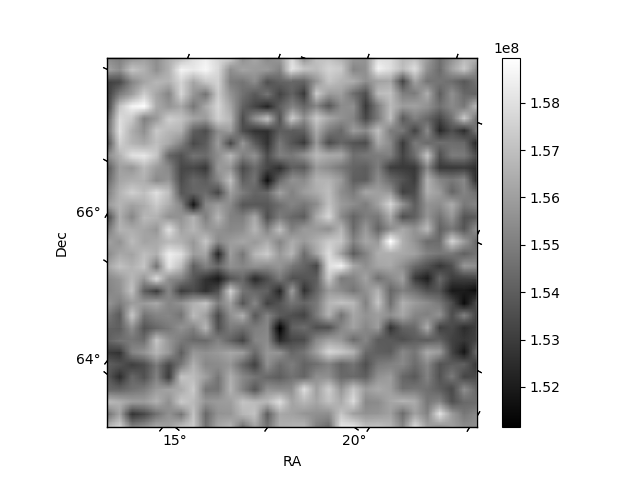
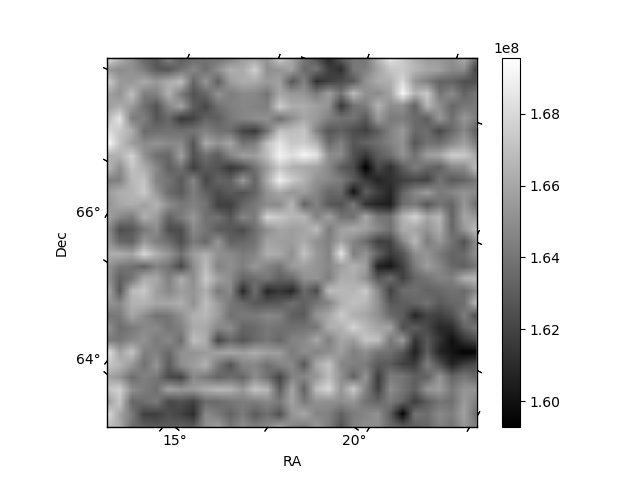
Histogram calculated using DETX and DETY for each event in the final _common_clean file
| Quadrant A | 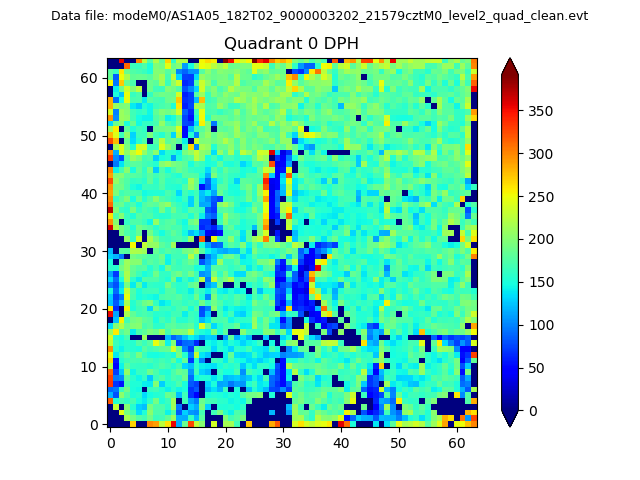 |
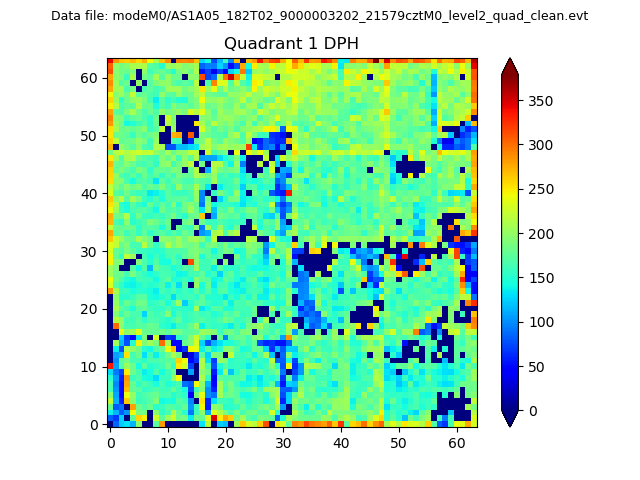 |
Quadrant B |
|---|---|---|---|
| Quadrant D | 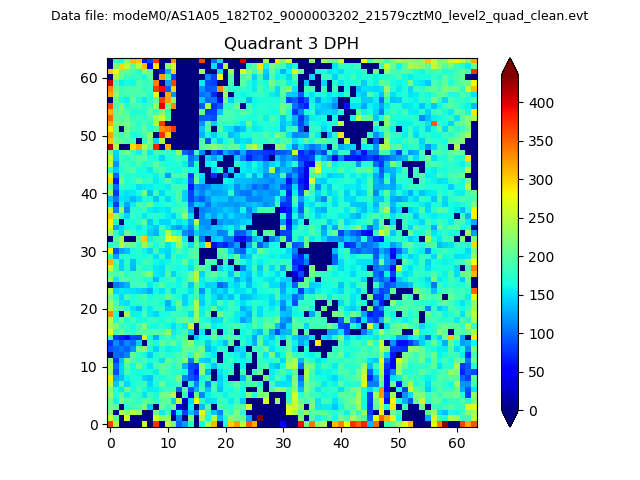 |
 |
Quadrant C |
| Plot type | Count rate plots | Images |
|---|---|---|
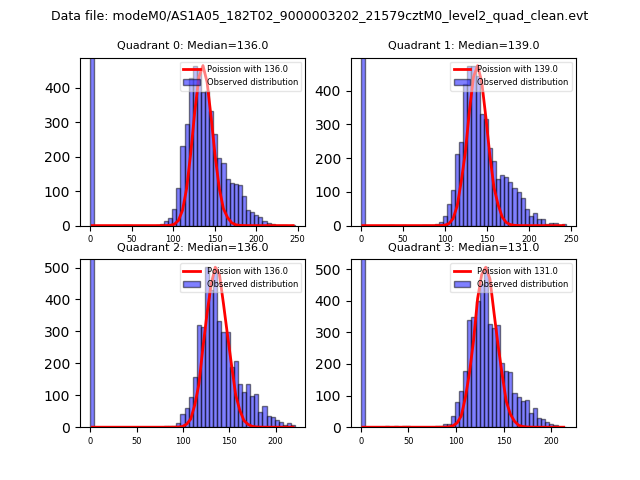
| Comparison with Poisson distribution Blue bars denote a histogram of data divided into 1 sec bins. Red curve is a Poisson curve with rate = median count rate of data. |
 |
 |
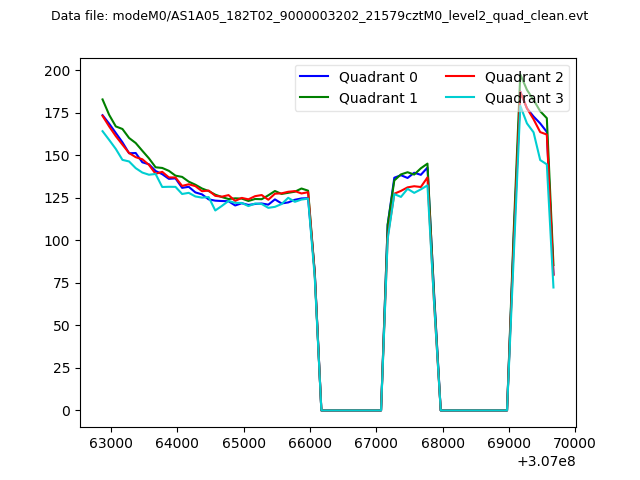
| Quadrant-wise count rates Data is divided into 100 sec bins |
 |
|
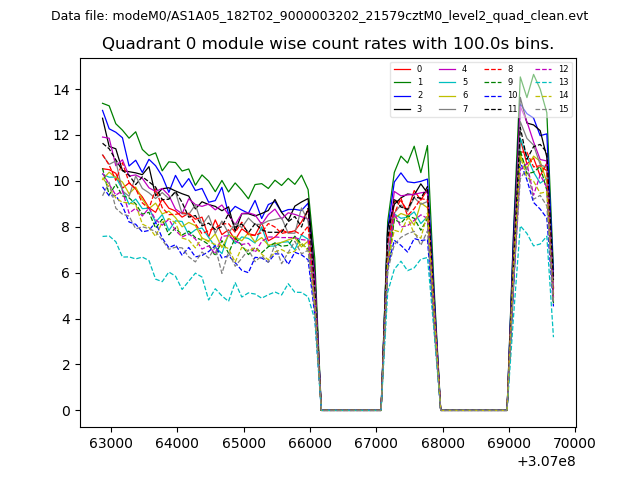
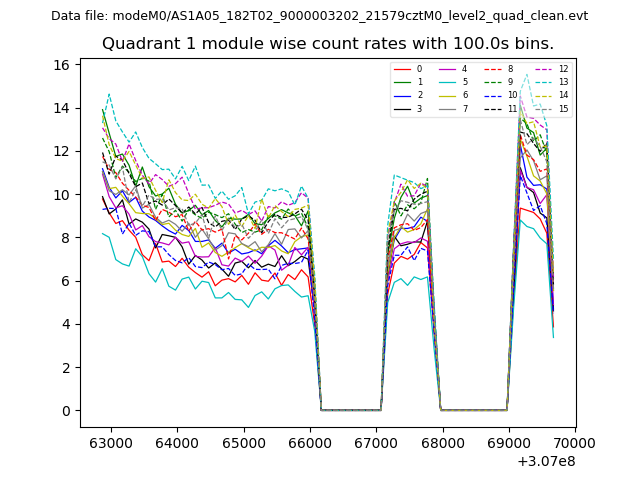
| Module-wise count rates for Quadrant A Data is divided into 100 sec bins |
 |
 |
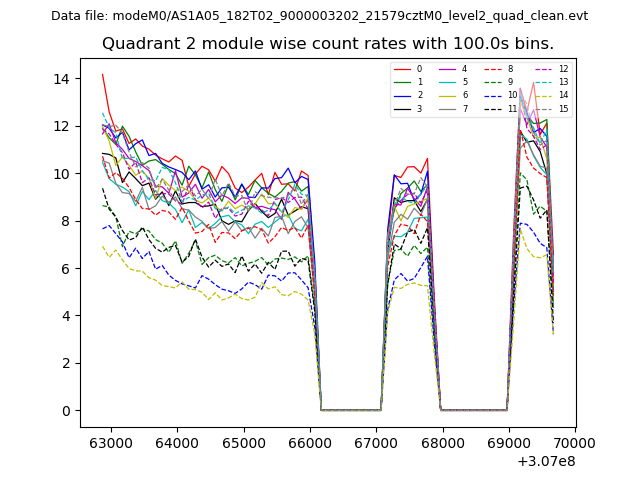
| Module-wise count rates for Quadrant B Data is divided into 100 sec bins |
 |
 |
| Module-wise count rates for Quadrant C Data is divided into 100 sec bins |
 |
 |
| Module-wise count rates for Quadrant D Data is divided into 100 sec bins |
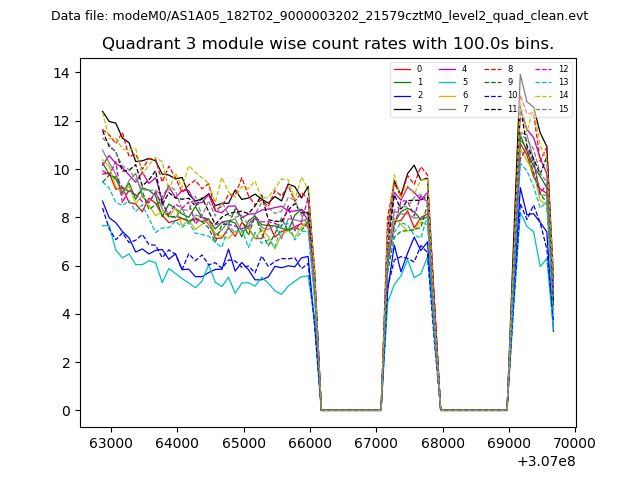 |
 |
| Parameter | Plot |
|---|---|
| CZT HV Monitor | 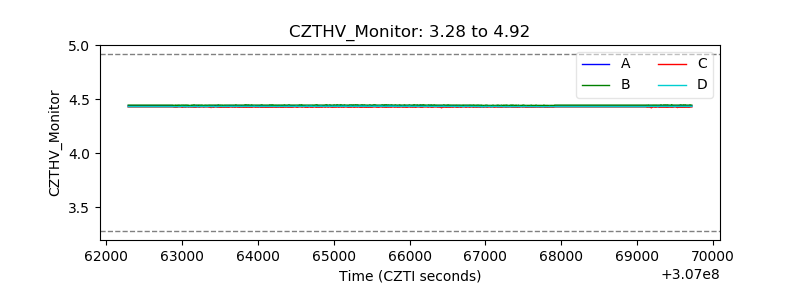 |
| D_VDD | 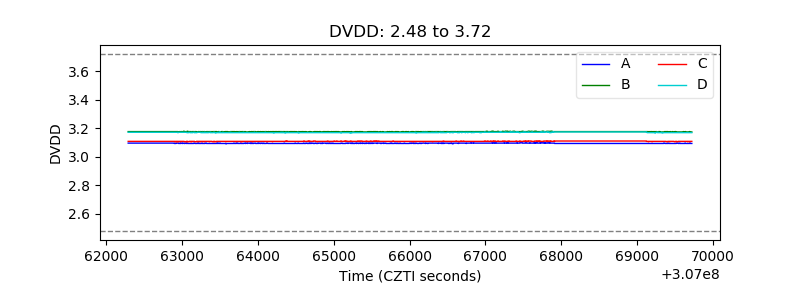 |
| Temperature 1 | 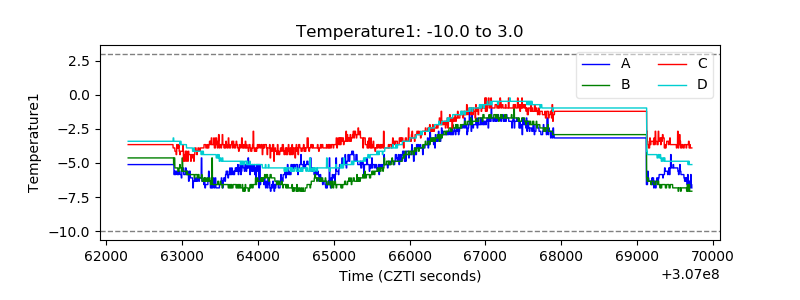 |
| Veto HV Monitor | 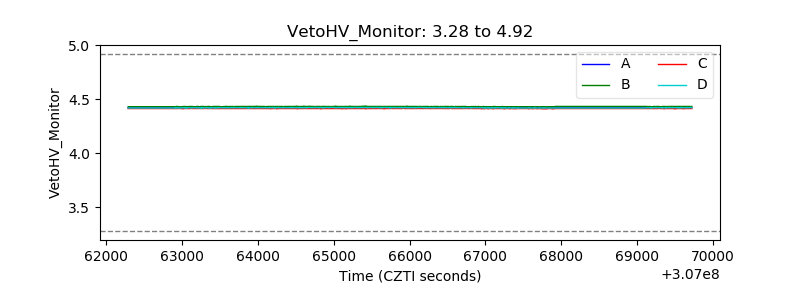 |
| Veto LLD | 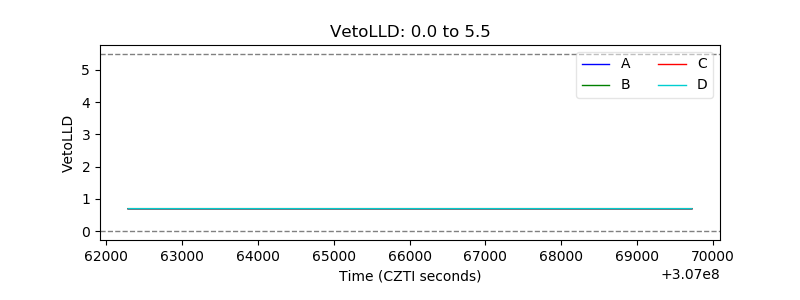 |
| Alpha Counter | 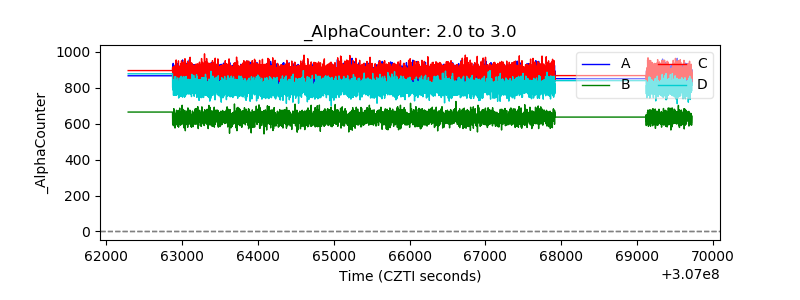 |
| _CPM_Rate | 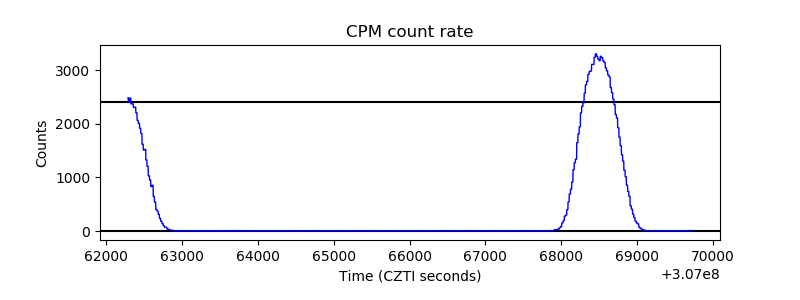 |
| CZT Counter | 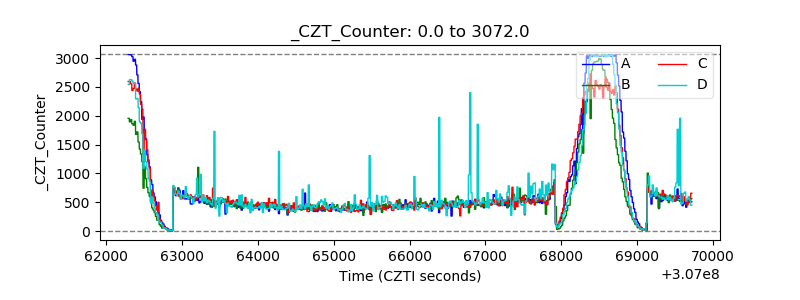 |
| +2.5 Volts monitor |  |
| +5 Volts monitor | 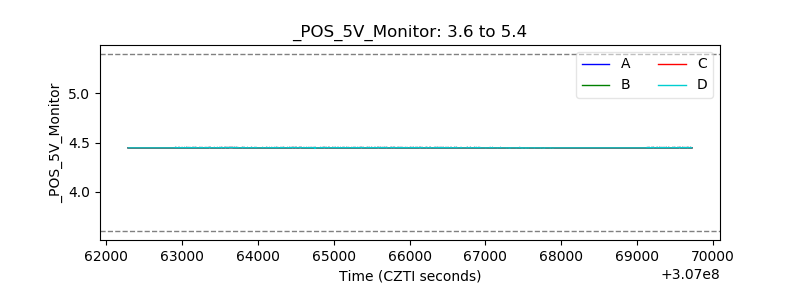 |
| _ROLL_ROT | 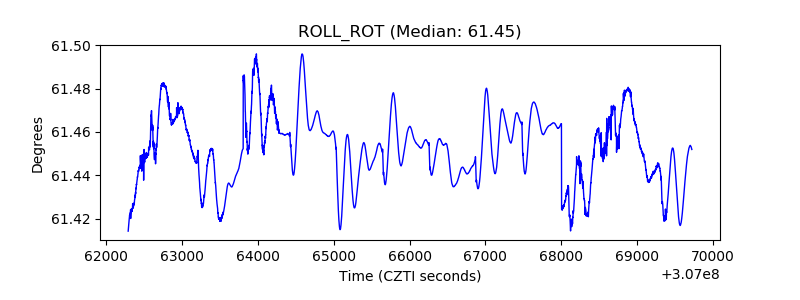 |
| _Roll_DEC | 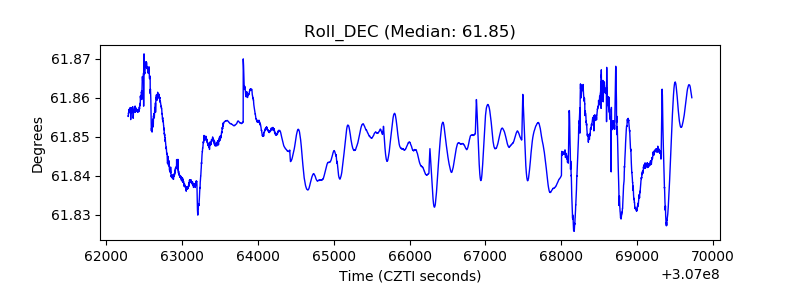 |
| _Roll_RA | 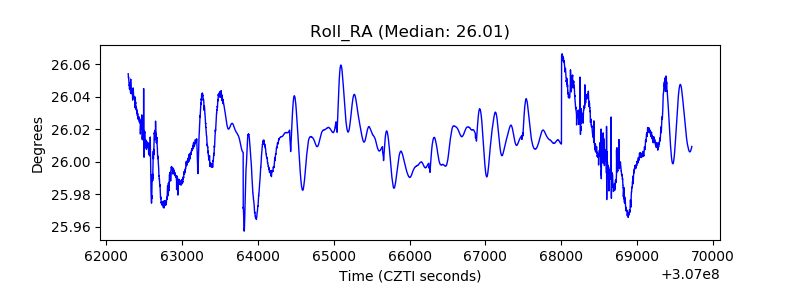 |
| Veto Counter | 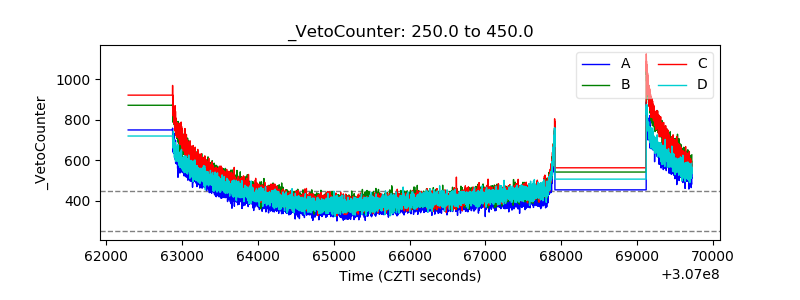 |