| Param | Original file | Final file |
|---|---|---|
| Filename | modeM0/AS1A05_182T02_9000003202_21580cztM0_level2.evt | modeM0/AS1A05_182T02_9000003202_21580cztM0_level2_quad_clean.evt |
| Size (bytes) | 50,834,880 | 15,431,040 |
| Size | 48.5 MB | 14.7 MB |
| Events in quadrant A | 346,232 | 105,066 |
| Events in quadrant B | 363,990 | 111,072 |
| Events in quadrant C | 358,581 | 103,806 |
| Events in quadrant D | 426,398 | 96,981 |
| Mode M9 | |||
|---|---|---|---|
| Quadrant | BADHDUFLAG | Total packets | Discarded packets |
| A | 0 | 6 | 0 |
| B | 0 | 7 | 0 |
| C | 0 | 7 | 0 |
| D | 0 | 7 | 0 |
| Mode M0 | |||
|---|---|---|---|
| Quadrant | BADHDUFLAG | Total packets | Discarded packets |
| A | 0 | 1407 | 1 |
| B | 0 | 1501 | 1 |
| C | 0 | 1476 | 1 |
| D | 0 | 1666 | 1 |
| Mode SS | |||
|---|---|---|---|
| Quadrant | BADHDUFLAG | Total packets | Discarded packets |
| A | 0 | 12 | 0 |
| B | 0 | 12 | 0 |
| C | 0 | 12 | 0 |
| D | 0 | 12 | 0 |
| Quadrant | Total seconds | Saturated seconds | Saturation percentage |
|---|---|---|---|
| A | 603 | 4 | 0.663350% |
| B | 603 | 5 | 0.829187% |
| C | 603 | 13 | 2.155887% |
| D | 603 | 28 | 4.643449% |
Noise dominated data is calculated using 1-second bins in cleaned event files. If a bin has >2000 counts, and if more than 50% of those come from <1% of pixels, then it is considered to be noise-dominated and hence unusable.
| Quadrant | # 1 sec bins | Bins with >0 counts | Bins with >2000 counts | High rate bins dominated by noise | Noise dominated (total time) | Noise dominated (detector-on time) | Marked lightcurve |
|---|---|---|---|---|---|---|---|
| A | 603 | 603 | 0 | 0 | 0.00% | 0.00% |  |
| B | 603 | 603 | 0 | 0 | 0.00% | 0.00% | 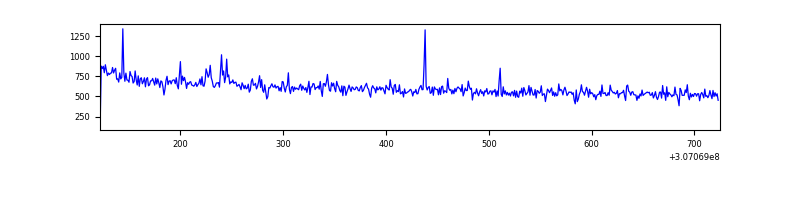 |
| C | 603 | 603 | 0 | 0 | 0.00% | 0.00% | 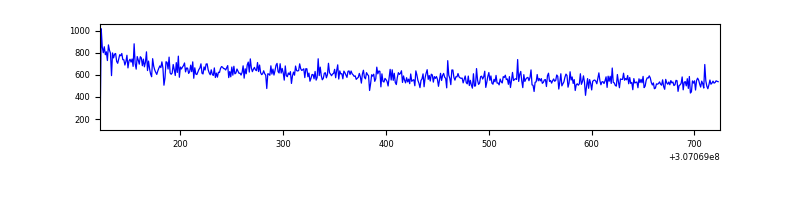 |
| D | 603 | 603 | 14 | 14 | 2.32% | 2.32% | 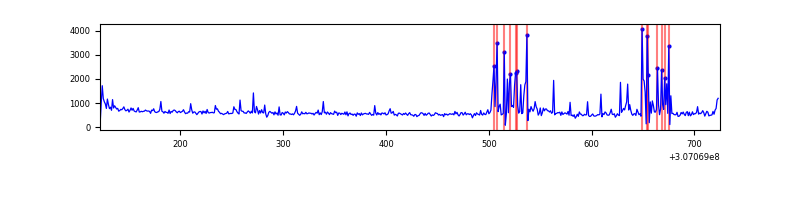 |
Top three noisy pixels from each quadrant. If the there are fewer than three noisy pixels in the level2.evt file, extra rows are filled as -1
| Pixel properties | Quadrant properties | ||||||
|---|---|---|---|---|---|---|---|
| Quadrant | DetID | PixID | Counts | Sigma | Mean | Median | Sigma |
| A | 15 | 236 | 2311 | 113.01 | 88 | 87 | 19.7 |
| A | 15 | 48 | 1365 | 64.94 | 88 | 87 | 19.7 |
| A | 13 | 254 | 812 | 36.84 | 88 | 87 | 19.7 |
| B | 0 | 230 | 3740 | 191.27 | 91 | 89 | 19.1 |
| B | 0 | 244 | 2902 | 147.37 | 91 | 89 | 19.1 |
| B | 12 | 111 | 1922 | 96.03 | 91 | 89 | 19.1 |
| C | 14 | 238 | 13979 | 628.97 | 87 | 88 | 22.1 |
| C | 13 | 61 | 629 | 24.5 | 87 | 88 | 22.1 |
| C | 0 | 239 | 619 | 24.04 | 87 | 88 | 22.1 |
| D | 1 | 52 | 92087 | 4104.74 | 84 | 81 | 22.4 |
| D | 2 | 120 | 4212 | 184.3 | 84 | 81 | 22.4 |
| D | 2 | 136 | 3830 | 167.26 | 84 | 81 | 22.4 |
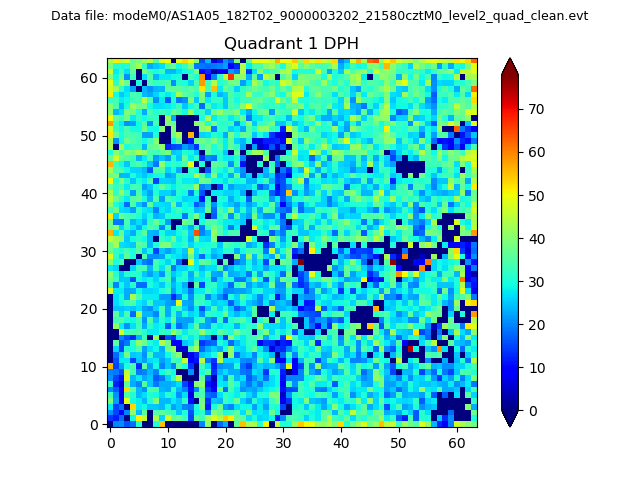
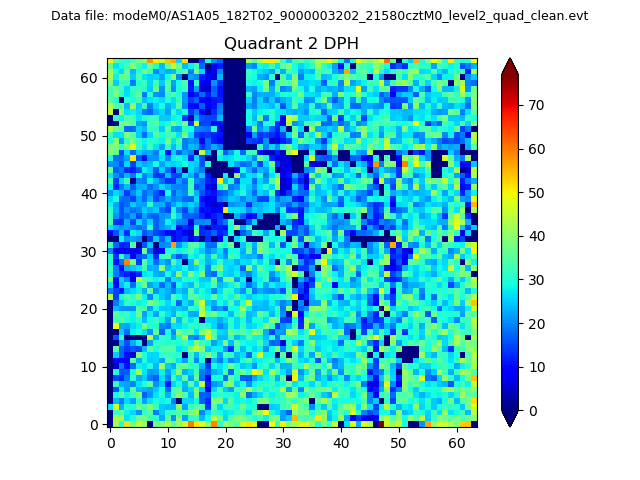
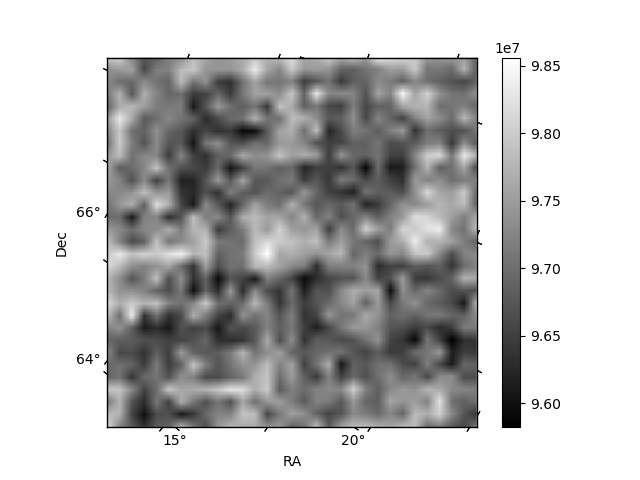
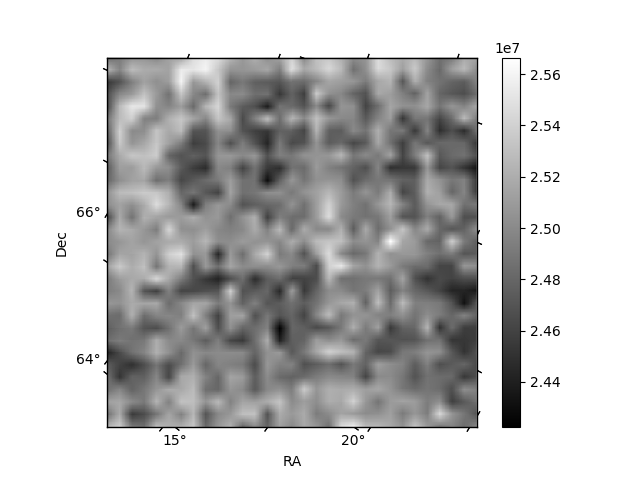
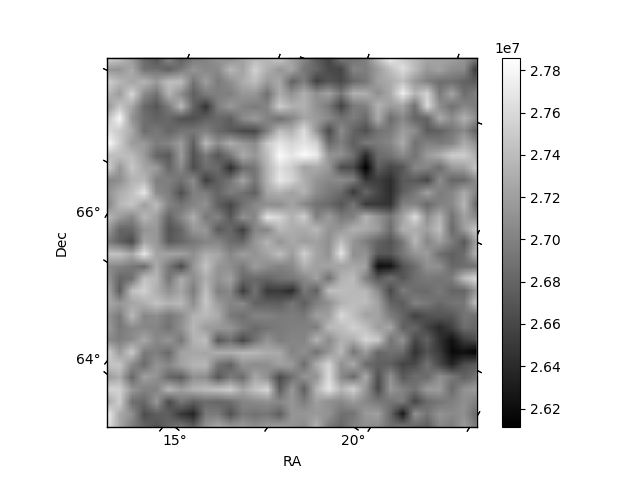
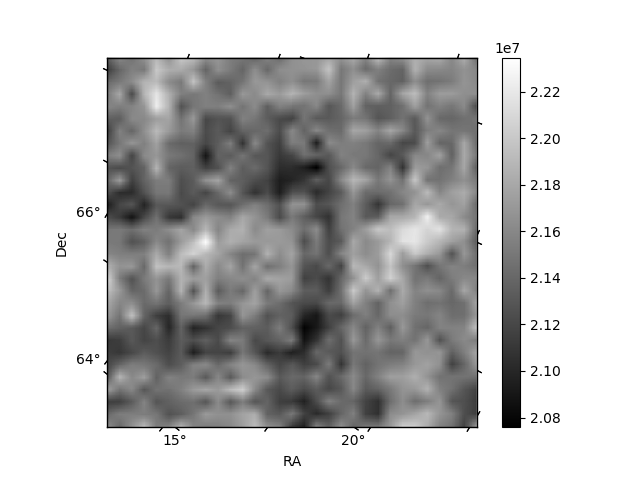
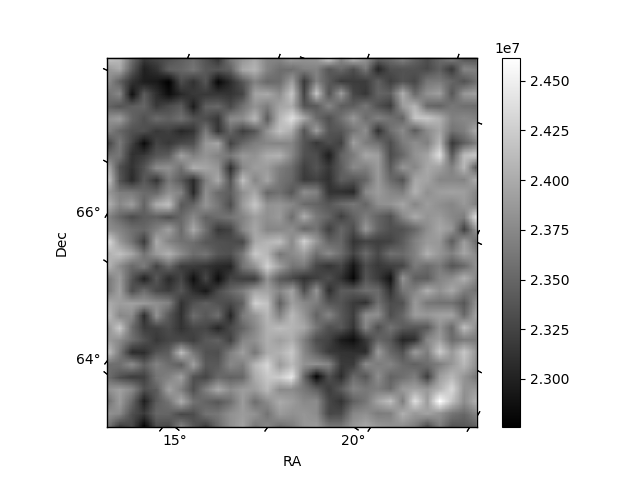
Histogram calculated using DETX and DETY for each event in the final _common_clean file
| Quadrant A | 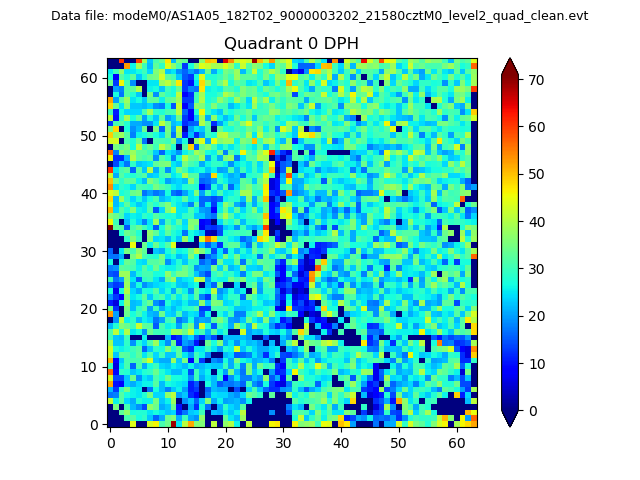 |
 |
Quadrant B |
|---|---|---|---|
| Quadrant D | 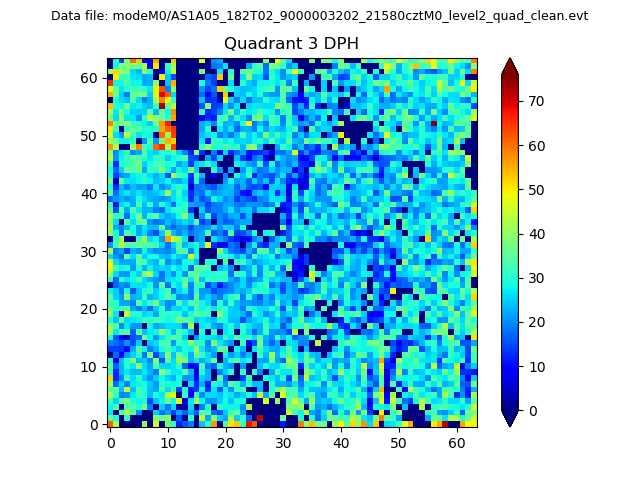 |
 |
Quadrant C |
| Plot type | Count rate plots | Images |
|---|---|---|
| Comparison with Poisson distribution Blue bars denote a histogram of data divided into 1 sec bins. Red curve is a Poisson curve with rate = median count rate of data. |
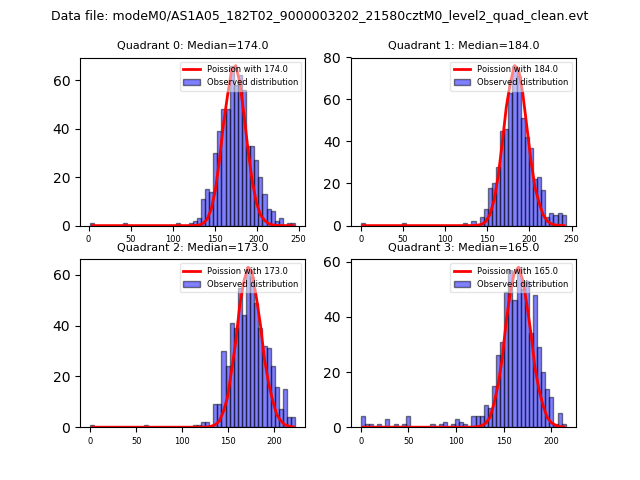 |
 |
| Quadrant-wise count rates Data is divided into 100 sec bins |
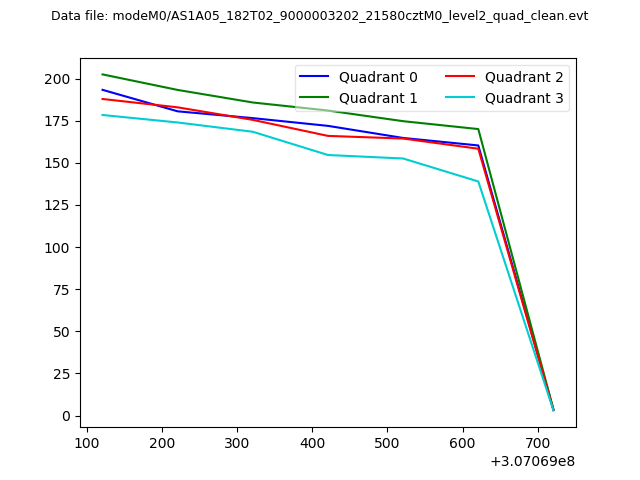 |
|
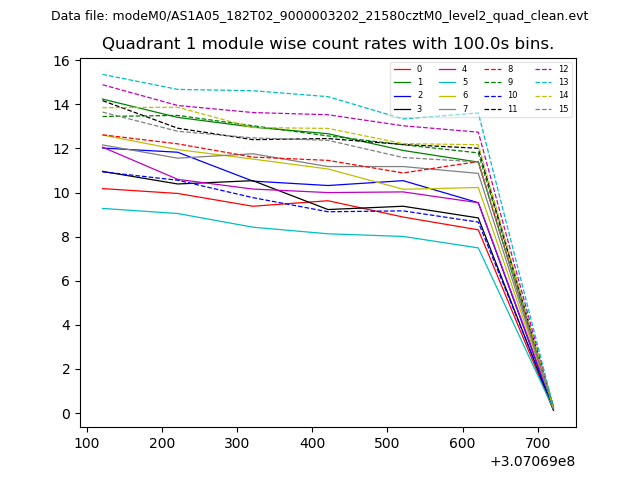
| Module-wise count rates for Quadrant A Data is divided into 100 sec bins |
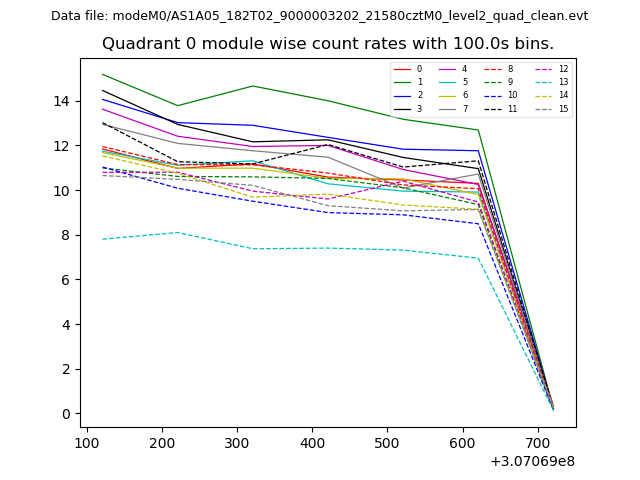 |
 |
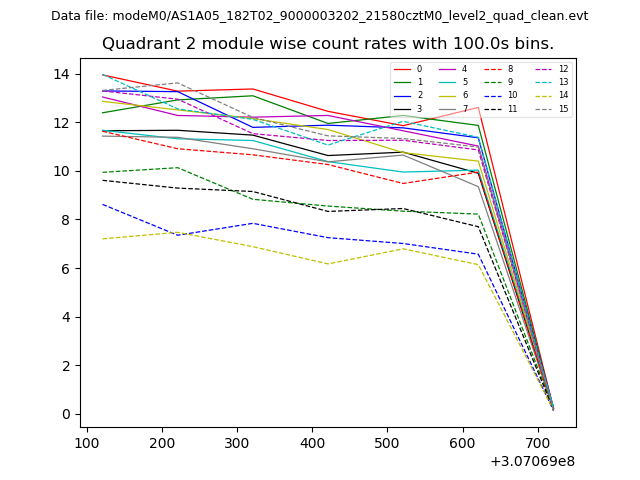
| Module-wise count rates for Quadrant B Data is divided into 100 sec bins |
 |
 |
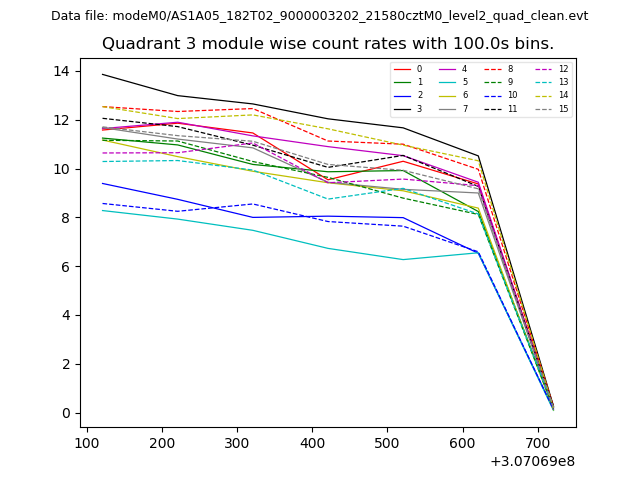
| Module-wise count rates for Quadrant C Data is divided into 100 sec bins |
 |
 |
| Module-wise count rates for Quadrant D Data is divided into 100 sec bins |
 |
 |
| Parameter | Plot |
|---|---|
| CZT HV Monitor | 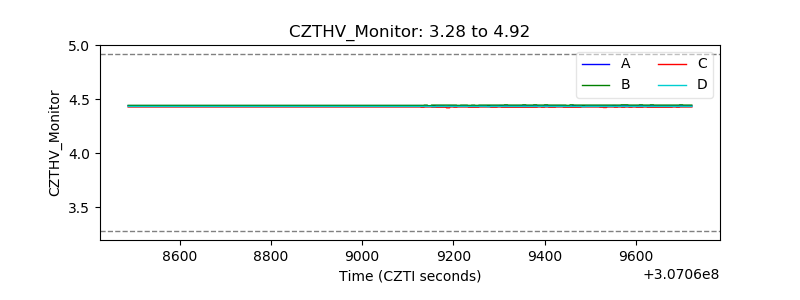 |
| D_VDD | 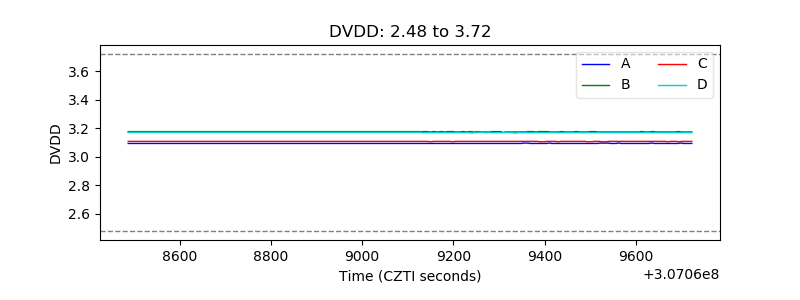 |
| Temperature 1 | 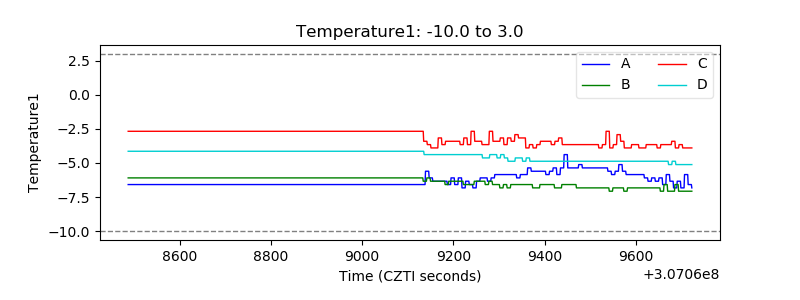 |
| Veto HV Monitor | 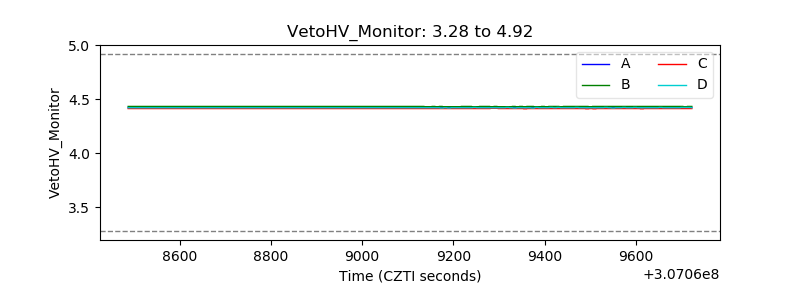 |
| Veto LLD | 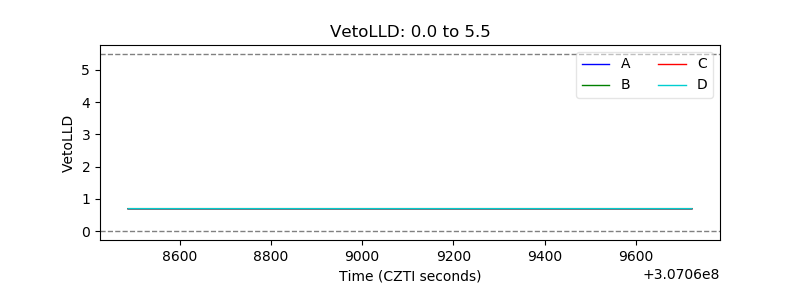 |
| Alpha Counter | 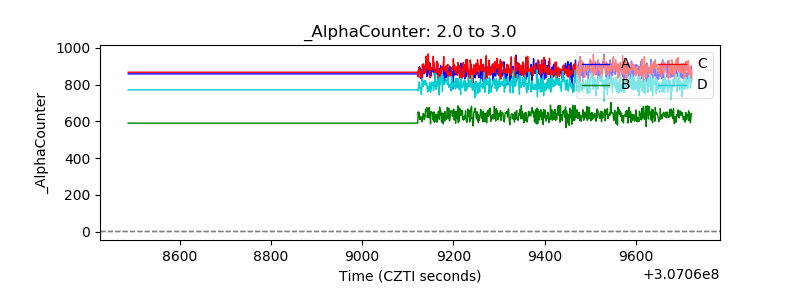 |
| _CPM_Rate | 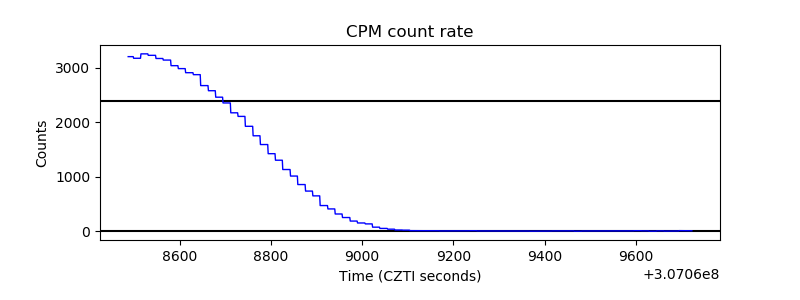 |
| CZT Counter | 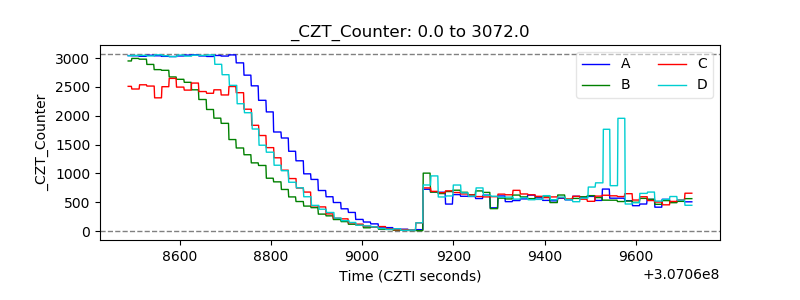 |
| +2.5 Volts monitor |  |
| +5 Volts monitor |  |
| _ROLL_ROT | 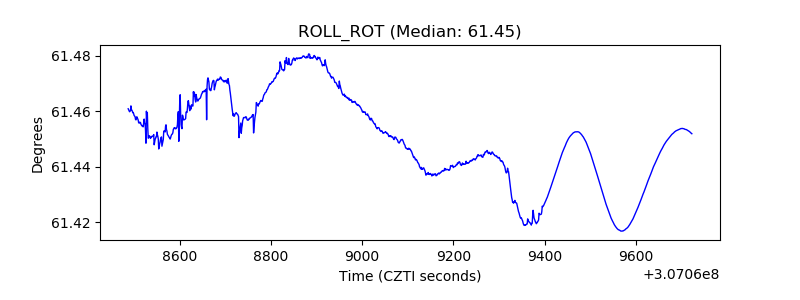 |
| _Roll_DEC | 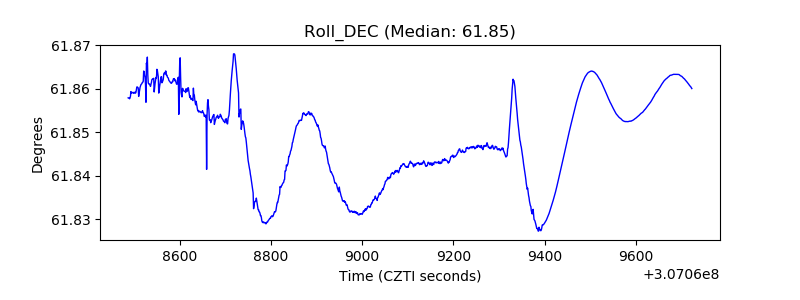 |
| _Roll_RA | 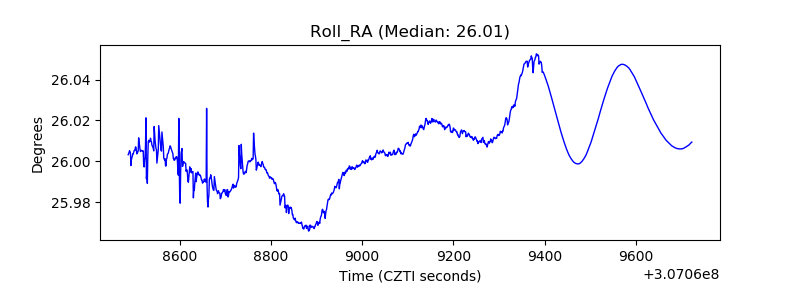 |
| Veto Counter | 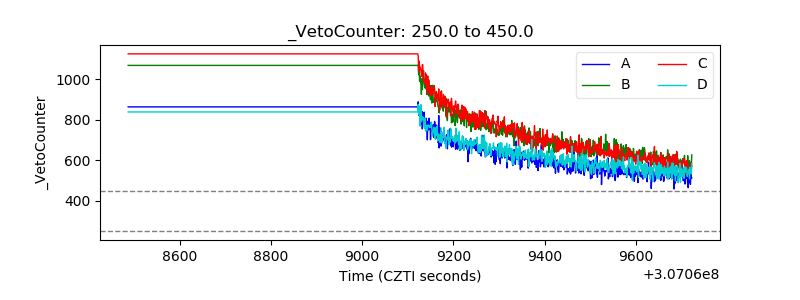 |