| Param | Original file | Final file |
|---|---|---|
| Filename | modeM0/AS1A06_009T03_9000003198cztM0_level2.fits | modeM0/AS1A06_009T03_9000003198cztM0_level2_quad_clean.evt |
| Size (bytes) | 111,098,880 | 46,137,600 |
| Size | 106.0 MB | 44.0 MB |
| Events in quadrant A | 718,140 | 192,645 |
| Events in quadrant B | 682,880 | 193,632 |
| Events in quadrant C | 695,760 | 184,357 |
| Events in quadrant D | 610,004 | 166,266 |
| Mode M9 | |||
|---|---|---|---|
| Quadrant | BADHDUFLAG | Total packets | Discarded packets |
| A | 0 | 23 | 0 |
| B | 0 | 23 | 0 |
| C | 0 | 23 | 0 |
| D | 0 | 23 | 0 |
| Mode M0 | |||
|---|---|---|---|
| Quadrant | BADHDUFLAG | Total packets | Discarded packets |
| A | 0 | 20424 | 0 |
| B | 0 | 21155 | 0 |
| C | 0 | 20877 | 0 |
| D | 0 | 23288 | 0 |
| Mode SS | |||
|---|---|---|---|
| Quadrant | BADHDUFLAG | Total packets | Discarded packets |
| A | 0 | 192 | 0 |
| B | 0 | 192 | 0 |
| C | 0 | 192 | 0 |
| D | 0 | 192 | 0 |
| Quadrant | Total seconds | Saturated seconds | Saturation percentage |
|---|---|---|---|
| A | 9497 | 33 | 0.347478% |
| B | 9497 | 61 | 0.642308% |
| C | 9497 | 127 | 1.337264% |
| D | 9497 | 130 | 1.368853% |
Noise dominated data is calculated using 1-second bins in cleaned event files. If a bin has >2000 counts, and if more than 50% of those come from <1% of pixels, then it is considered to be noise-dominated and hence unusable.
| Quadrant | # 1 sec bins | Bins with >0 counts | Bins with >2000 counts | High rate bins dominated by noise | Noise dominated (total time) | Noise dominated (detector-on time) | Marked lightcurve |
|---|---|---|---|---|---|---|---|
| A | 10851 | 9496 | 0 | 0 | 0.00% | 0.00% |  |
| B | 10851 | 9496 | 0 | 0 | 0.00% | 0.00% |  |
| C | 10851 | 9496 | 0 | 0 | 0.00% | 0.00% |  |
| D | 10851 | 9496 | 0 | 0 | 0.00% | 0.00% |  |
Top three noisy pixels from each quadrant. If the there are fewer than three noisy pixels in the level2.evt file, extra rows are filled as -1
| Pixel properties | Quadrant properties | ||||||
|---|---|---|---|---|---|---|---|
| Quadrant | DetID | PixID | Counts | Sigma | Mean | Median | Sigma |
| A | 0 | 29 | 641 | 9.9 | 187 | 177 | 46.9 |
| A | 7 | 110 | 552 | 8.0 | 187 | 177 | 46.9 |
| A | 9 | 19 | 505 | 7.0 | 187 | 177 | 46.9 |
| B | 2 | 9 | 508 | 8.92 | 181 | 175 | 37.3 |
| B | 5 | 128 | 428 | 6.78 | 181 | 175 | 37.3 |
| B | 2 | 8 | 427 | 6.75 | 181 | 175 | 37.3 |
| C | 1 | 80 | 509 | 7.07 | 183 | 175 | 47.2 |
| C | 7 | 111 | 495 | 6.78 | 183 | 175 | 47.2 |
| C | 3 | 158 | 479 | 6.44 | 183 | 175 | 47.2 |
| D | 7 | 3 | 419 | 5.46 | 174 | 161 | 47.2 |
| D | 6 | 231 | 417 | 5.42 | 174 | 161 | 47.2 |
| D | 15 | 46 | 416 | 5.4 | 174 | 161 | 47.2 |
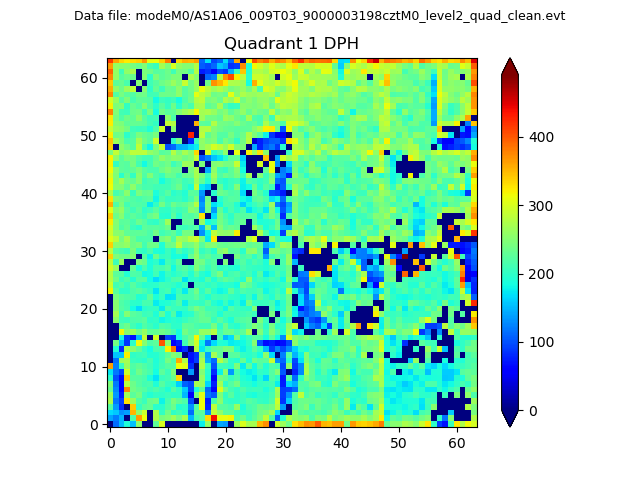
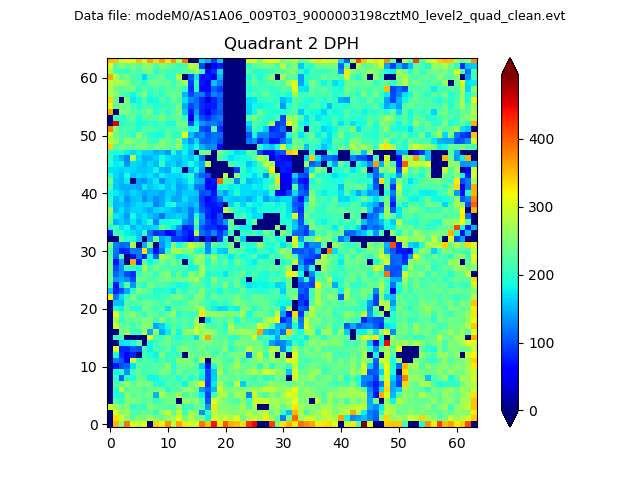
Histogram calculated using DETX and DETY for each event in the final _common_clean file
| Quadrant A |  |
 |
Quadrant B |
|---|---|---|---|
| Quadrant D | 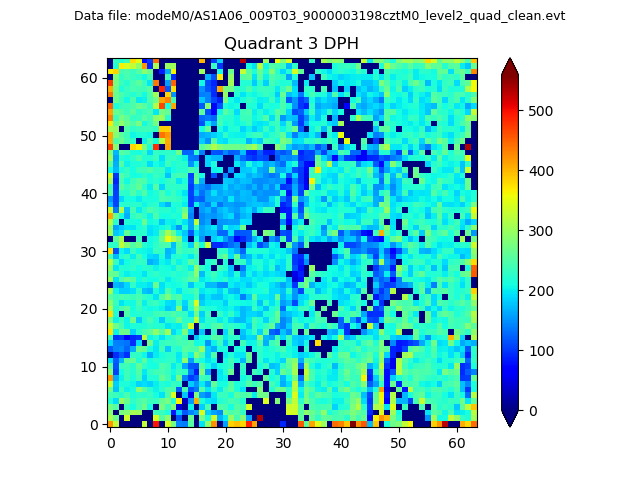 |
 |
Quadrant C |
| Plot type | Count rate plots | Images |
|---|---|---|
| Comparison with Poisson distribution Blue bars denote a histogram of data divided into 1 sec bins. Red curve is a Poisson curve with rate = median count rate of data. |
 |
 |
| Quadrant-wise count rates Data is divided into 100 sec bins |
 |
|
| Module-wise count rates for Quadrant A Data is divided into 100 sec bins |
 |
 |
| Module-wise count rates for Quadrant B Data is divided into 100 sec bins |
 |
 |
| Module-wise count rates for Quadrant C Data is divided into 100 sec bins |
 |
 |
| Module-wise count rates for Quadrant D Data is divided into 100 sec bins |
 |
 |
| Parameter | Plot |
|---|---|
| CZT HV Monitor |  |
| D_VDD | 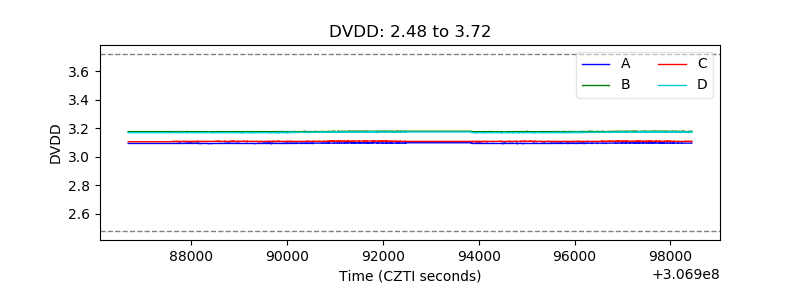 |
| Temperature 1 | 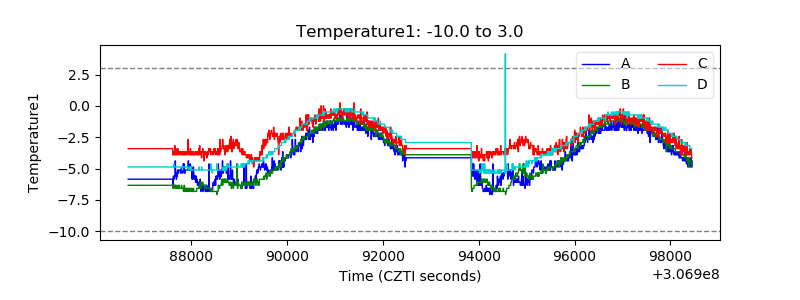 |
| Veto HV Monitor |  |
| Veto LLD |  |
| Alpha Counter |  |
| _CPM_Rate |  |
| CZT Counter |  |
| +2.5 Volts monitor |  |
| +5 Volts monitor |  |
| _ROLL_ROT |  |
| _Roll_DEC |  |
| _Roll_RA |  |
| Veto Counter | 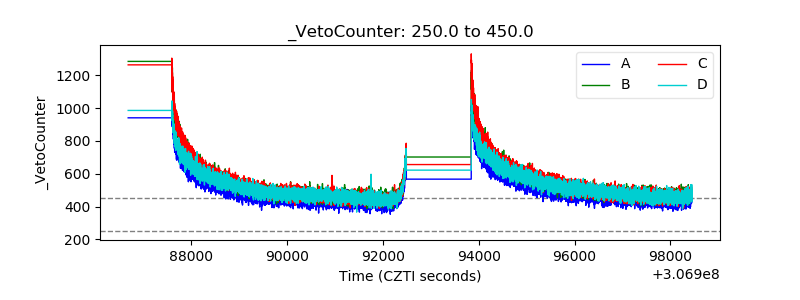 |