| Param | Original file | Final file |
|---|---|---|
| Filename | modeM0/AS1A06_009T03_9000003198_21565cztM0_level2.evt | modeM0/AS1A06_009T03_9000003198_21565cztM0_level2_quad_clean.evt |
| Size (bytes) | 111,093,120 | 3,830,400 |
| Size | 105.9 MB | 3.7 MB |
| Events in quadrant A | 774,272 | 3,959 |
| Events in quadrant B | 805,116 | 4,334 |
| Events in quadrant C | 804,535 | 4,125 |
| Events in quadrant D | 888,156 | 3,793 |
| Mode M9 | |||
|---|---|---|---|
| Quadrant | BADHDUFLAG | Total packets | Discarded packets |
| A | 0 | 10 | 0 |
| B | 0 | 10 | 0 |
| C | 0 | 10 | 0 |
| D | 0 | 10 | 0 |
| Mode M0 | |||
|---|---|---|---|
| Quadrant | BADHDUFLAG | Total packets | Discarded packets |
| A | 0 | 3127 | 2 |
| B | 0 | 3262 | 1 |
| C | 0 | 3277 | 1 |
| D | 0 | 3457 | 1 |
| Mode SS | |||
|---|---|---|---|
| Quadrant | BADHDUFLAG | Total packets | Discarded packets |
| A | 0 | 26 | 0 |
| B | 0 | 26 | 0 |
| C | 0 | 26 | 0 |
| D | 0 | 26 | 0 |
| Quadrant | Total seconds | Saturated seconds | Saturation percentage |
|---|---|---|---|
| A | 1321 | 9 | 0.681302% |
| B | 1321 | 18 | 1.362604% |
| C | 1321 | 30 | 2.271007% |
| D | 1321 | 29 | 2.195307% |
Noise dominated data is calculated using 1-second bins in cleaned event files. If a bin has >2000 counts, and if more than 50% of those come from <1% of pixels, then it is considered to be noise-dominated and hence unusable.
| Quadrant | # 1 sec bins | Bins with >0 counts | Bins with >2000 counts | High rate bins dominated by noise | Noise dominated (total time) | Noise dominated (detector-on time) | Marked lightcurve |
|---|---|---|---|---|---|---|---|
| A | 1321 | 1321 | 0 | 0 | 0.00% | 0.00% | 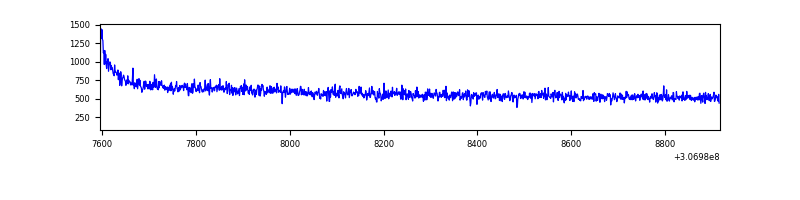 |
| B | 1321 | 1321 | 0 | 0 | 0.00% | 0.00% | 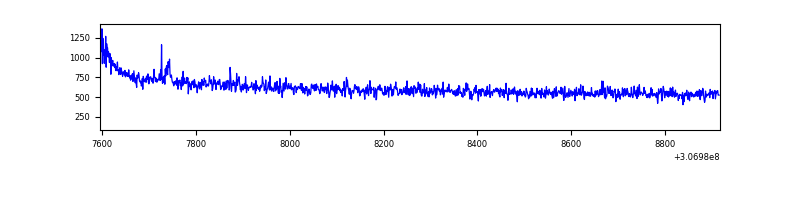 |
| C | 1321 | 1321 | 0 | 0 | 0.00% | 0.00% | 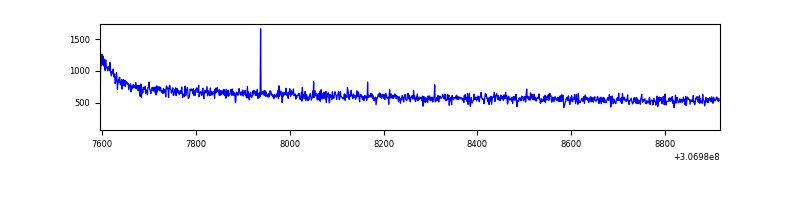 |
| D | 1321 | 1321 | 10 | 10 | 0.76% | 0.76% | 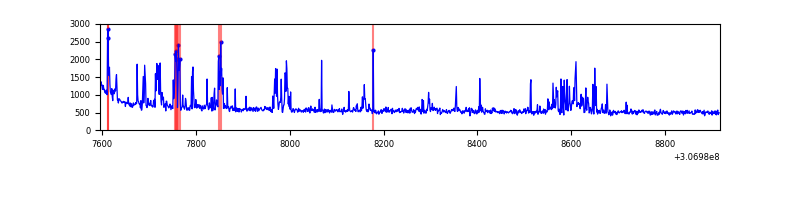 |
Top three noisy pixels from each quadrant. If the there are fewer than three noisy pixels in the level2.evt file, extra rows are filled as -1
| Pixel properties | Quadrant properties | ||||||
|---|---|---|---|---|---|---|---|
| Quadrant | DetID | PixID | Counts | Sigma | Mean | Median | Sigma |
| A | 15 | 48 | 2151 | 48.1 | 200 | 197 | 40.6 |
| A | 13 | 254 | 1723 | 37.56 | 200 | 197 | 40.6 |
| A | 0 | 226 | 1705 | 37.12 | 200 | 197 | 40.6 |
| B | 0 | 230 | 6330 | 158.0 | 204 | 201 | 38.8 |
| B | 12 | 111 | 4184 | 102.68 | 204 | 201 | 38.8 |
| B | 11 | 111 | 3644 | 88.75 | 204 | 201 | 38.8 |
| C | 14 | 238 | 32113 | 694.74 | 196 | 198 | 45.9 |
| C | 3 | 233 | 5591 | 117.4 | 196 | 198 | 45.9 |
| C | 0 | 10 | 1418 | 26.56 | 196 | 198 | 45.9 |
| D | 1 | 52 | 88484 | 1841.85 | 192 | 187 | 47.9 |
| D | 13 | 153 | 30642 | 635.28 | 192 | 187 | 47.9 |
| D | 2 | 136 | 22879 | 473.35 | 192 | 187 | 47.9 |
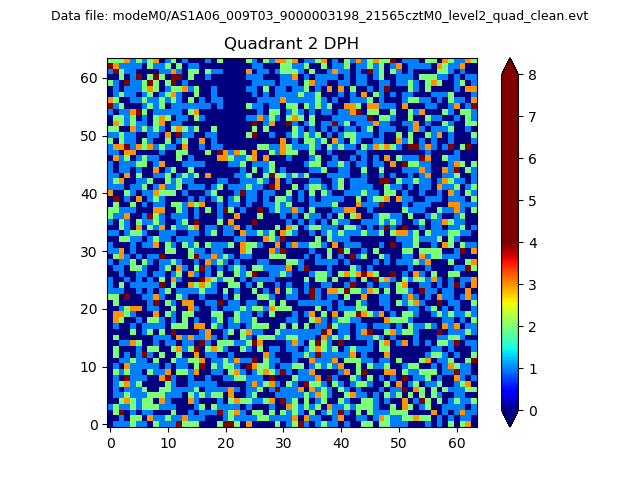
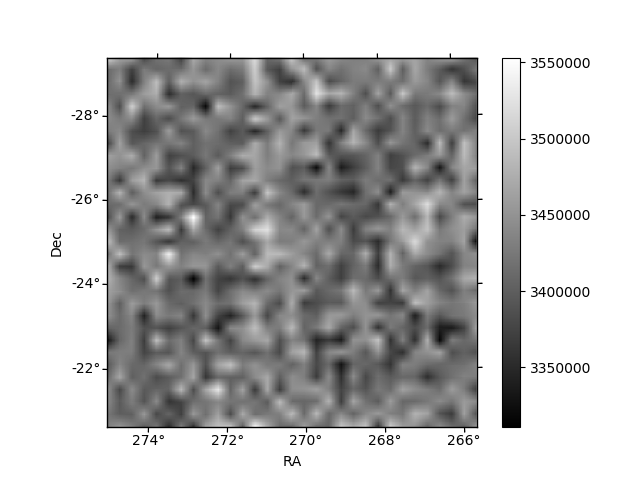
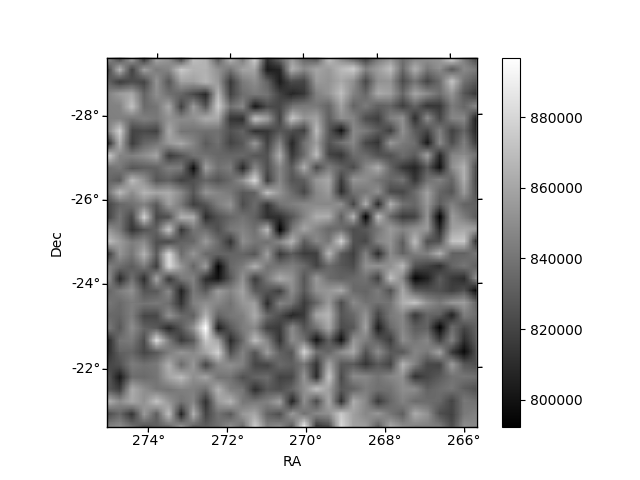
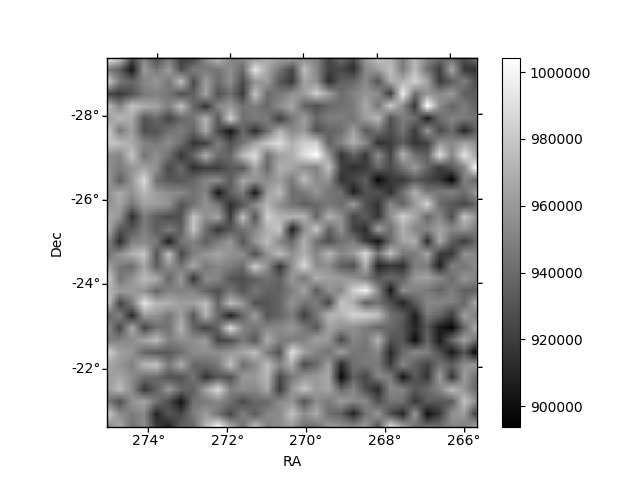
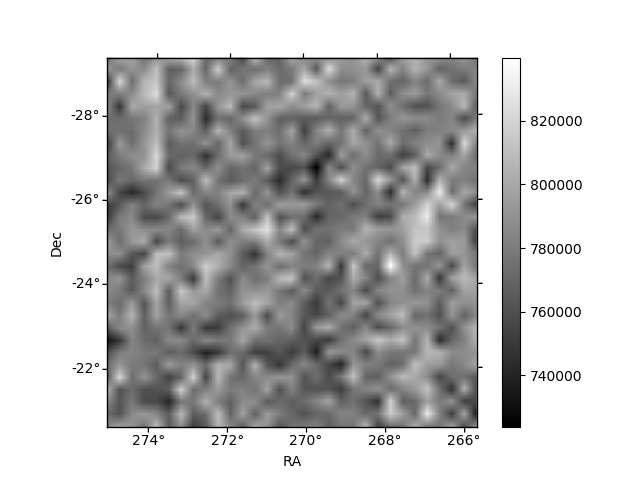
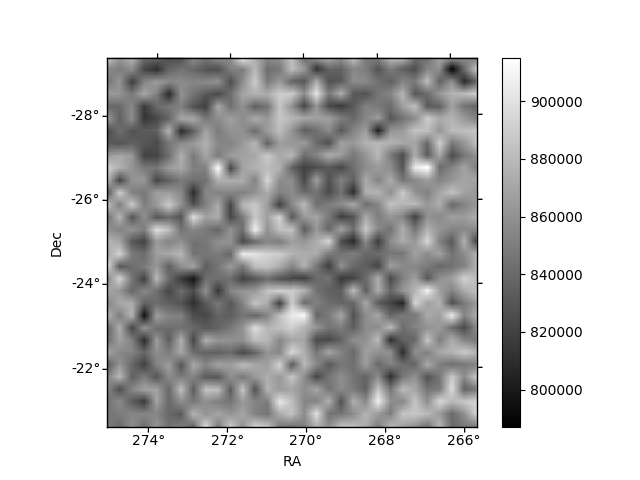
Histogram calculated using DETX and DETY for each event in the final _common_clean file
| Quadrant A | 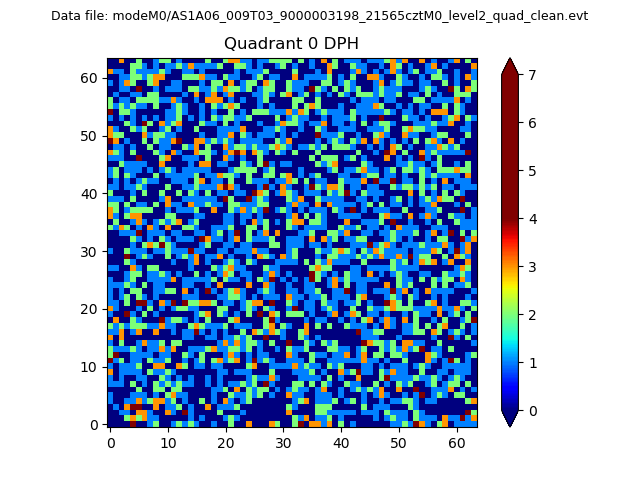 |
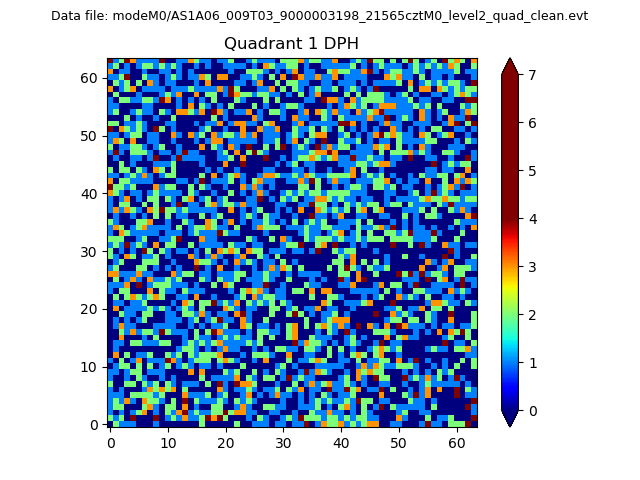 |
Quadrant B |
|---|---|---|---|
| Quadrant D | 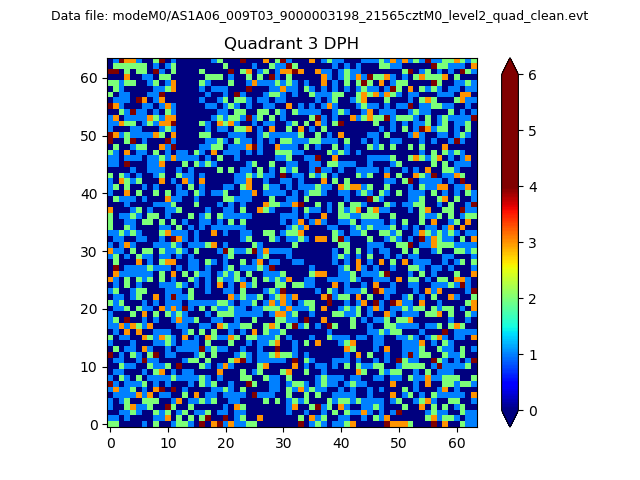 |
 |
Quadrant C |
| Plot type | Count rate plots | Images |
|---|---|---|
| Comparison with Poisson distribution Blue bars denote a histogram of data divided into 1 sec bins. Red curve is a Poisson curve with rate = median count rate of data. |
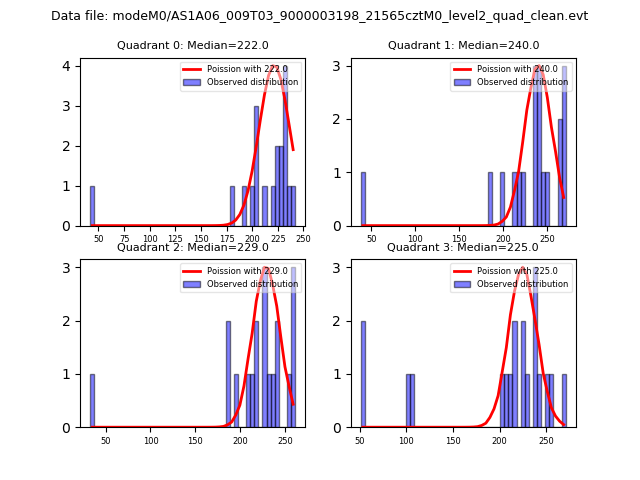 |
 |
| Quadrant-wise count rates Data is divided into 100 sec bins |
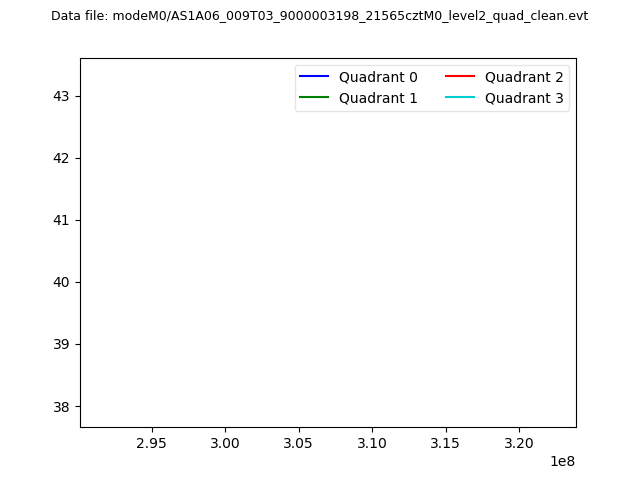 |
|
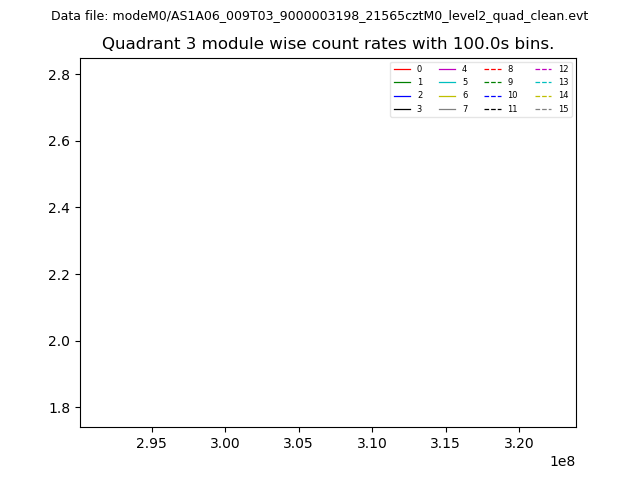
| Module-wise count rates for Quadrant A Data is divided into 100 sec bins |
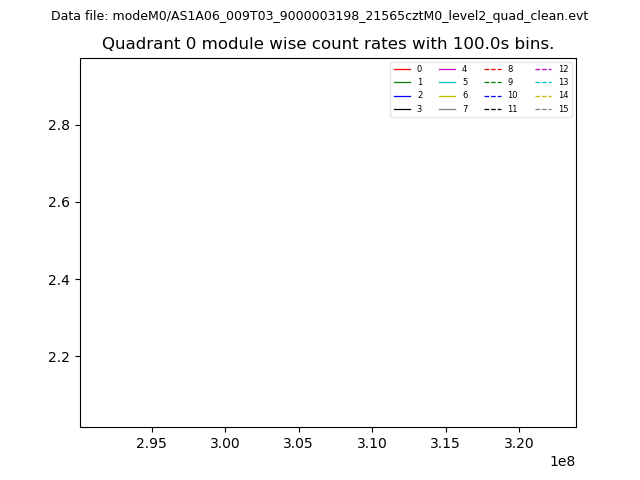 |
 |
| Module-wise count rates for Quadrant B Data is divided into 100 sec bins |
 |
 |
| Module-wise count rates for Quadrant C Data is divided into 100 sec bins |
 |
 |
| Module-wise count rates for Quadrant D Data is divided into 100 sec bins |
 |
 |
| Parameter | Plot |
|---|---|
| CZT HV Monitor | 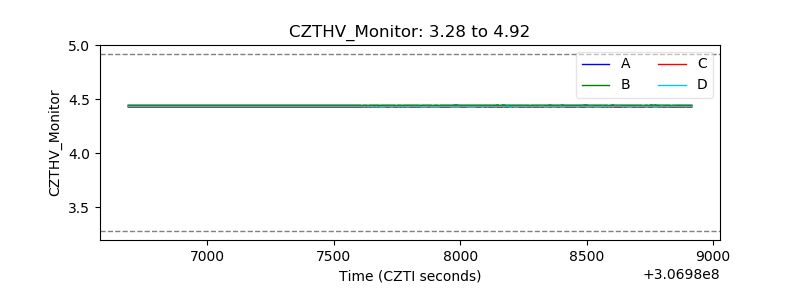 |
| D_VDD | 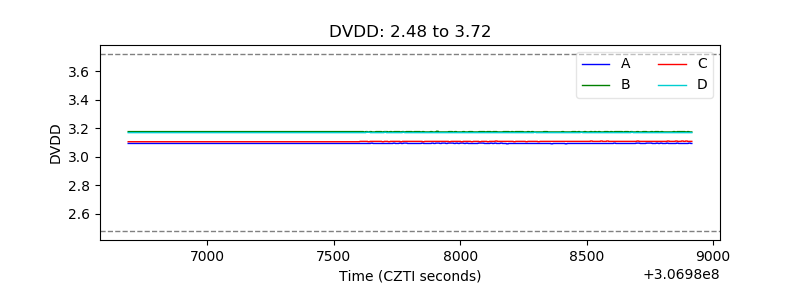 |
| Temperature 1 | 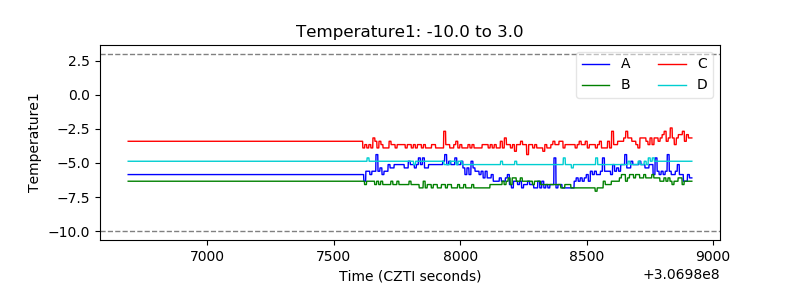 |
| Veto HV Monitor | 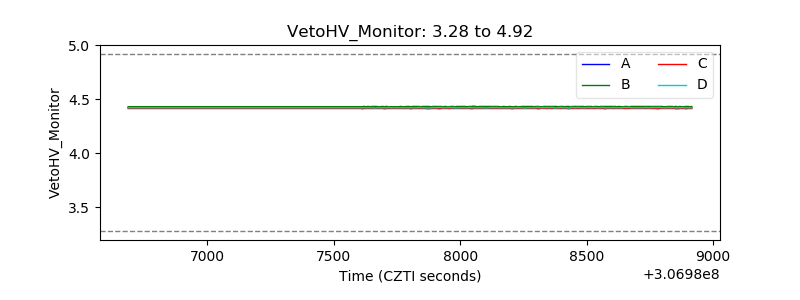 |
| Veto LLD | 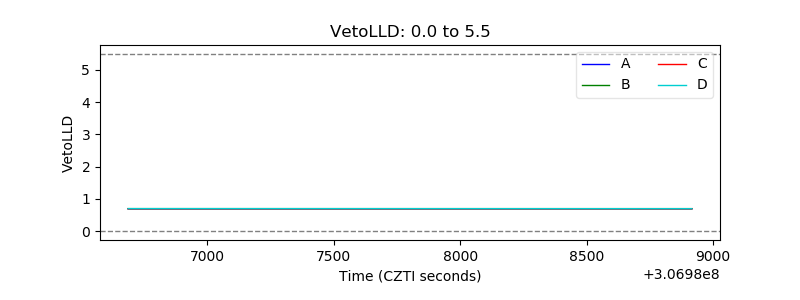 |
| Alpha Counter | 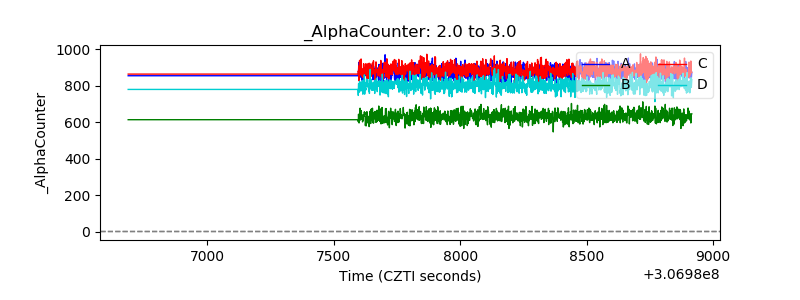 |
| _CPM_Rate | 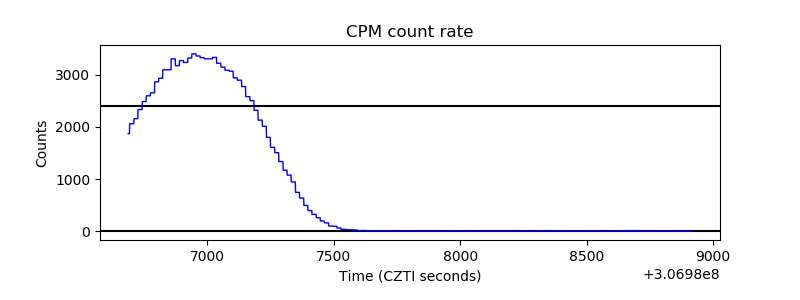 |
| CZT Counter | 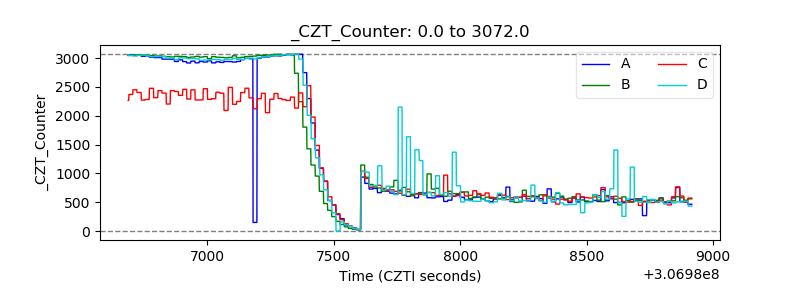 |
| +2.5 Volts monitor |  |
| +5 Volts monitor |  |
| _ROLL_ROT | 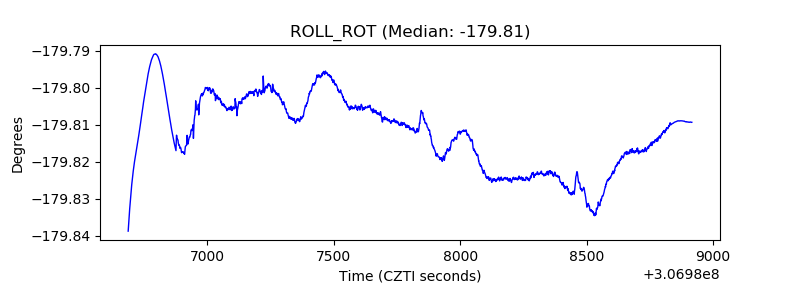 |
| _Roll_DEC | 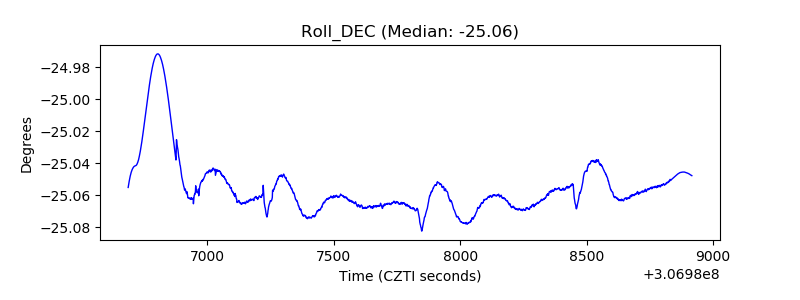 |
| _Roll_RA | 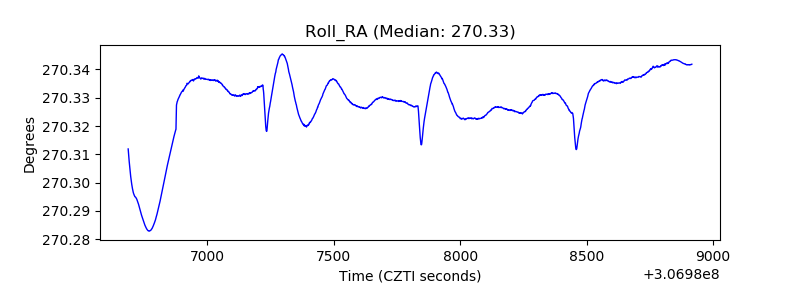 |
| Veto Counter | 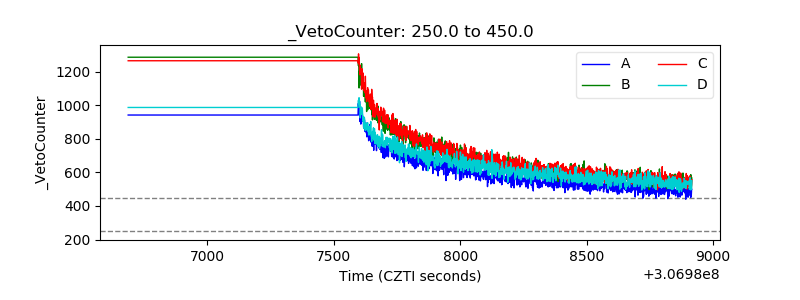 |