| Param | Original file | Final file |
|---|---|---|
| Filename | modeM0/AS1A06_009T03_9000003198_21566cztM0_level2.evt | modeM0/AS1A06_009T03_9000003198_21566cztM0_level2_quad_clean.evt |
| Size (bytes) | 496,762,560 | 66,876,480 |
| Size | 473.7 MB | 63.8 MB |
| Events in quadrant A | 3,484,001 | 403,350 |
| Events in quadrant B | 3,613,965 | 409,029 |
| Events in quadrant C | 3,563,725 | 391,995 |
| Events in quadrant D | 3,953,313 | 378,658 |
| Mode M9 | |||
|---|---|---|---|
| Quadrant | BADHDUFLAG | Total packets | Discarded packets |
| A | 0 | 20 | 0 |
| B | 0 | 21 | 0 |
| C | 0 | 21 | 0 |
| D | 0 | 21 | 0 |
| Mode M0 | |||
|---|---|---|---|
| Quadrant | BADHDUFLAG | Total packets | Discarded packets |
| A | 0 | 14013 | 2 |
| B | 0 | 14532 | 2 |
| C | 0 | 14418 | 2 |
| D | 0 | 15663 | 2 |
| Mode SS | |||
|---|---|---|---|
| Quadrant | BADHDUFLAG | Total packets | Discarded packets |
| A | 0 | 128 | 0 |
| B | 0 | 128 | 0 |
| C | 0 | 128 | 0 |
| D | 0 | 128 | 0 |
| Quadrant | Total seconds | Saturated seconds | Saturation percentage |
|---|---|---|---|
| A | 6334 | 32 | 0.505210% |
| B | 6334 | 55 | 0.868330% |
| C | 6333 | 118 | 1.863256% |
| D | 6333 | 89 | 1.405337% |
Noise dominated data is calculated using 1-second bins in cleaned event files. If a bin has >2000 counts, and if more than 50% of those come from <1% of pixels, then it is considered to be noise-dominated and hence unusable.
| Quadrant | # 1 sec bins | Bins with >0 counts | Bins with >2000 counts | High rate bins dominated by noise | Noise dominated (total time) | Noise dominated (detector-on time) | Marked lightcurve |
|---|---|---|---|---|---|---|---|
| A | 7689 | 6335 | 1 | 1 | 0.01% | 0.02% | 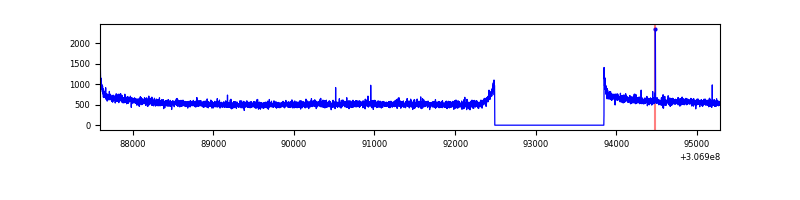 |
| B | 7689 | 6335 | 0 | 0 | 0.00% | 0.00% | 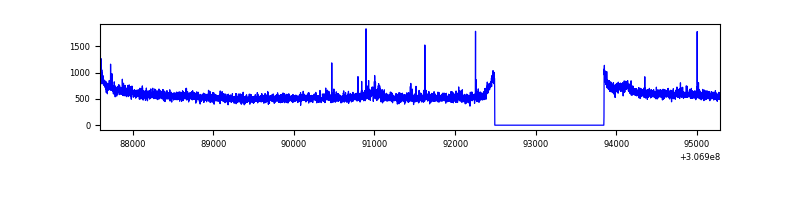 |
| C | 7688 | 6334 | 0 | 0 | 0.00% | 0.00% |  |
| D | 7688 | 6334 | 36 | 36 | 0.47% | 0.57% | 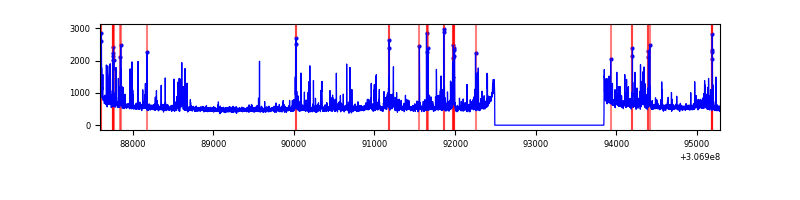 |
Top three noisy pixels from each quadrant. If the there are fewer than three noisy pixels in the level2.evt file, extra rows are filled as -1
| Pixel properties | Quadrant properties | ||||||
|---|---|---|---|---|---|---|---|
| Quadrant | DetID | PixID | Counts | Sigma | Mean | Median | Sigma |
| A | 0 | 226 | 7917 | 39.66 | 903 | 890 | 177.2 |
| A | 13 | 254 | 7561 | 37.65 | 903 | 890 | 177.2 |
| A | 3 | 137 | 6698 | 32.78 | 903 | 890 | 177.2 |
| B | 0 | 230 | 44262 | 259.33 | 907 | 891 | 167.2 |
| B | 12 | 111 | 18774 | 106.93 | 907 | 891 | 167.2 |
| B | 11 | 111 | 16401 | 92.74 | 907 | 891 | 167.2 |
| C | 14 | 238 | 141604 | 707.0 | 870 | 879 | 199.0 |
| C | 3 | 233 | 24065 | 116.49 | 870 | 879 | 199.0 |
| C | 13 | 61 | 6101 | 26.24 | 870 | 879 | 199.0 |
| D | 1 | 52 | 178288 | 856.62 | 872 | 852 | 207.1 |
| D | 12 | 235 | 163613 | 785.77 | 872 | 852 | 207.1 |
| D | 13 | 153 | 122072 | 585.22 | 872 | 852 | 207.1 |
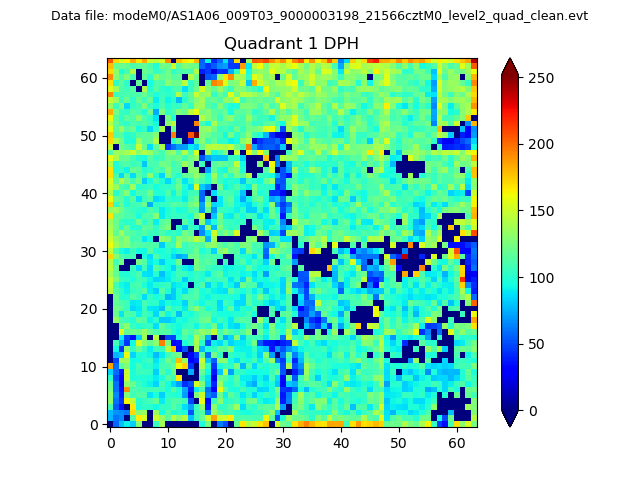
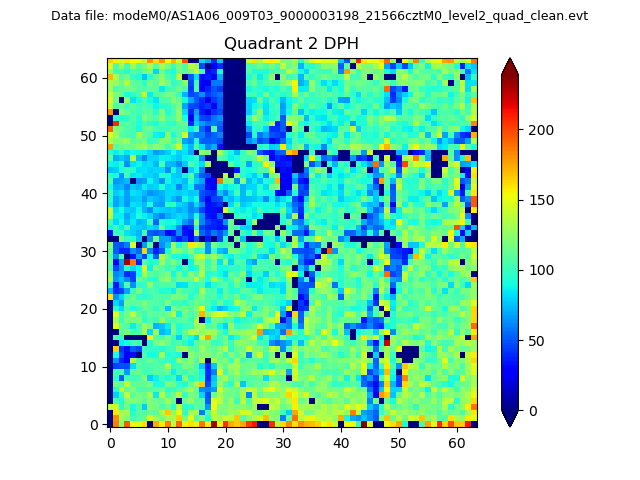
Histogram calculated using DETX and DETY for each event in the final _common_clean file
| Quadrant A | 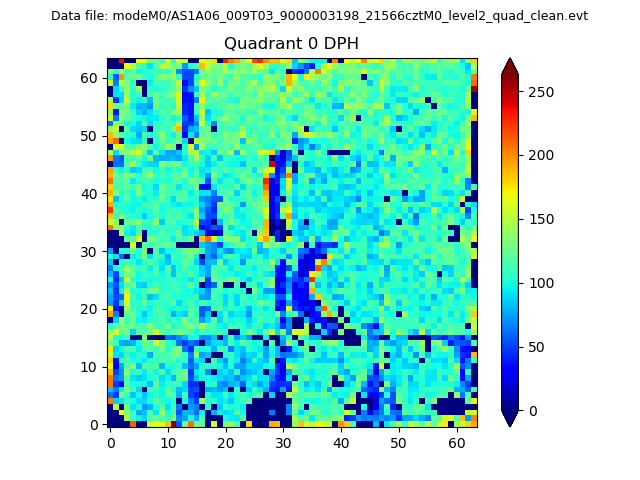 |
 |
Quadrant B |
|---|---|---|---|
| Quadrant D | 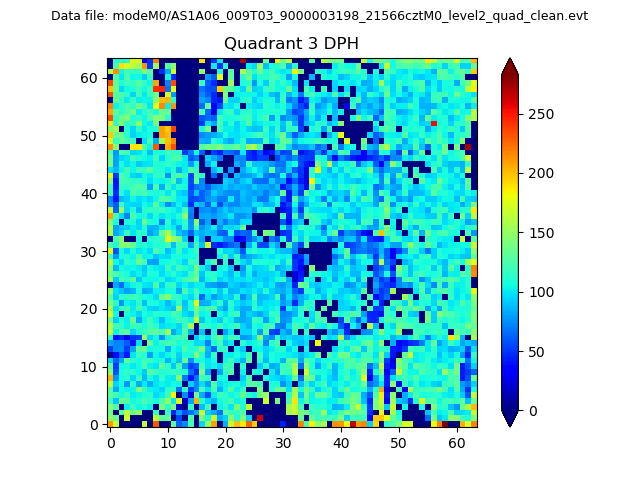 |
 |
Quadrant C |
| Plot type | Count rate plots | Images |
|---|---|---|
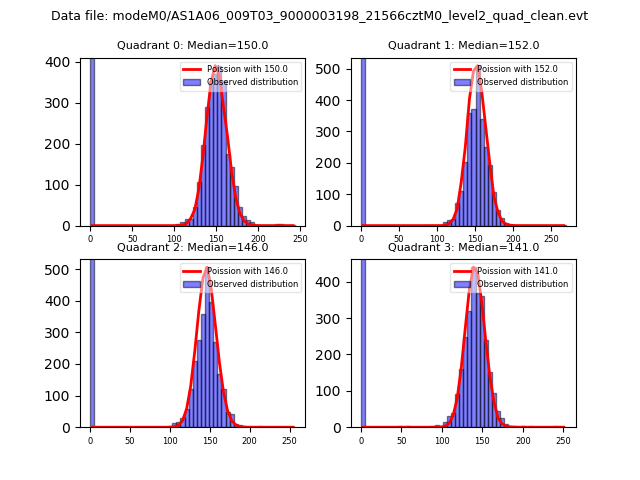
| Comparison with Poisson distribution Blue bars denote a histogram of data divided into 1 sec bins. Red curve is a Poisson curve with rate = median count rate of data. |
 |
 |
| Quadrant-wise count rates Data is divided into 100 sec bins |
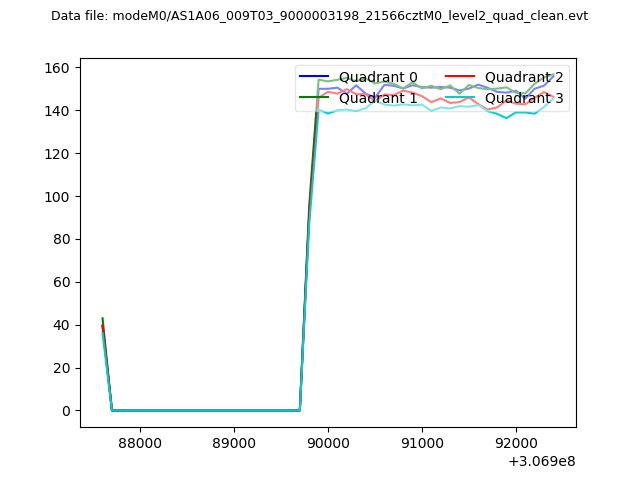 |
|
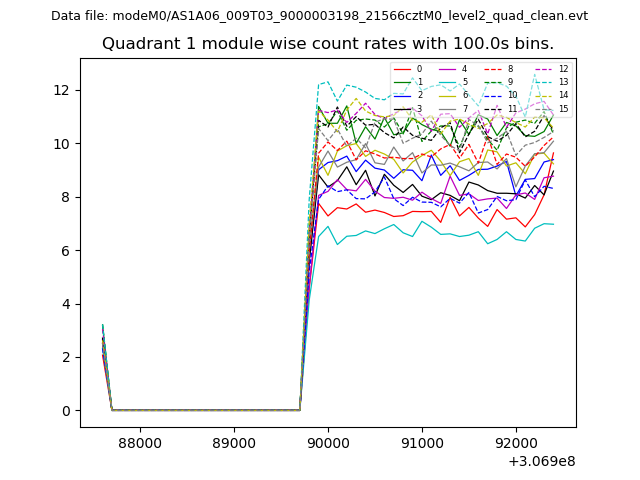
| Module-wise count rates for Quadrant A Data is divided into 100 sec bins |
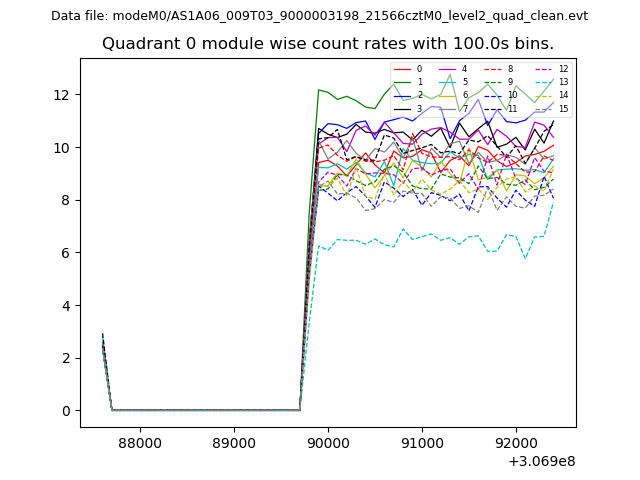 |
 |
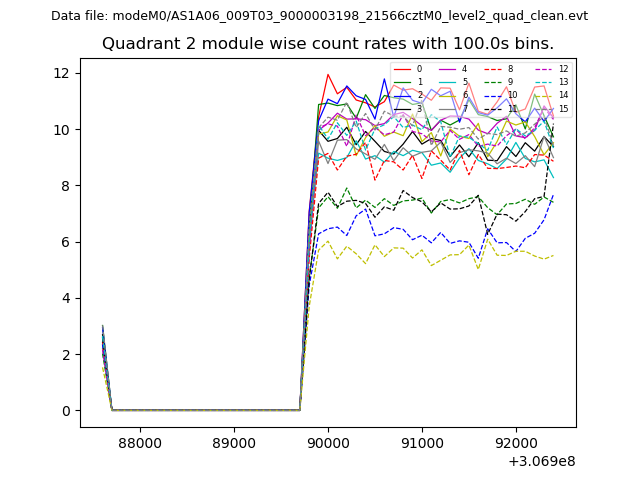
| Module-wise count rates for Quadrant B Data is divided into 100 sec bins |
 |
 |
| Module-wise count rates for Quadrant C Data is divided into 100 sec bins |
 |
 |
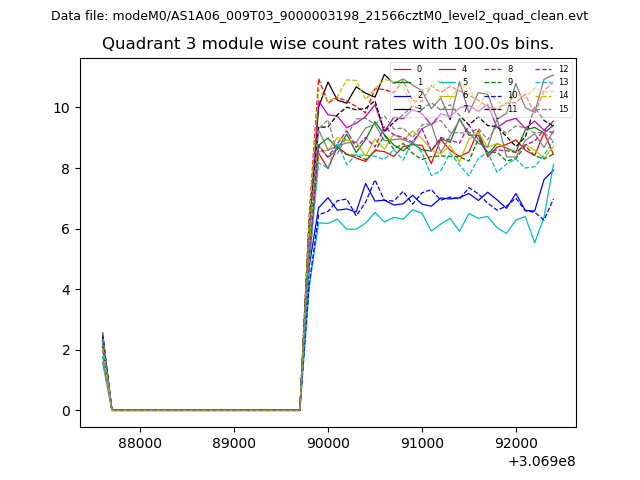
| Module-wise count rates for Quadrant D Data is divided into 100 sec bins |
 |
 |
| Parameter | Plot |
|---|---|
| CZT HV Monitor | 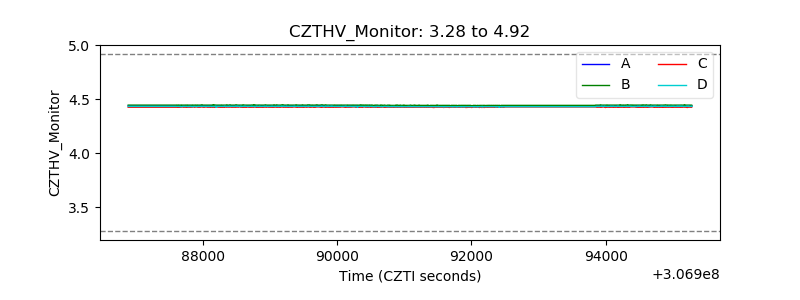 |
| D_VDD | 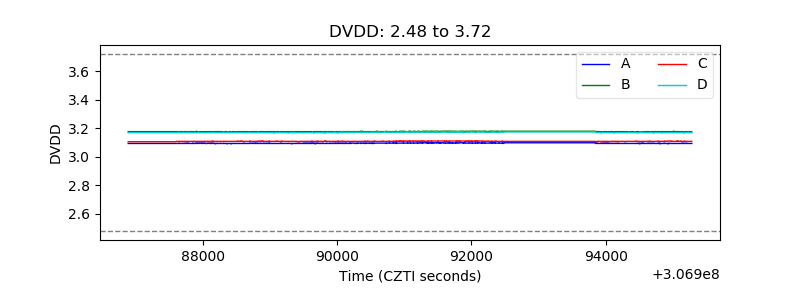 |
| Temperature 1 | 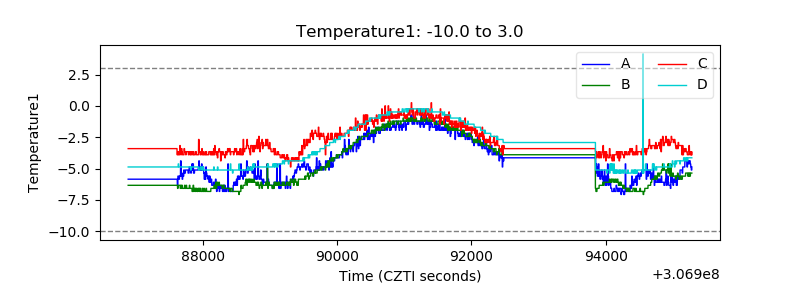 |
| Veto HV Monitor |  |
| Veto LLD | 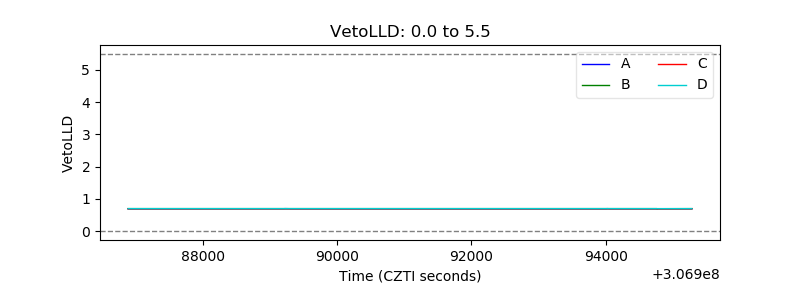 |
| Alpha Counter | 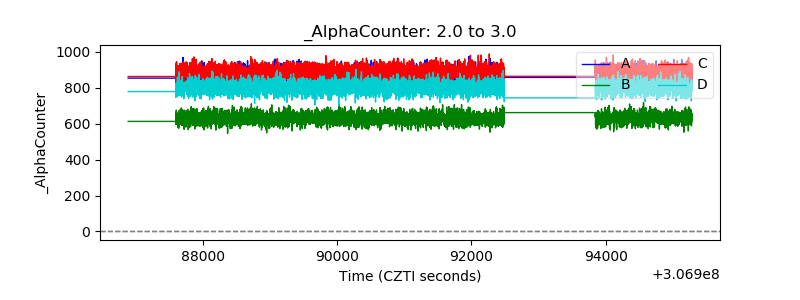 |
| _CPM_Rate | 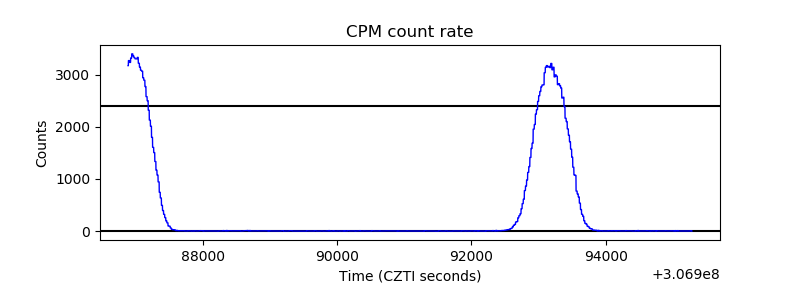 |
| CZT Counter | 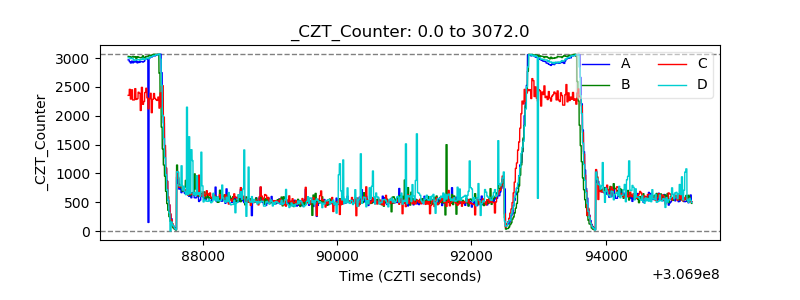 |
| +2.5 Volts monitor |  |
| +5 Volts monitor |  |
| _ROLL_ROT | 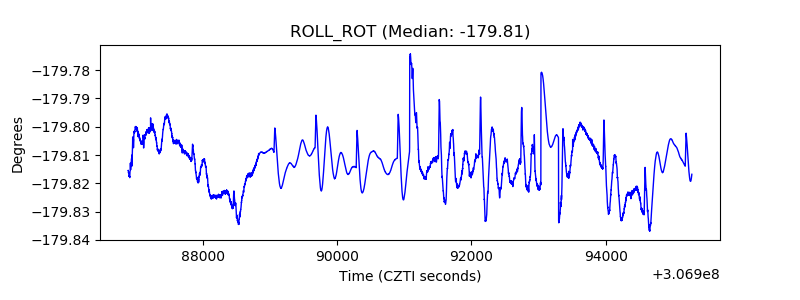 |
| _Roll_DEC |  |
| _Roll_RA | 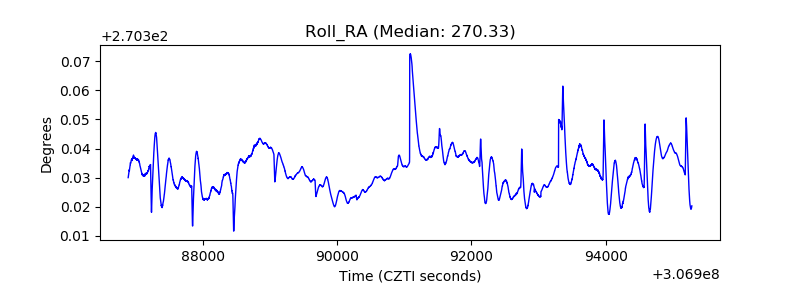 |
| Veto Counter | 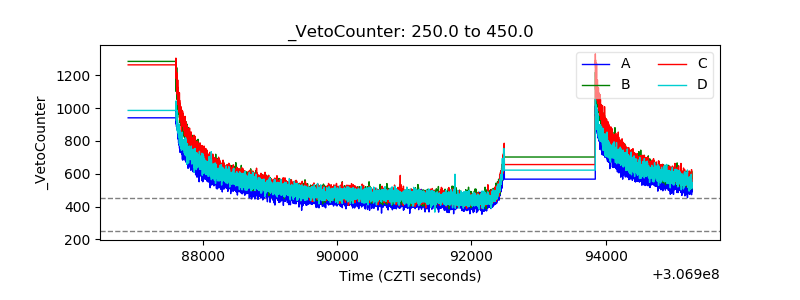 |