| Param | Original file | Final file |
|---|---|---|
| Filename | modeM0/AS1A06_009T03_9000003198_21567cztM0_level2.evt | modeM0/AS1A06_009T03_9000003198_21567cztM0_level2_quad_clean.evt |
| Size (bytes) | 357,073,920 | 66,110,400 |
| Size | 340.5 MB | 63.0 MB |
| Events in quadrant A | 2,490,040 | 426,700 |
| Events in quadrant B | 2,586,759 | 434,367 |
| Events in quadrant C | 2,510,710 | 416,313 |
| Events in quadrant D | 2,913,410 | 400,877 |
| Mode M9 | |||
|---|---|---|---|
| Quadrant | BADHDUFLAG | Total packets | Discarded packets |
| A | 0 | 5 | 0 |
| B | 0 | 6 | 0 |
| C | 0 | 6 | 0 |
| D | 0 | 6 | 0 |
| Mode M0 | |||
|---|---|---|---|
| Quadrant | BADHDUFLAG | Total packets | Discarded packets |
| A | 0 | 9944 | 1 |
| B | 0 | 10340 | 1 |
| C | 0 | 10157 | 1 |
| D | 0 | 11489 | 1 |
| Mode SS | |||
|---|---|---|---|
| Quadrant | BADHDUFLAG | Total packets | Discarded packets |
| A | 0 | 92 | 0 |
| B | 0 | 92 | 0 |
| C | 0 | 92 | 0 |
| D | 0 | 92 | 0 |
| Quadrant | Total seconds | Saturated seconds | Saturation percentage |
|---|---|---|---|
| A | 4602 | 9 | 0.195567% |
| B | 4602 | 15 | 0.325945% |
| C | 4602 | 38 | 0.825728% |
| D | 4602 | 58 | 1.260322% |
Noise dominated data is calculated using 1-second bins in cleaned event files. If a bin has >2000 counts, and if more than 50% of those come from <1% of pixels, then it is considered to be noise-dominated and hence unusable.
| Quadrant | # 1 sec bins | Bins with >0 counts | Bins with >2000 counts | High rate bins dominated by noise | Noise dominated (total time) | Noise dominated (detector-on time) | Marked lightcurve |
|---|---|---|---|---|---|---|---|
| A | 4602 | 4602 | 1 | 1 | 0.02% | 0.02% | 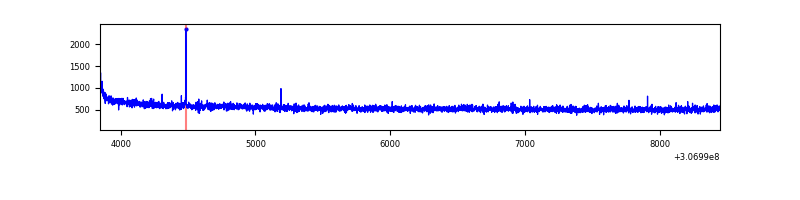 |
| B | 4602 | 4602 | 0 | 0 | 0.00% | 0.00% | 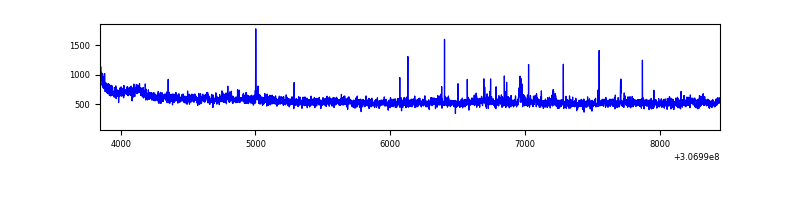 |
| C | 4602 | 4602 | 0 | 0 | 0.00% | 0.00% | 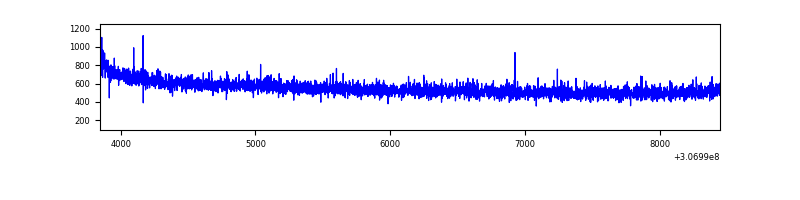 |
| D | 4602 | 4602 | 51 | 51 | 1.11% | 1.11% | 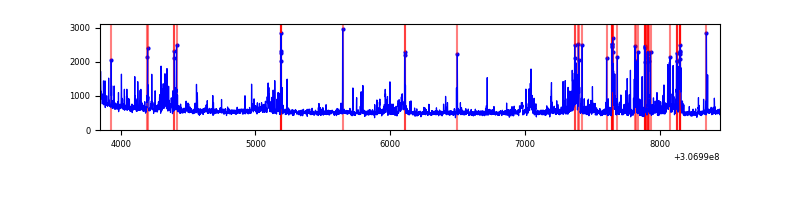 |
Top three noisy pixels from each quadrant. If the there are fewer than three noisy pixels in the level2.evt file, extra rows are filled as -1
| Pixel properties | Quadrant properties | ||||||
|---|---|---|---|---|---|---|---|
| Quadrant | DetID | PixID | Counts | Sigma | Mean | Median | Sigma |
| A | 13 | 254 | 6193 | 42.87 | 645 | 635 | 129.7 |
| A | 0 | 226 | 5675 | 38.87 | 645 | 635 | 129.7 |
| A | 8 | 31 | 5395 | 36.71 | 645 | 635 | 129.7 |
| B | 0 | 230 | 34880 | 288.46 | 644 | 632 | 118.7 |
| B | 0 | 190 | 13939 | 112.08 | 644 | 632 | 118.7 |
| B | 12 | 111 | 12930 | 103.58 | 644 | 632 | 118.7 |
| C | 14 | 238 | 100638 | 708.36 | 616 | 623 | 141.2 |
| C | 3 | 233 | 5519 | 34.68 | 616 | 623 | 141.2 |
| C | 13 | 61 | 4330 | 26.25 | 616 | 623 | 141.2 |
| D | 13 | 153 | 144946 | 969.03 | 623 | 608 | 149.0 |
| D | 2 | 136 | 123840 | 827.33 | 623 | 608 | 149.0 |
| D | 12 | 235 | 112250 | 749.52 | 623 | 608 | 149.0 |
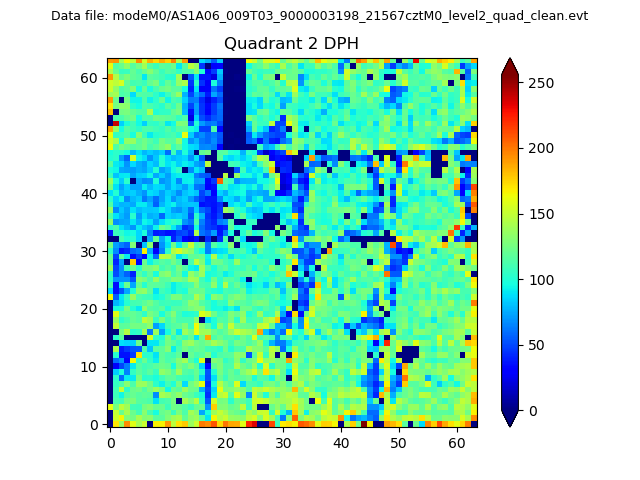
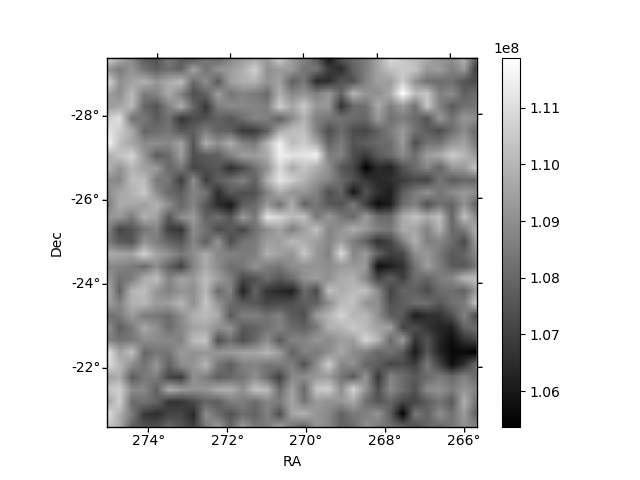
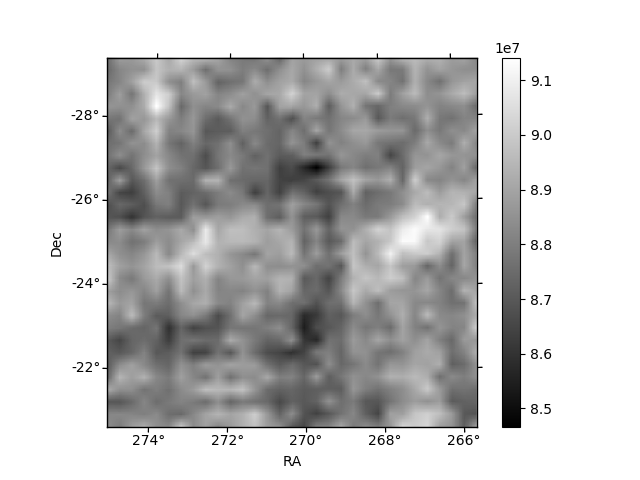
Histogram calculated using DETX and DETY for each event in the final _common_clean file
| Quadrant A | 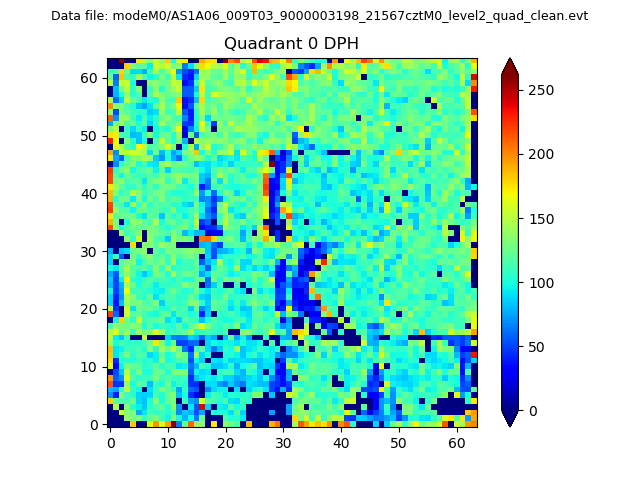 |
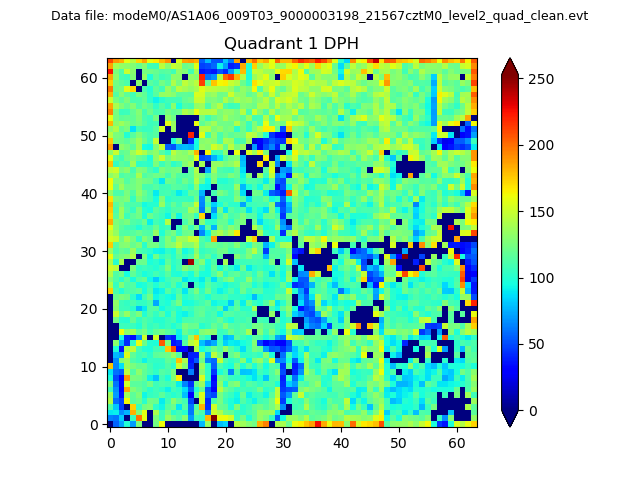 |
Quadrant B |
|---|---|---|---|
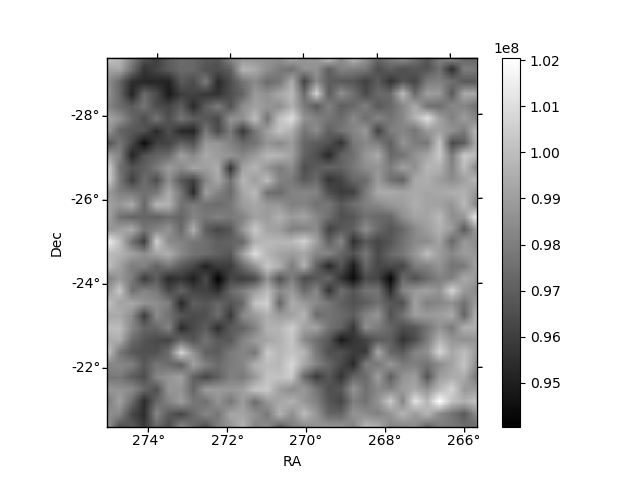
| Quadrant D | 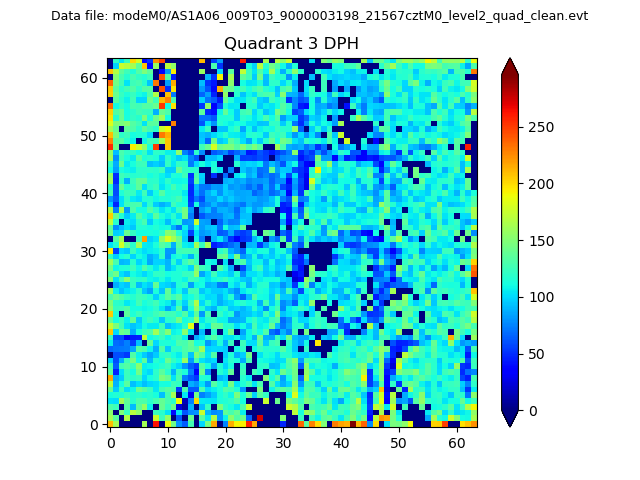 |
 |
Quadrant C |
| Plot type | Count rate plots | Images |
|---|---|---|
| Comparison with Poisson distribution Blue bars denote a histogram of data divided into 1 sec bins. Red curve is a Poisson curve with rate = median count rate of data. |
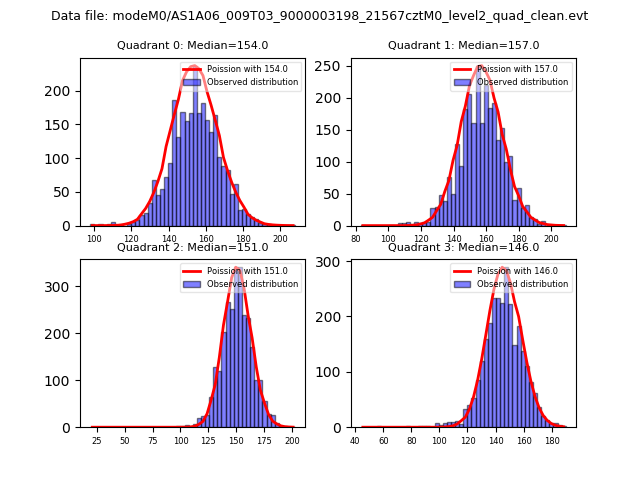 |
 |
| Quadrant-wise count rates Data is divided into 100 sec bins |
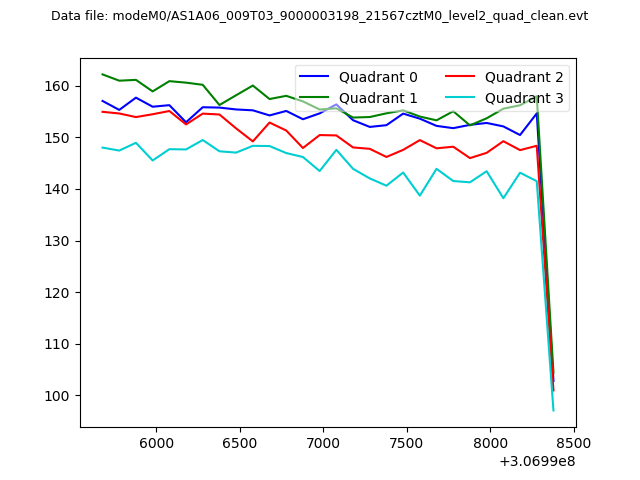 |
|
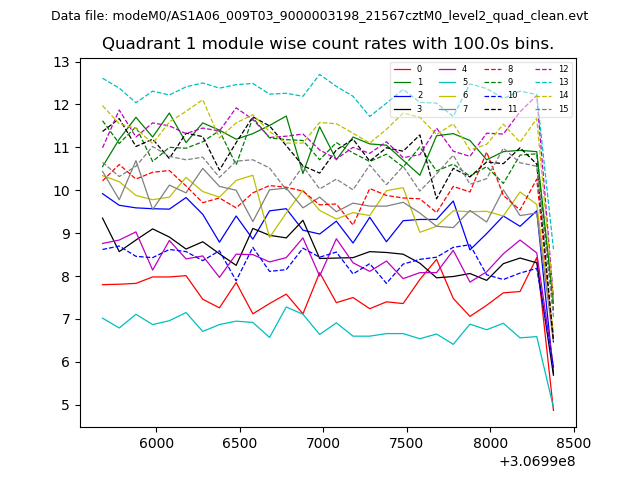
| Module-wise count rates for Quadrant A Data is divided into 100 sec bins |
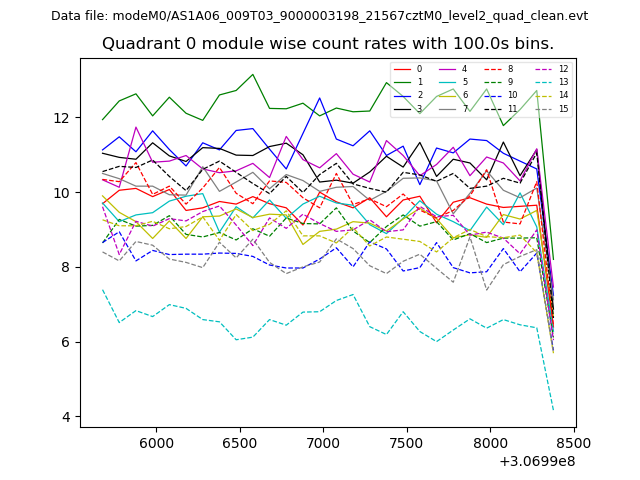 |
 |
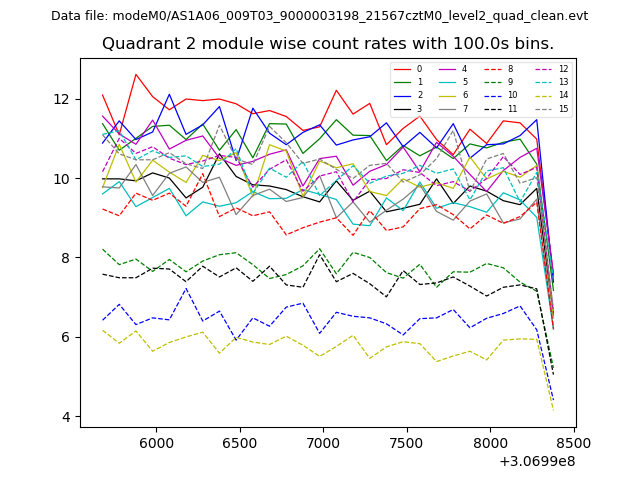
| Module-wise count rates for Quadrant B Data is divided into 100 sec bins |
 |
 |
| Module-wise count rates for Quadrant C Data is divided into 100 sec bins |
 |
 |
| Module-wise count rates for Quadrant D Data is divided into 100 sec bins |
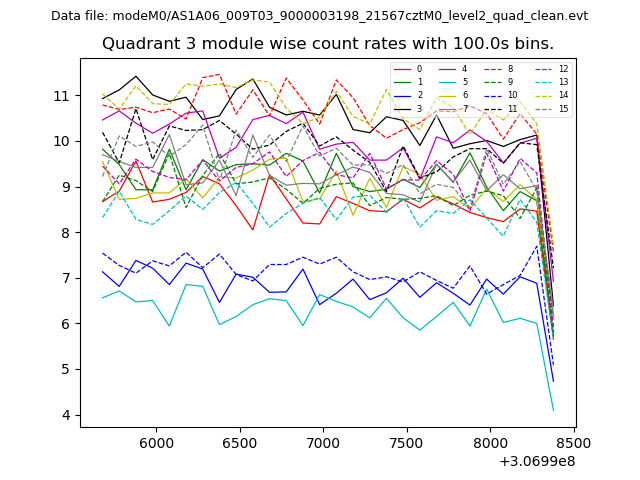 |
 |
| Parameter | Plot |
|---|---|
| CZT HV Monitor | 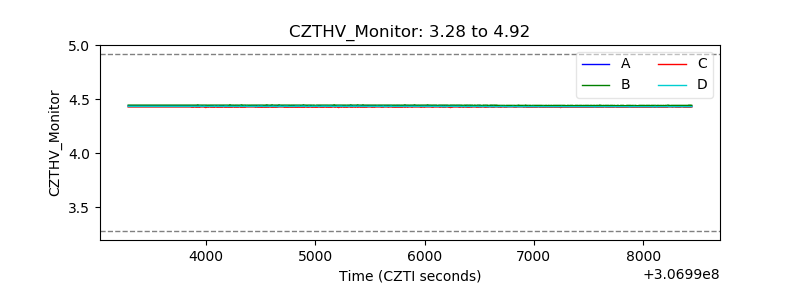 |
| D_VDD | 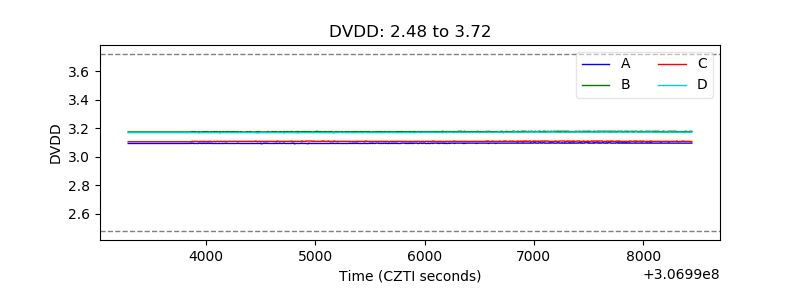 |
| Temperature 1 | 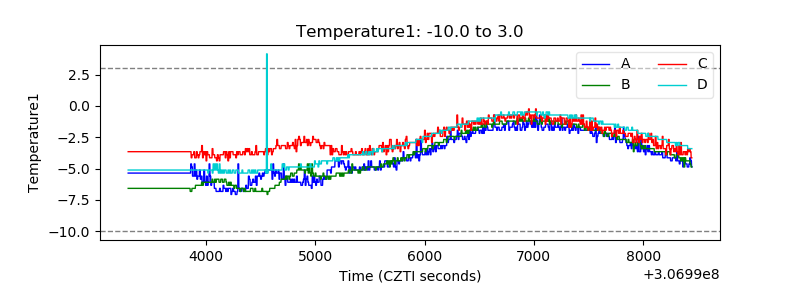 |
| Veto HV Monitor | 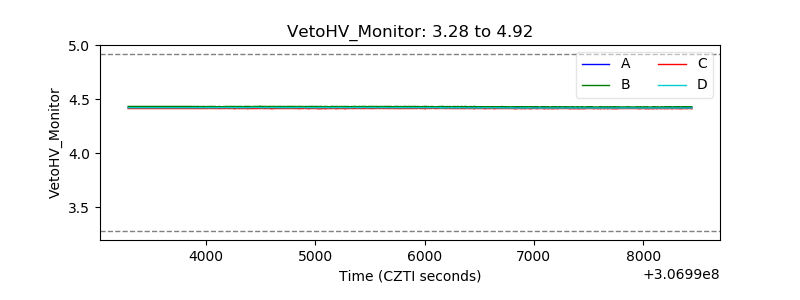 |
| Veto LLD | 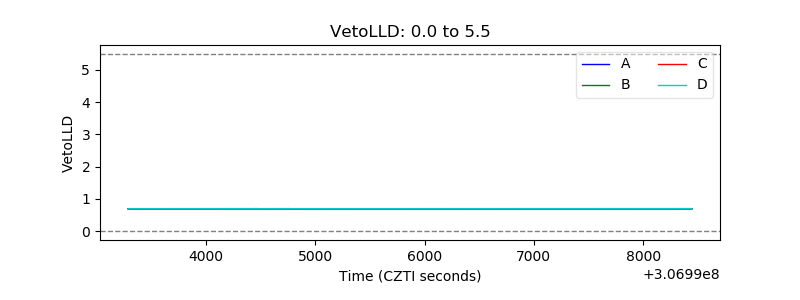 |
| Alpha Counter |  |
| _CPM_Rate | 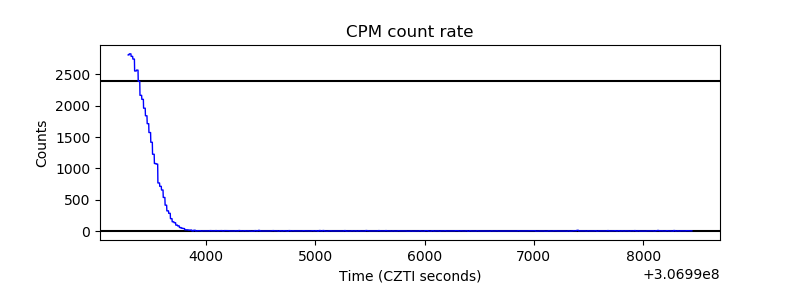 |
| CZT Counter | 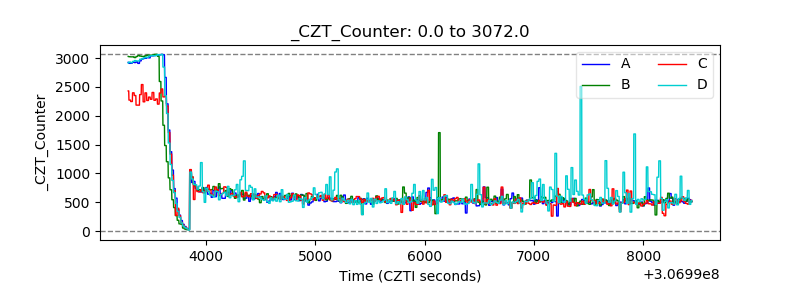 |
| +2.5 Volts monitor | 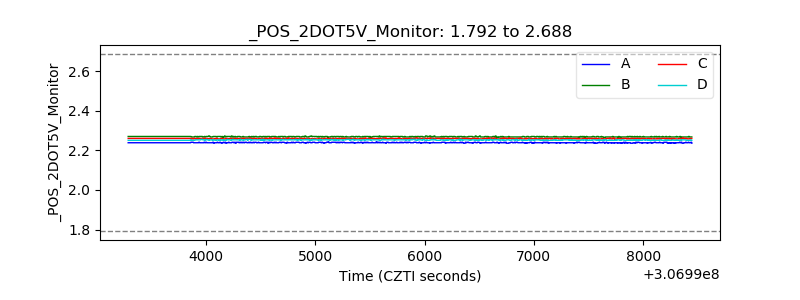 |
| +5 Volts monitor | 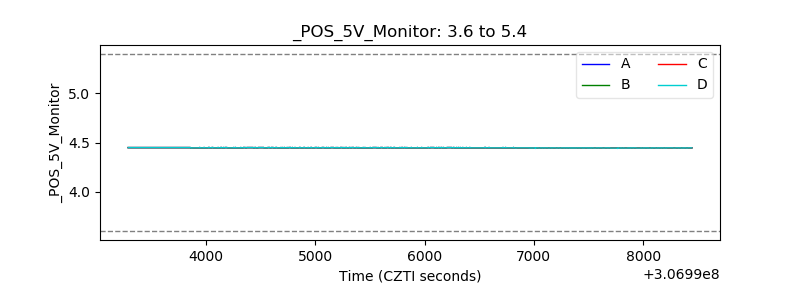 |
| _ROLL_ROT |  |
| _Roll_DEC | 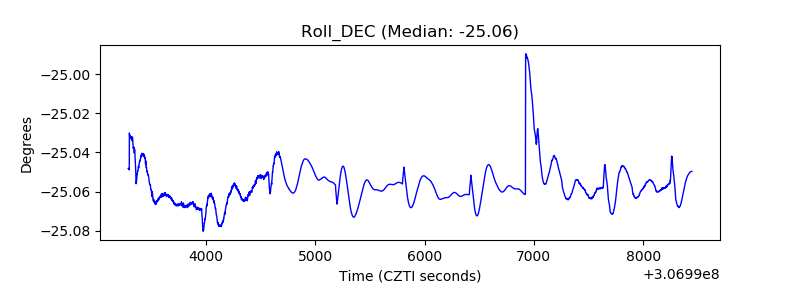 |
| _Roll_RA | 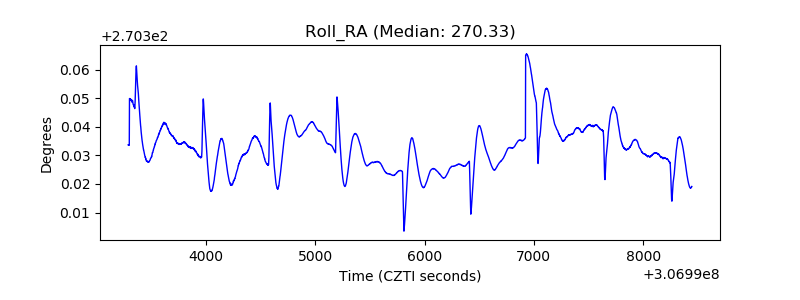 |
| Veto Counter | 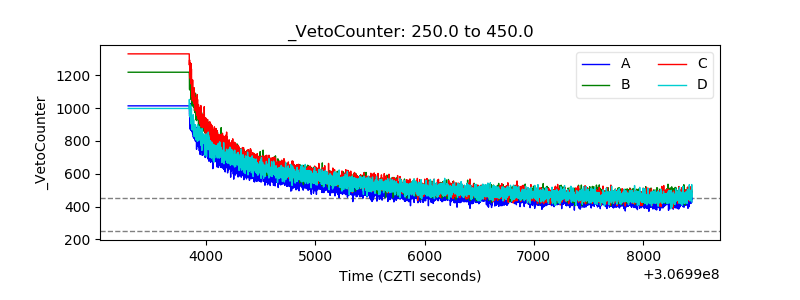 |