| Param | Original file | Final file |
|---|---|---|
| Filename | modeM0/AS1A06_002T02_9000003204_21580cztM0_level2.evt | modeM0/AS1A06_002T02_9000003204_21580cztM0_level2_quad_clean.evt |
| Size (bytes) | 369,823,680 | 90,331,200 |
| Size | 352.7 MB | 86.1 MB |
| Events in quadrant A | 2,569,269 | 601,699 |
| Events in quadrant B | 2,744,796 | 614,043 |
| Events in quadrant C | 2,594,045 | 587,196 |
| Events in quadrant D | 2,932,119 | 562,543 |
| Mode M0 | |||
|---|---|---|---|
| Quadrant | BADHDUFLAG | Total packets | Discarded packets |
| A | 0 | 11004 | 0 |
| B | 0 | 11522 | 0 |
| C | 0 | 11076 | 0 |
| D | 0 | 12216 | 0 |
| Mode SS | |||
|---|---|---|---|
| Quadrant | BADHDUFLAG | Total packets | Discarded packets |
| A | 0 | 108 | 0 |
| B | 0 | 108 | 0 |
| C | 0 | 108 | 0 |
| D | 0 | 108 | 0 |
| Mode M9 | |||
|---|---|---|---|
| Quadrant | BADHDUFLAG | Total packets | Discarded packets |
| A | 0 | 13 | 0 |
| B | 0 | 13 | 0 |
| C | 0 | 13 | 0 |
| D | 0 | 13 | 0 |
| Quadrant | Total seconds | Saturated seconds | Saturation percentage |
|---|---|---|---|
| A | 5286 | 9 | 0.170261% |
| B | 5286 | 30 | 0.567537% |
| C | 5286 | 35 | 0.662126% |
| D | 5285 | 74 | 1.400189% |
Noise dominated data is calculated using 1-second bins in cleaned event files. If a bin has >2000 counts, and if more than 50% of those come from <1% of pixels, then it is considered to be noise-dominated and hence unusable.
| Quadrant | # 1 sec bins | Bins with >0 counts | Bins with >2000 counts | High rate bins dominated by noise | Noise dominated (total time) | Noise dominated (detector-on time) | Marked lightcurve |
|---|---|---|---|---|---|---|---|
| A | 6621 | 5287 | 0 | 0 | 0.00% | 0.00% | 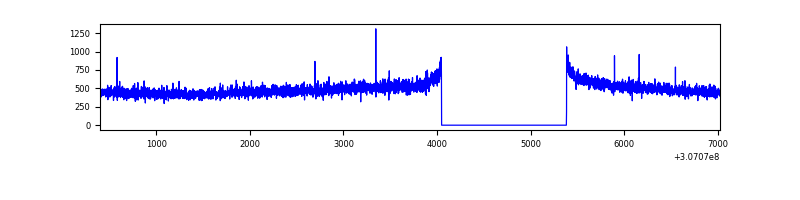 |
| B | 6621 | 5287 | 9 | 9 | 0.14% | 0.17% | 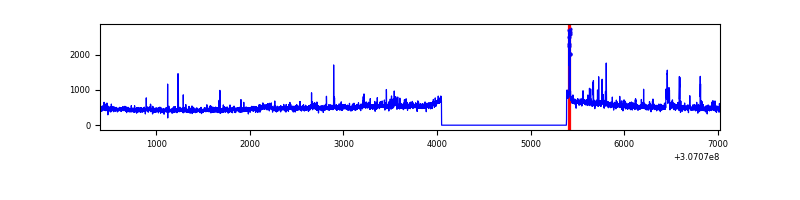 |
| C | 6621 | 5287 | 0 | 0 | 0.00% | 0.00% | 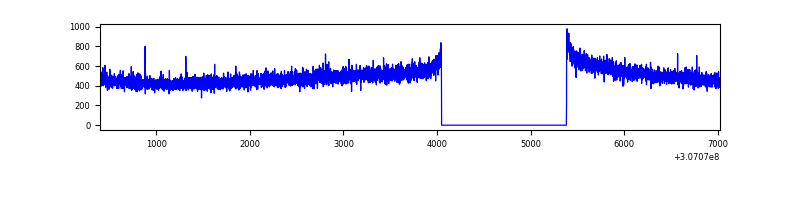 |
| D | 6620 | 5286 | 65 | 65 | 0.98% | 1.23% | 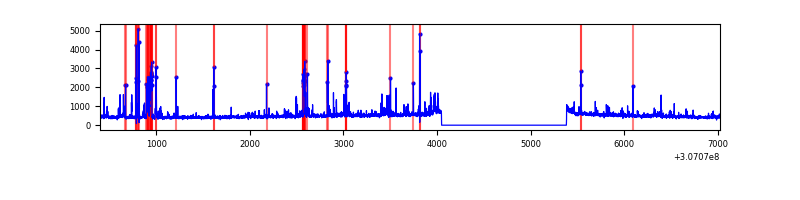 |
Top three noisy pixels from each quadrant. If the there are fewer than three noisy pixels in the level2.evt file, extra rows are filled as -1
| Pixel properties | Quadrant properties | ||||||
|---|---|---|---|---|---|---|---|
| Quadrant | DetID | PixID | Counts | Sigma | Mean | Median | Sigma |
| A | 15 | 236 | 13934 | 99.1 | 663 | 651 | 134.0 |
| A | 13 | 254 | 6316 | 42.27 | 663 | 651 | 134.0 |
| A | 0 | 226 | 5780 | 38.27 | 663 | 651 | 134.0 |
| B | 6 | 36 | 62170 | 491.17 | 666 | 651 | 125.3 |
| B | 0 | 230 | 19999 | 154.47 | 666 | 651 | 125.3 |
| B | 3 | 64 | 15032 | 114.82 | 666 | 651 | 125.3 |
| C | 14 | 238 | 103214 | 693.59 | 638 | 642 | 147.9 |
| C | 13 | 61 | 4368 | 25.2 | 638 | 642 | 147.9 |
| C | 3 | 233 | 3306 | 18.01 | 638 | 642 | 147.9 |
| D | 1 | 52 | 195723 | 1272.37 | 634 | 619 | 153.3 |
| D | 13 | 153 | 122216 | 792.99 | 634 | 619 | 153.3 |
| D | 13 | 104 | 68261 | 441.13 | 634 | 619 | 153.3 |
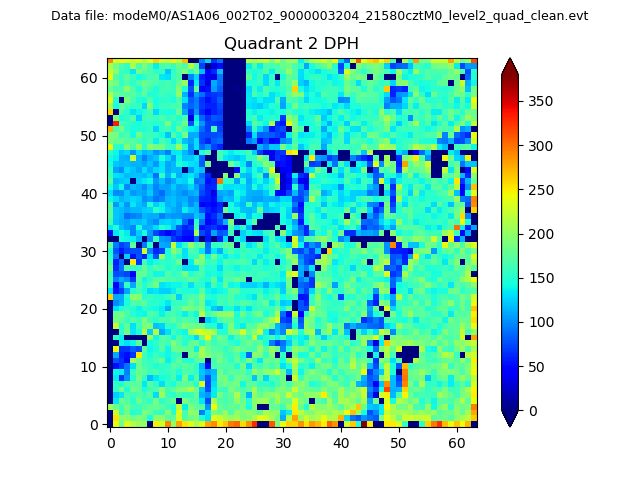
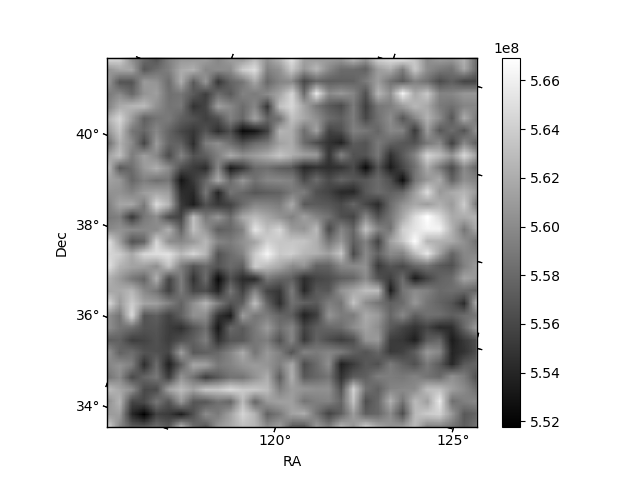
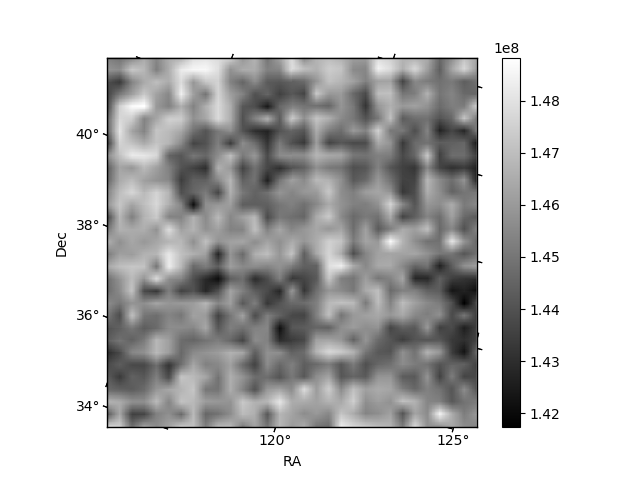
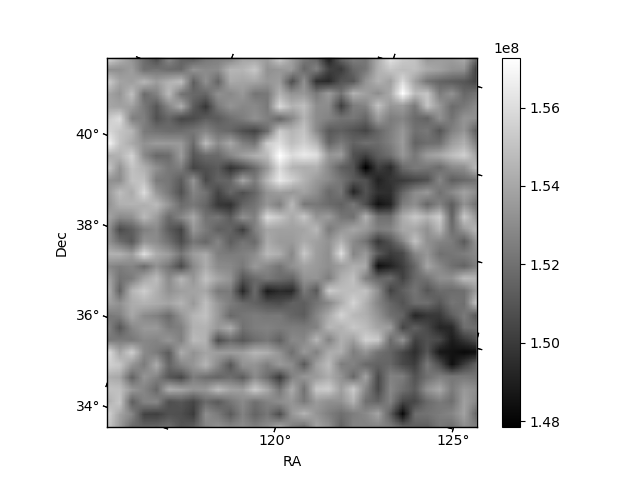
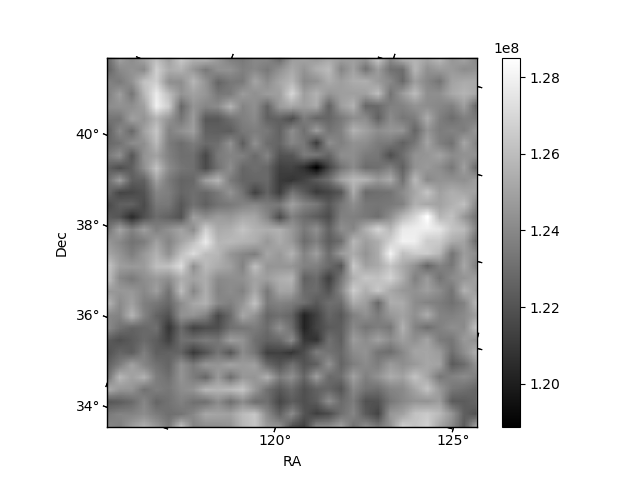
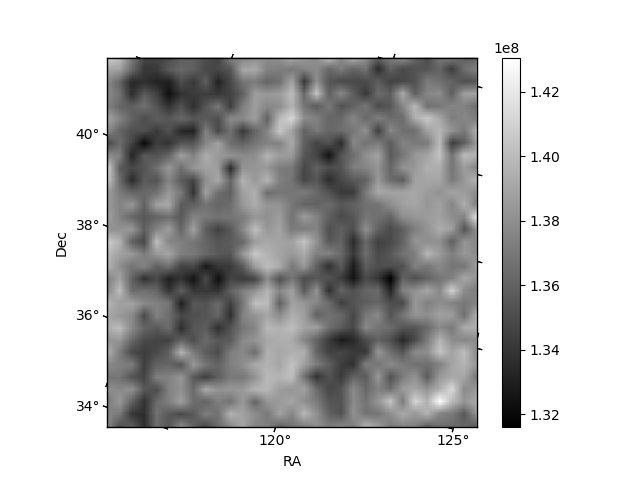
Histogram calculated using DETX and DETY for each event in the final _common_clean file
| Quadrant A | 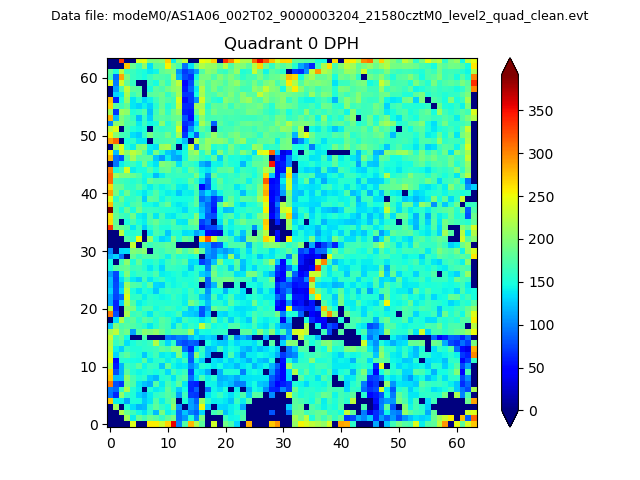 |
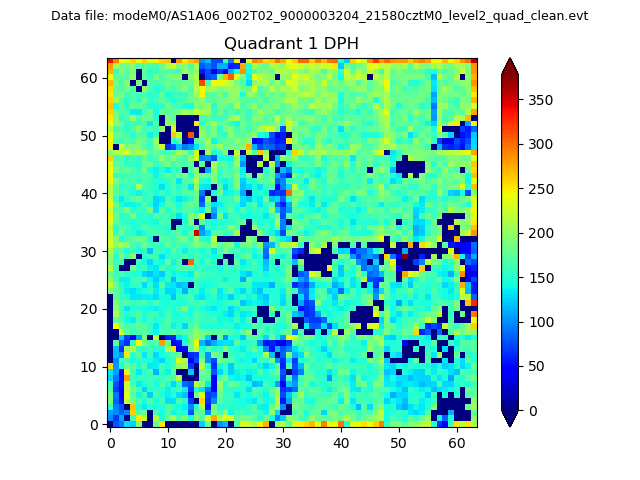 |
Quadrant B |
|---|---|---|---|
| Quadrant D | 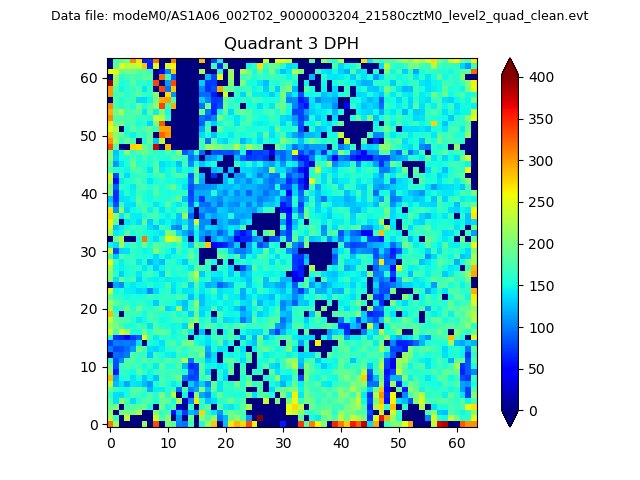 |
 |
Quadrant C |
| Plot type | Count rate plots | Images |
|---|---|---|
| Comparison with Poisson distribution Blue bars denote a histogram of data divided into 1 sec bins. Red curve is a Poisson curve with rate = median count rate of data. |
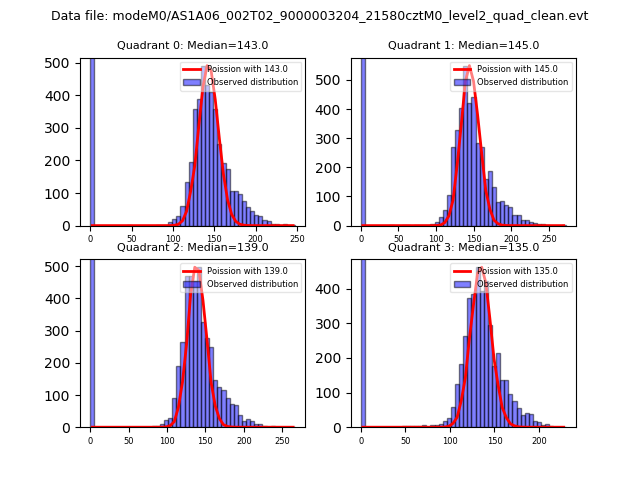 |
 |
| Quadrant-wise count rates Data is divided into 100 sec bins |
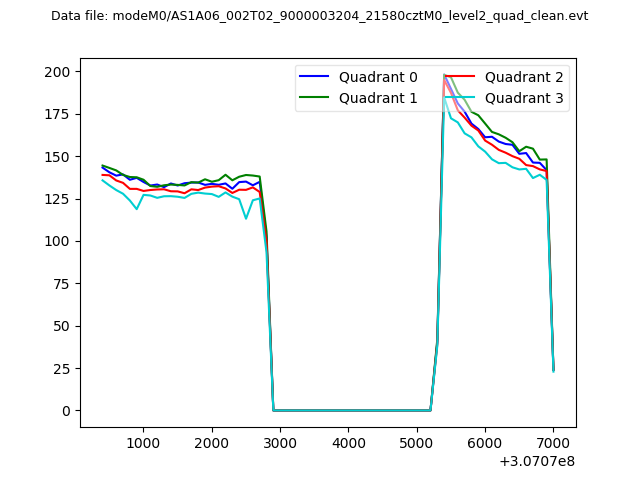 |
|
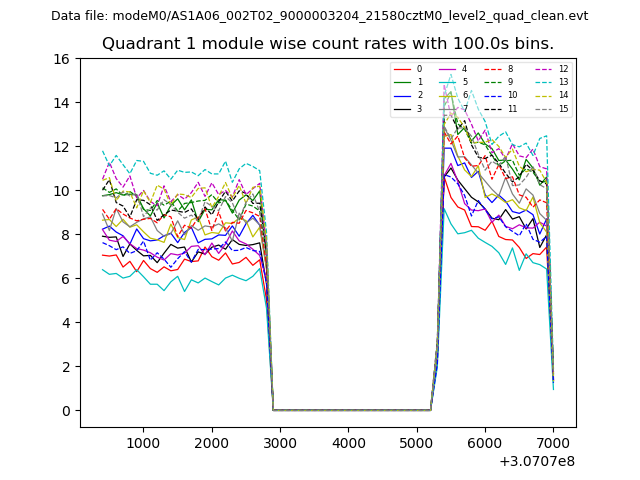
| Module-wise count rates for Quadrant A Data is divided into 100 sec bins |
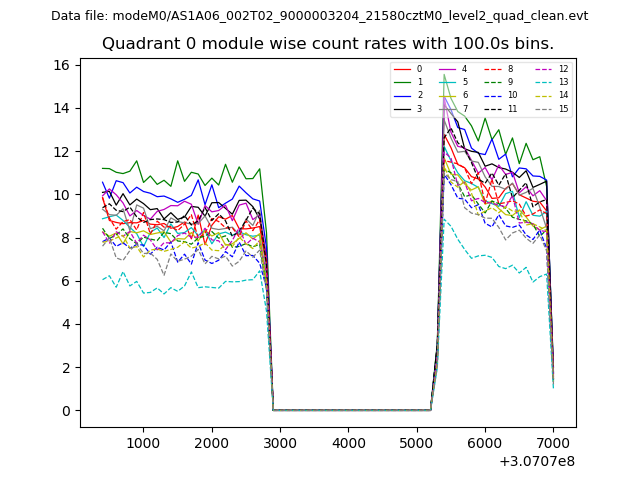 |
 |
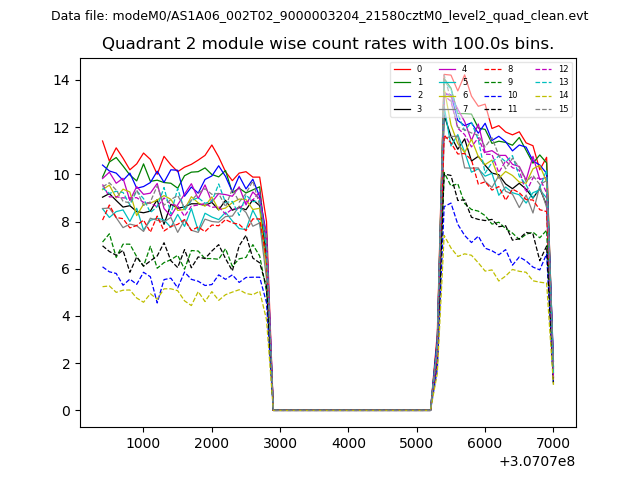
| Module-wise count rates for Quadrant B Data is divided into 100 sec bins |
 |
 |
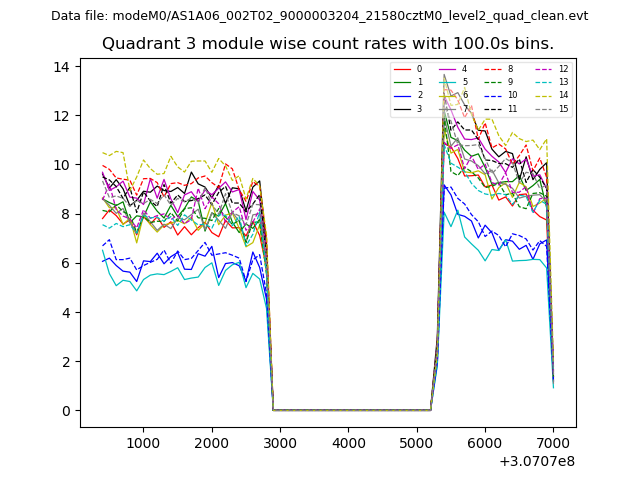
| Module-wise count rates for Quadrant C Data is divided into 100 sec bins |
 |
 |
| Module-wise count rates for Quadrant D Data is divided into 100 sec bins |
 |
 |
| Parameter | Plot |
|---|---|
| CZT HV Monitor | 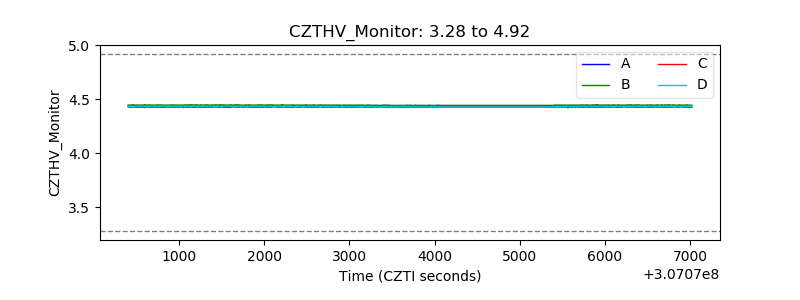 |
| D_VDD | 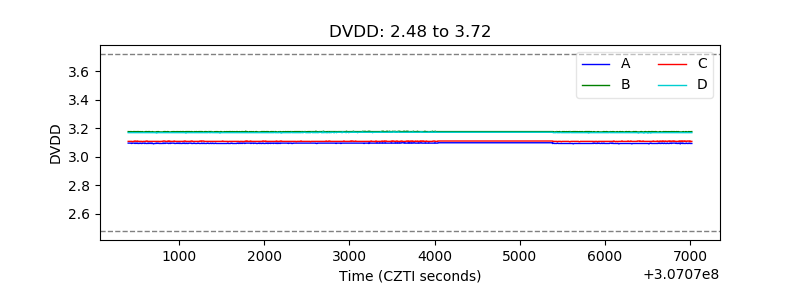 |
| Temperature 1 | 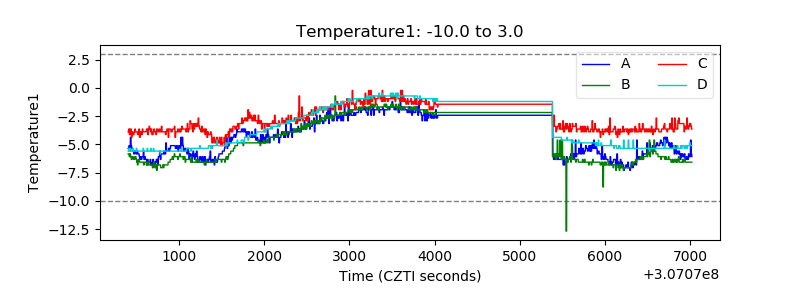 |
| Veto HV Monitor | 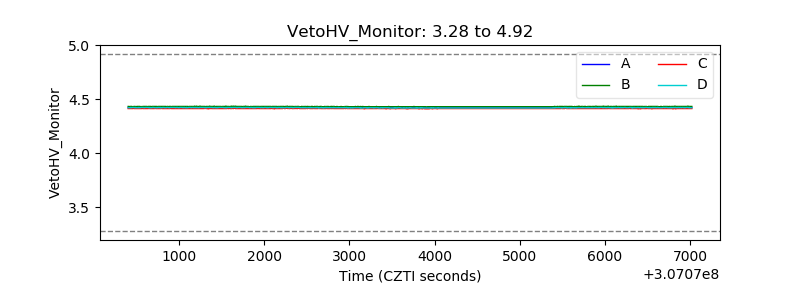 |
| Veto LLD | 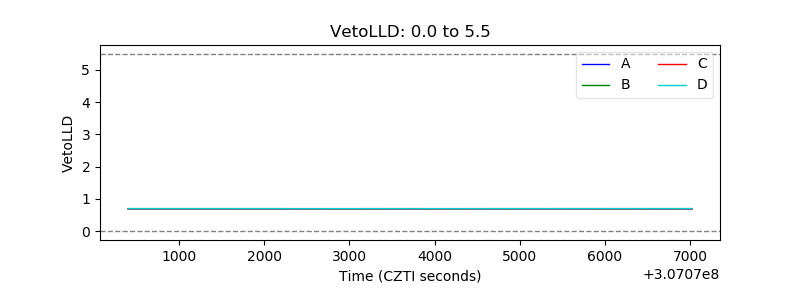 |
| Alpha Counter | 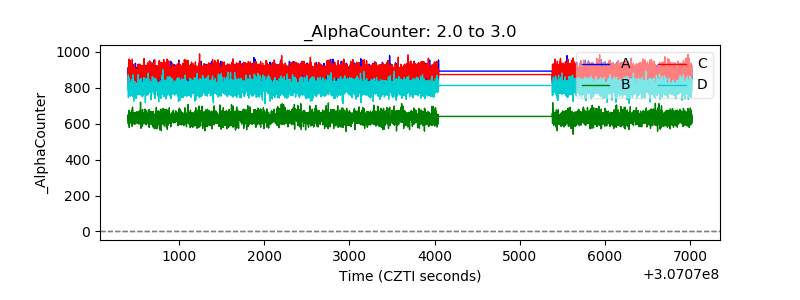 |
| _CPM_Rate | 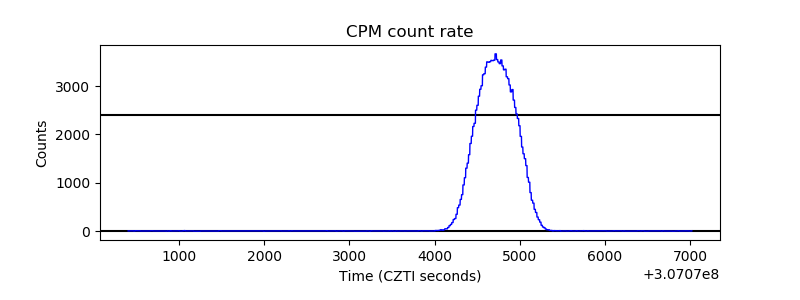 |
| CZT Counter | 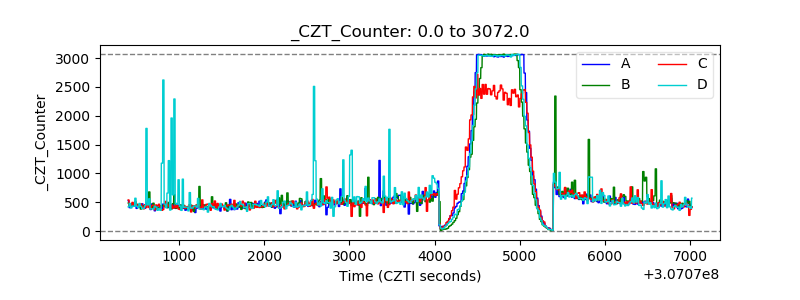 |
| +2.5 Volts monitor |  |
| +5 Volts monitor |  |
| _ROLL_ROT | 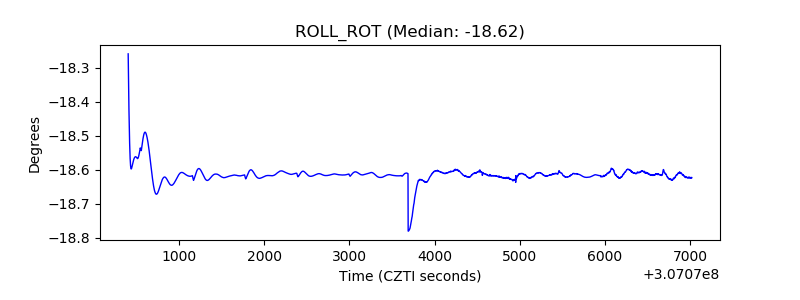 |
| _Roll_DEC | 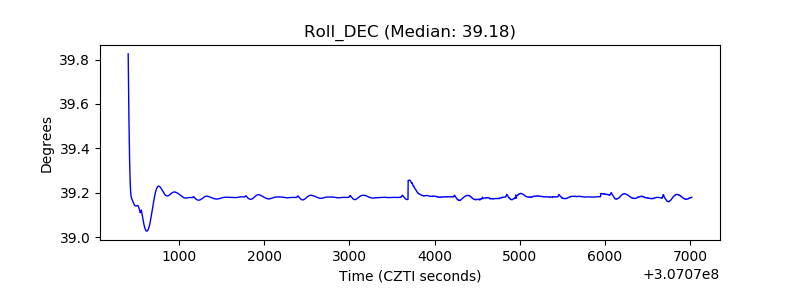 |
| _Roll_RA | 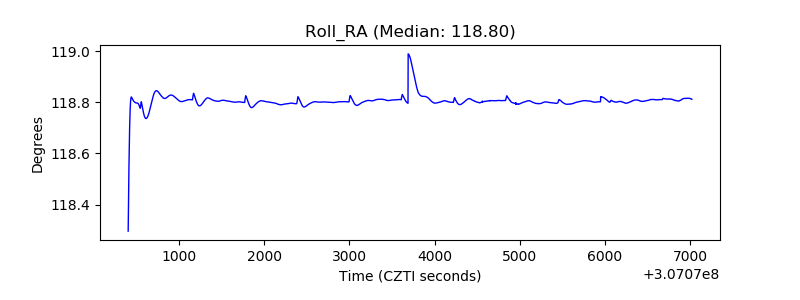 |
| Veto Counter |  |