| Param | Original file | Final file |
|---|---|---|
| Filename | modeM0/AS1A06_002T02_9000003204_21582cztM0_level2.evt | modeM0/AS1A06_002T02_9000003204_21582cztM0_level2_quad_clean.evt |
| Size (bytes) | 504,832,320 | 96,145,920 |
| Size | 481.4 MB | 91.7 MB |
| Events in quadrant A | 4,922,211 | 565,646 |
| Events in quadrant B | 3,231,138 | 667,701 |
| Events in quadrant C | 3,120,004 | 634,372 |
| Events in quadrant D | 3,591,493 | 607,861 |
| Mode M0 | |||
|---|---|---|---|
| Quadrant | BADHDUFLAG | Total packets | Discarded packets |
| A | 0 | 18455 | 0 |
| B | 0 | 13316 | 0 |
| C | 0 | 13016 | 0 |
| D | 0 | 14782 | 0 |
| Mode SS | |||
|---|---|---|---|
| Quadrant | BADHDUFLAG | Total packets | Discarded packets |
| A | 0 | 128 | 0 |
| B | 0 | 128 | 0 |
| C | 0 | 128 | 0 |
| D | 0 | 128 | 0 |
| Mode M9 | |||
|---|---|---|---|
| Quadrant | BADHDUFLAG | Total packets | Discarded packets |
| A | 0 | 14 | 0 |
| B | 0 | 14 | 0 |
| C | 0 | 14 | 0 |
| D | 0 | 14 | 0 |
| Quadrant | Total seconds | Saturated seconds | Saturation percentage |
|---|---|---|---|
| A | 6239 | 824 | 13.207245% |
| B | 6240 | 31 | 0.496795% |
| C | 6240 | 57 | 0.913462% |
| D | 6240 | 143 | 2.291667% |
Noise dominated data is calculated using 1-second bins in cleaned event files. If a bin has >2000 counts, and if more than 50% of those come from <1% of pixels, then it is considered to be noise-dominated and hence unusable.
| Quadrant | # 1 sec bins | Bins with >0 counts | Bins with >2000 counts | High rate bins dominated by noise | Noise dominated (total time) | Noise dominated (detector-on time) | Marked lightcurve |
|---|---|---|---|---|---|---|---|
| A | 7634 | 6240 | 669 | 669 | 8.76% | 10.72% | 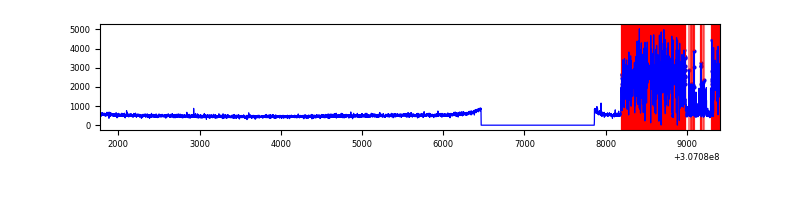 |
| B | 7635 | 6241 | 1 | 1 | 0.01% | 0.02% | 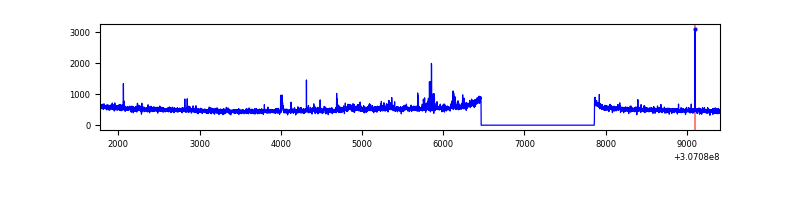 |
| C | 7635 | 6241 | 0 | 0 | 0.00% | 0.00% | 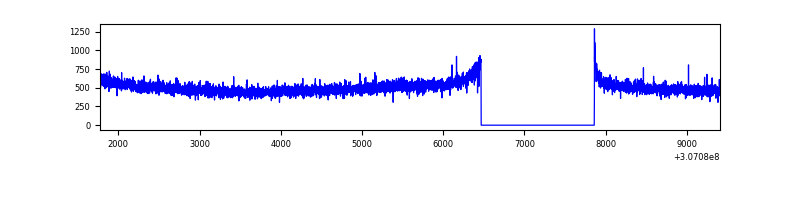 |
| D | 7635 | 6241 | 89 | 89 | 1.17% | 1.43% | 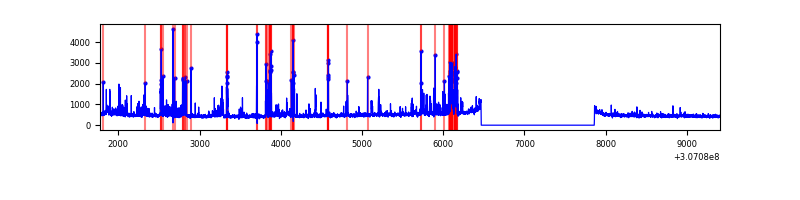 |
Top three noisy pixels from each quadrant. If the there are fewer than three noisy pixels in the level2.evt file, extra rows are filled as -1
| Pixel properties | Quadrant properties | ||||||
|---|---|---|---|---|---|---|---|
| Quadrant | DetID | PixID | Counts | Sigma | Mean | Median | Sigma |
| A | 15 | 236 | 2075714 | 14226.95 | 739 | 726 | 145.8 |
| A | 13 | 254 | 7374 | 45.58 | 739 | 726 | 145.8 |
| A | 0 | 226 | 6532 | 39.81 | 739 | 726 | 145.8 |
| B | 0 | 230 | 21484 | 139.84 | 801 | 784 | 148.0 |
| B | 0 | 190 | 21244 | 138.21 | 801 | 784 | 148.0 |
| B | 6 | 36 | 19428 | 125.95 | 801 | 784 | 148.0 |
| C | 14 | 238 | 123347 | 690.5 | 767 | 773 | 177.5 |
| C | 13 | 61 | 5444 | 26.31 | 767 | 773 | 177.5 |
| C | 7 | 221 | 3221 | 13.79 | 767 | 773 | 177.5 |
| D | 1 | 52 | 591475 | 3229.4 | 763 | 742 | 182.9 |
| D | 2 | 136 | 59945 | 323.65 | 763 | 742 | 182.9 |
| D | 14 | 35 | 26616 | 141.45 | 763 | 742 | 182.9 |
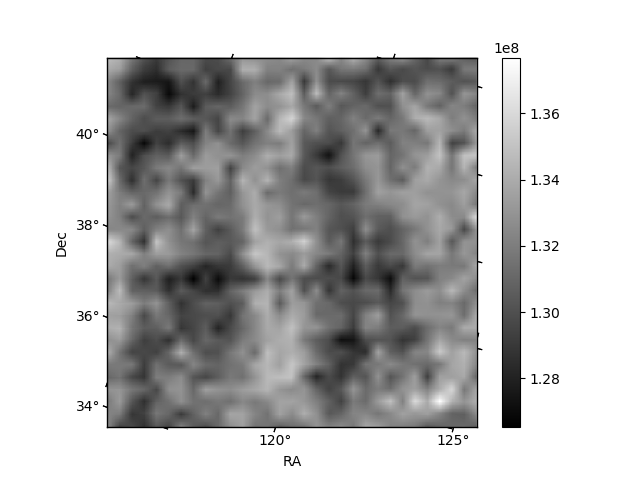
Histogram calculated using DETX and DETY for each event in the final _common_clean file
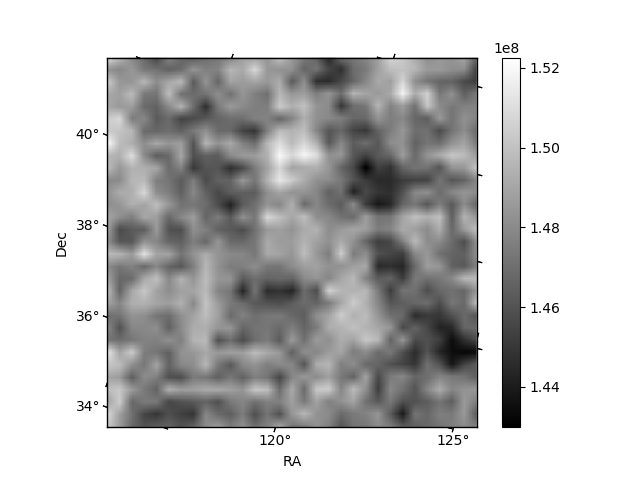
| Quadrant A | 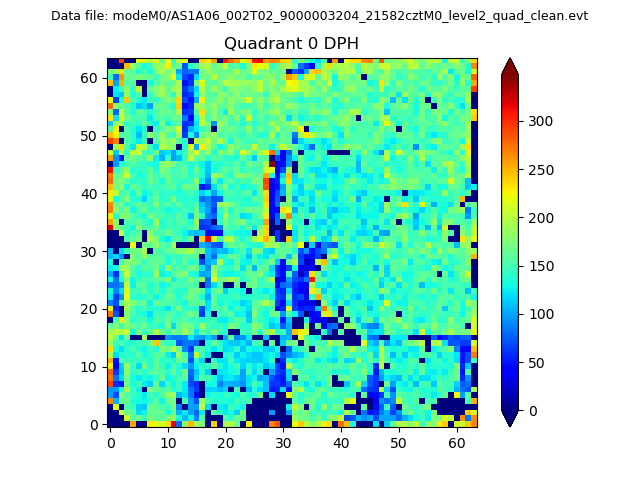 |
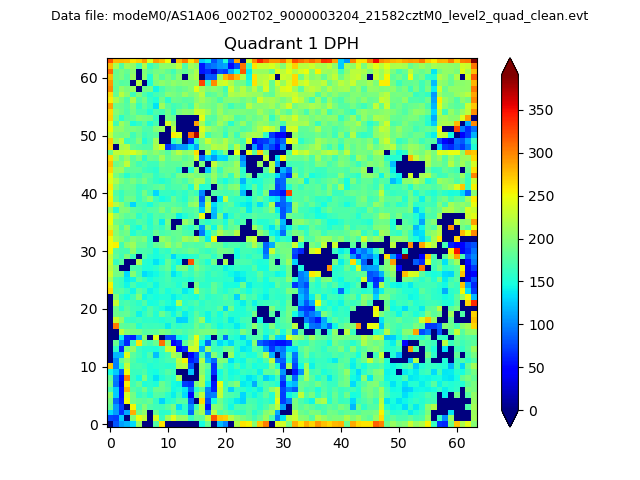 |
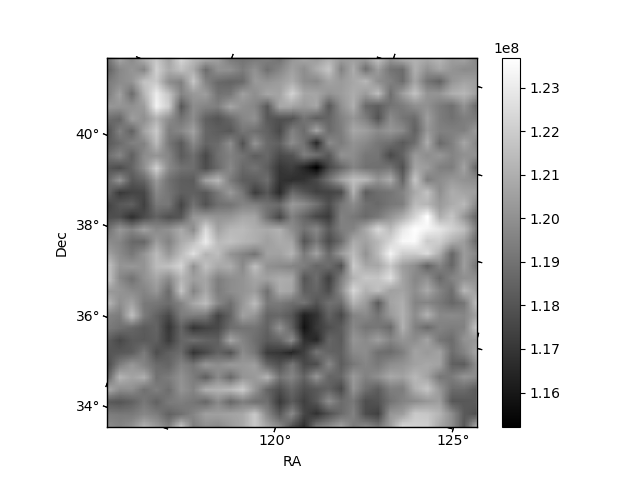
Quadrant B |
|---|---|---|---|
| Quadrant D | 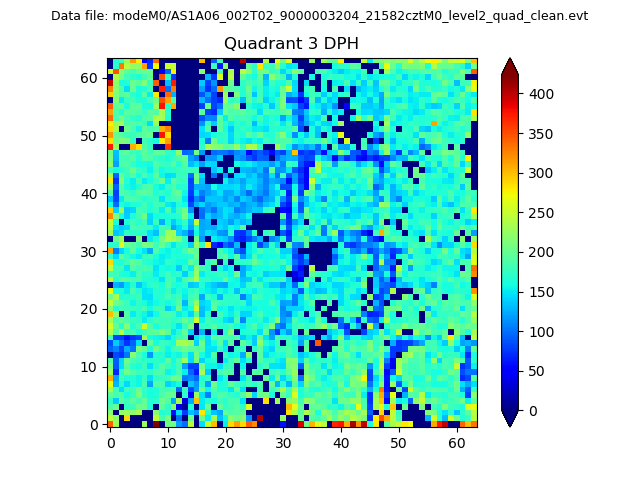 |
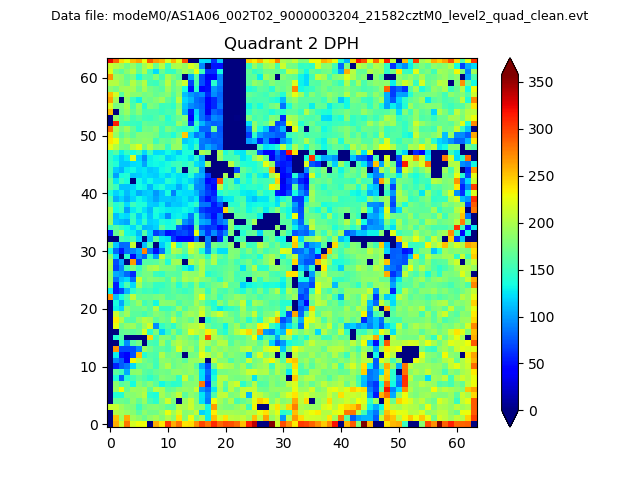 |
Quadrant C |
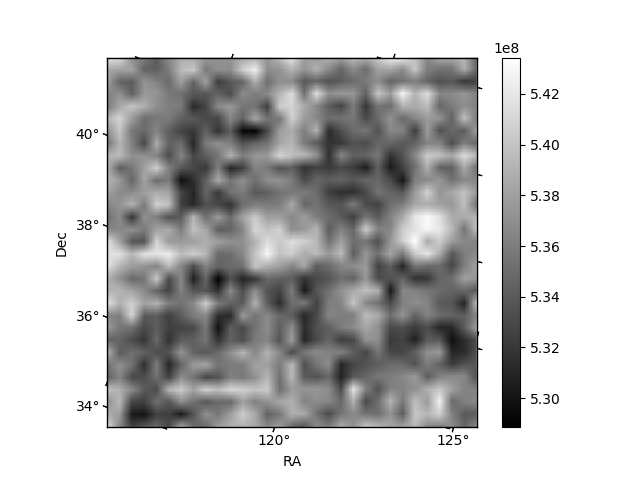
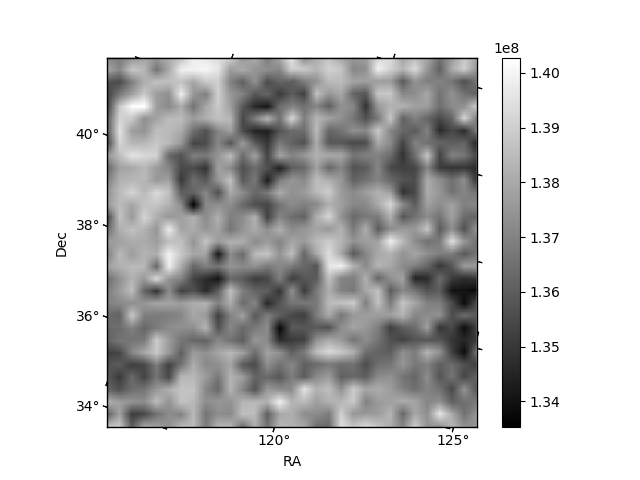
| Plot type | Count rate plots | Images |
|---|---|---|
| Comparison with Poisson distribution Blue bars denote a histogram of data divided into 1 sec bins. Red curve is a Poisson curve with rate = median count rate of data. |
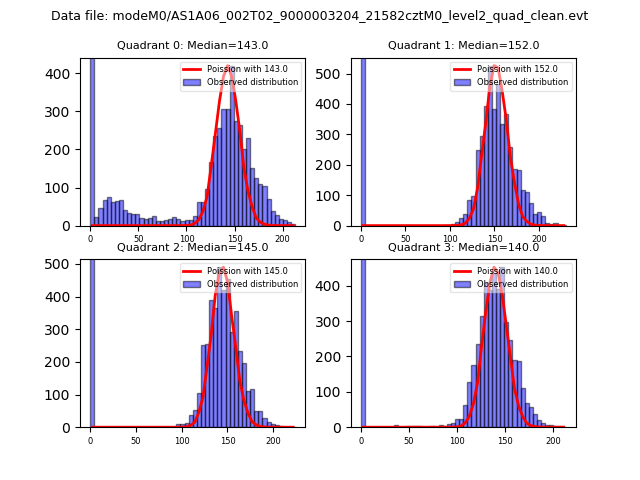 |
 |
| Quadrant-wise count rates Data is divided into 100 sec bins |
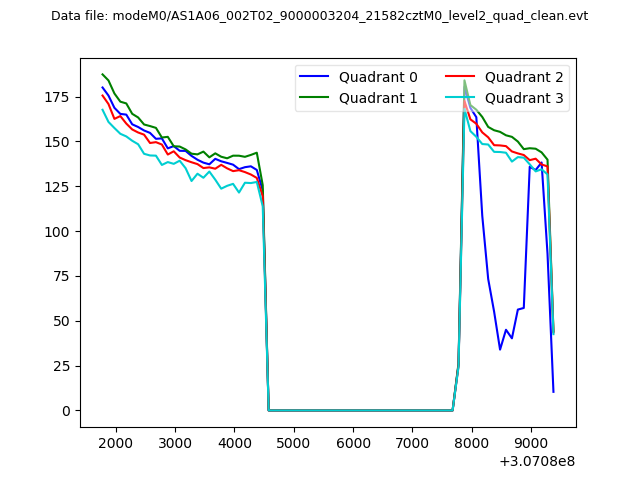 |
|
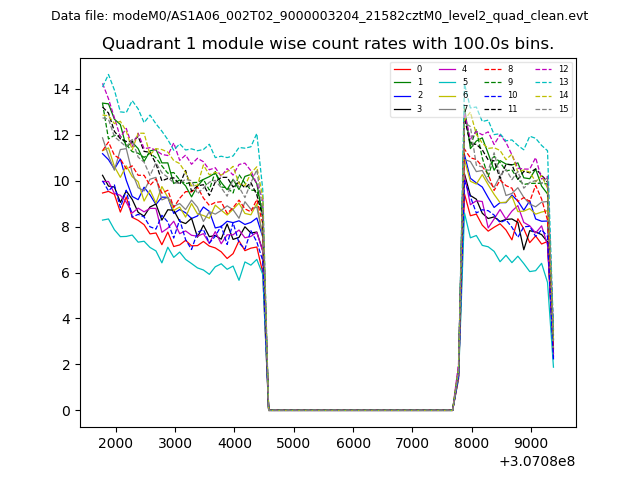
| Module-wise count rates for Quadrant A Data is divided into 100 sec bins |
 |
 |
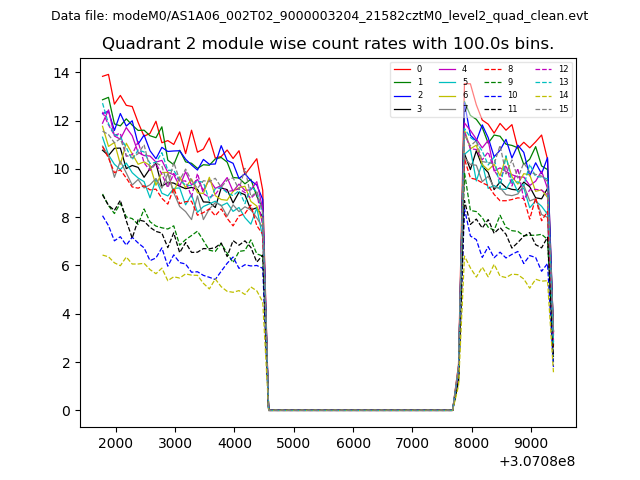
| Module-wise count rates for Quadrant B Data is divided into 100 sec bins |
 |
 |
| Module-wise count rates for Quadrant C Data is divided into 100 sec bins |
 |
 |
| Module-wise count rates for Quadrant D Data is divided into 100 sec bins |
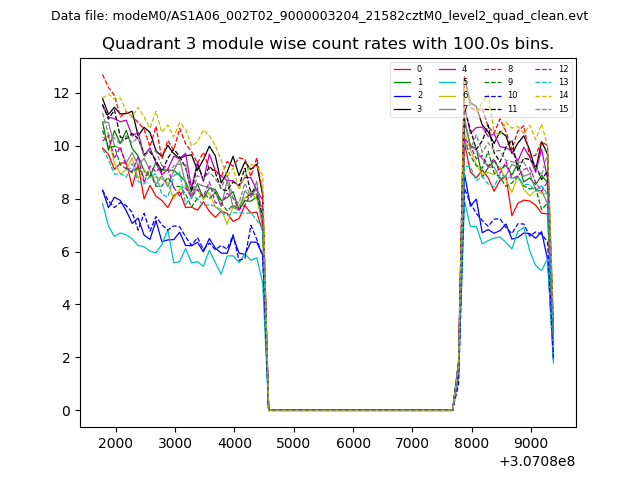 |
 |
| Parameter | Plot |
|---|---|
| CZT HV Monitor | 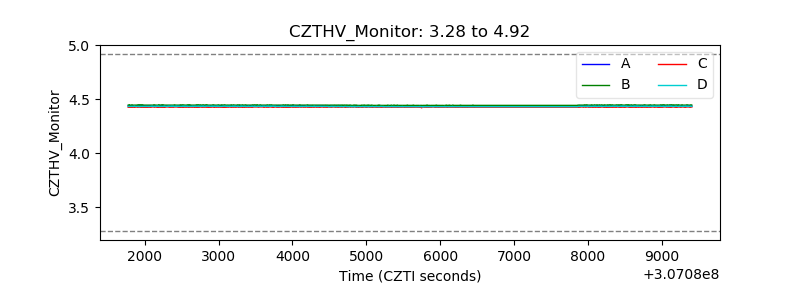 |
| D_VDD | 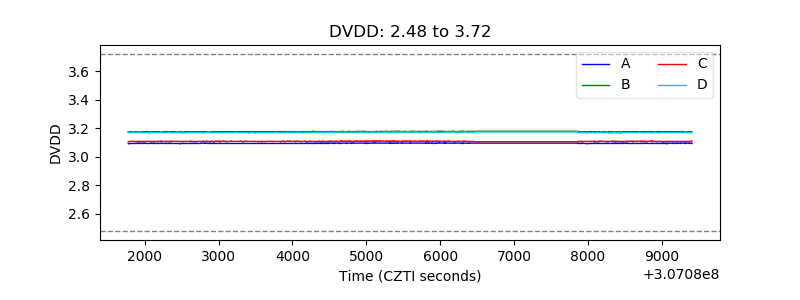 |
| Temperature 1 |  |
| Veto HV Monitor | 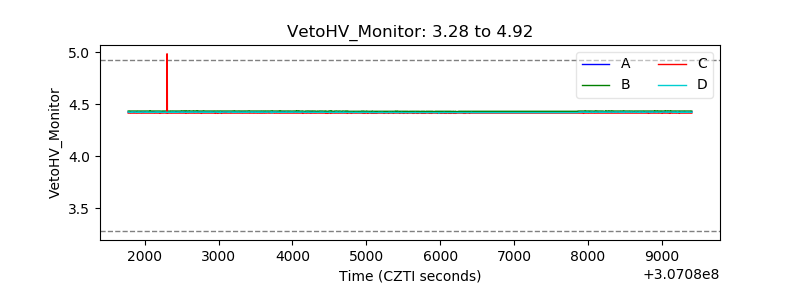 |
| Veto LLD | 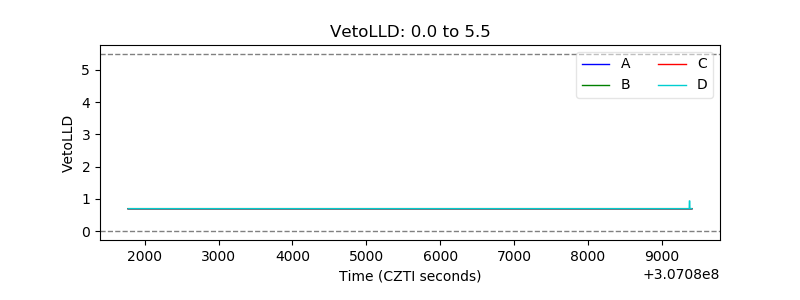 |
| Alpha Counter | 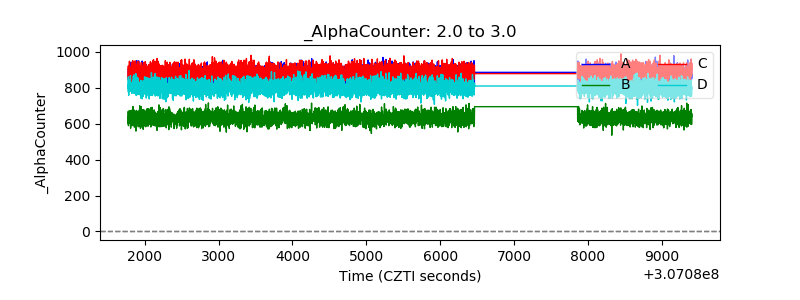 |
| _CPM_Rate | 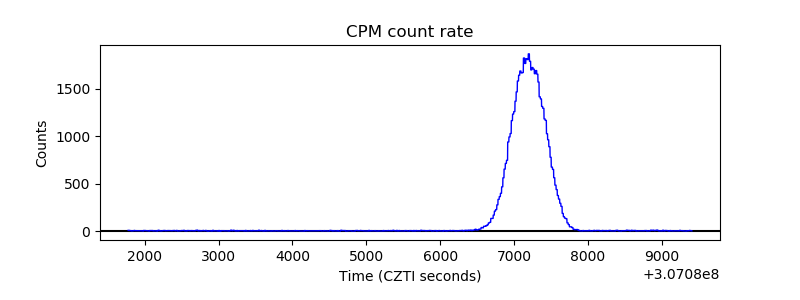 |
| CZT Counter | 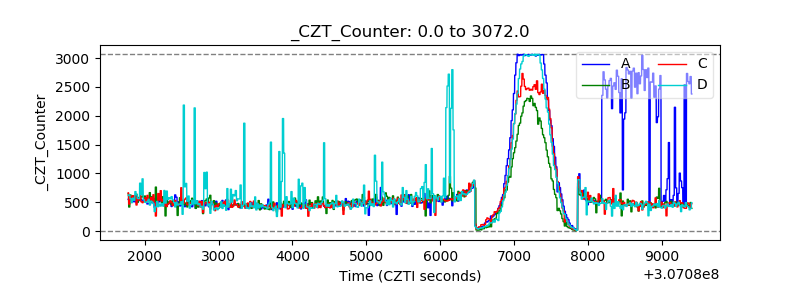 |
| +2.5 Volts monitor |  |
| +5 Volts monitor |  |
| _ROLL_ROT | 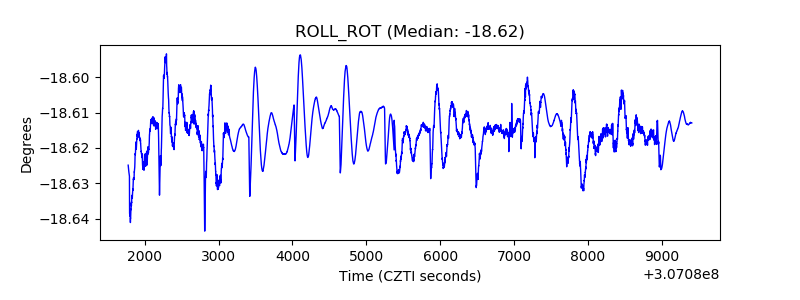 |
| _Roll_DEC | 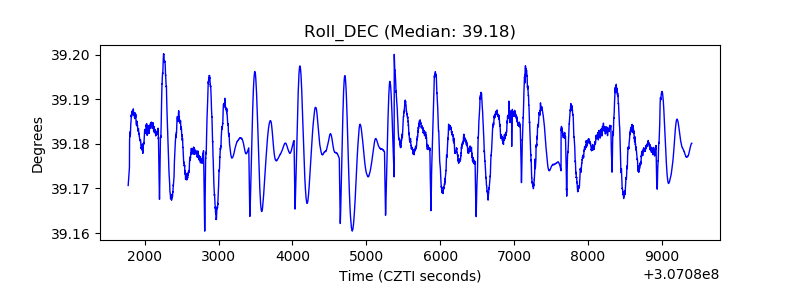 |
| _Roll_RA | 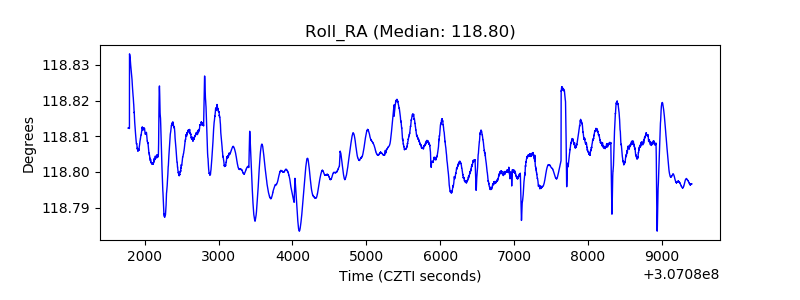 |
| Veto Counter |  |