| Param | Original file | Final file |
|---|---|---|
| Filename | modeM0/AS1A06_002T02_9000003204_21583cztM0_level2.evt | modeM0/AS1A06_002T02_9000003204_21583cztM0_level2_quad_clean.evt |
| Size (bytes) | 556,200,000 | 78,791,040 |
| Size | 530.4 MB | 75.1 MB |
| Events in quadrant A | 7,350,996 | 417,490 |
| Events in quadrant B | 3,012,093 | 539,398 |
| Events in quadrant C | 2,887,489 | 515,649 |
| Events in quadrant D | 3,195,174 | 502,313 |
| Mode M0 | |||
|---|---|---|---|
| Quadrant | BADHDUFLAG | Total packets | Discarded packets |
| A | 0 | 25661 | 0 |
| B | 0 | 12541 | 0 |
| C | 0 | 12214 | 0 |
| D | 0 | 13476 | 0 |
| Mode SS | |||
|---|---|---|---|
| Quadrant | BADHDUFLAG | Total packets | Discarded packets |
| A | 0 | 118 | 0 |
| B | 0 | 118 | 0 |
| C | 0 | 118 | 0 |
| D | 0 | 118 | 0 |
| Mode M9 | |||
|---|---|---|---|
| Quadrant | BADHDUFLAG | Total packets | Discarded packets |
| A | 0 | 13 | 0 |
| B | 0 | 13 | 0 |
| C | 0 | 13 | 0 |
| D | 0 | 13 | 0 |
| Quadrant | Total seconds | Saturated seconds | Saturation percentage |
|---|---|---|---|
| A | 5879 | 2006 | 34.121449% |
| B | 5880 | 74 | 1.258503% |
| C | 5880 | 85 | 1.445578% |
| D | 5880 | 87 | 1.479592% |
Noise dominated data is calculated using 1-second bins in cleaned event files. If a bin has >2000 counts, and if more than 50% of those come from <1% of pixels, then it is considered to be noise-dominated and hence unusable.
| Quadrant | # 1 sec bins | Bins with >0 counts | Bins with >2000 counts | High rate bins dominated by noise | Noise dominated (total time) | Noise dominated (detector-on time) | Marked lightcurve |
|---|---|---|---|---|---|---|---|
| A | 7119 | 5880 | 1653 | 1653 | 23.22% | 28.11% | 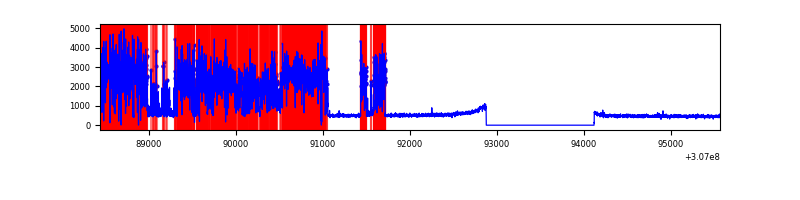 |
| B | 7120 | 5881 | 1 | 1 | 0.01% | 0.02% | 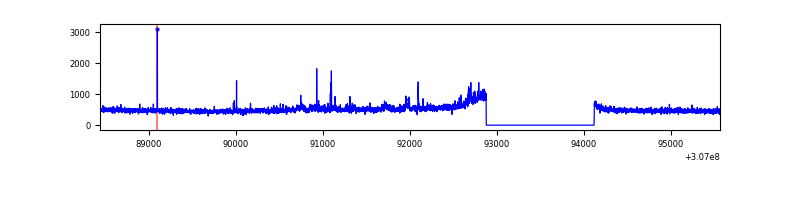 |
| C | 7120 | 5881 | 0 | 0 | 0.00% | 0.00% | 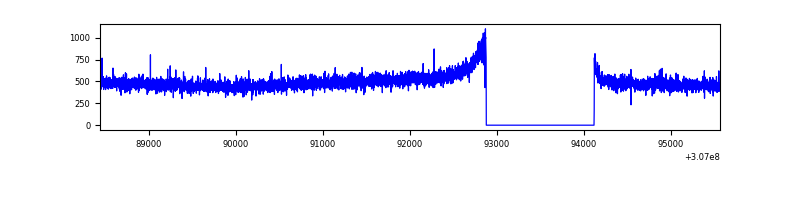 |
| D | 7120 | 5881 | 37 | 37 | 0.52% | 0.63% | 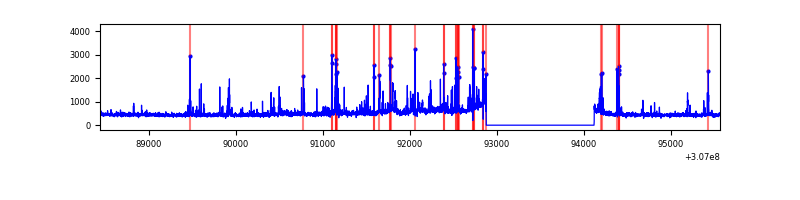 |
Top three noisy pixels from each quadrant. If the there are fewer than three noisy pixels in the level2.evt file, extra rows are filled as -1
| Pixel properties | Quadrant properties | ||||||
|---|---|---|---|---|---|---|---|
| Quadrant | DetID | PixID | Counts | Sigma | Mean | Median | Sigma |
| A | 15 | 236 | 5015578 | 41320.17 | 606 | 596 | 121.4 |
| A | 13 | 254 | 6313 | 47.1 | 606 | 596 | 121.4 |
| A | 0 | 226 | 5294 | 38.71 | 606 | 596 | 121.4 |
| B | 0 | 228 | 27613 | 194.07 | 739 | 724 | 138.6 |
| B | 0 | 230 | 26282 | 184.46 | 739 | 724 | 138.6 |
| B | 0 | 190 | 25565 | 179.29 | 739 | 724 | 138.6 |
| C | 14 | 238 | 113522 | 676.43 | 710 | 713 | 166.8 |
| C | 13 | 61 | 4970 | 25.53 | 710 | 713 | 166.8 |
| C | 4 | 223 | 4724 | 24.05 | 710 | 713 | 166.8 |
| D | 1 | 52 | 201899 | 1165.43 | 718 | 699 | 172.6 |
| D | 2 | 136 | 136216 | 784.97 | 718 | 699 | 172.6 |
| D | 7 | 38 | 40268 | 229.2 | 718 | 699 | 172.6 |
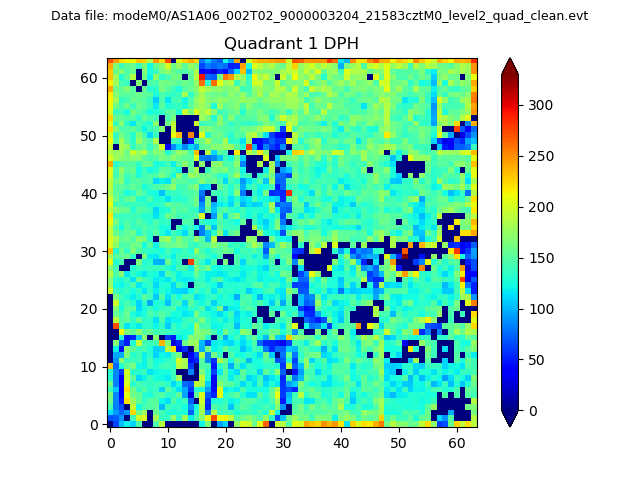
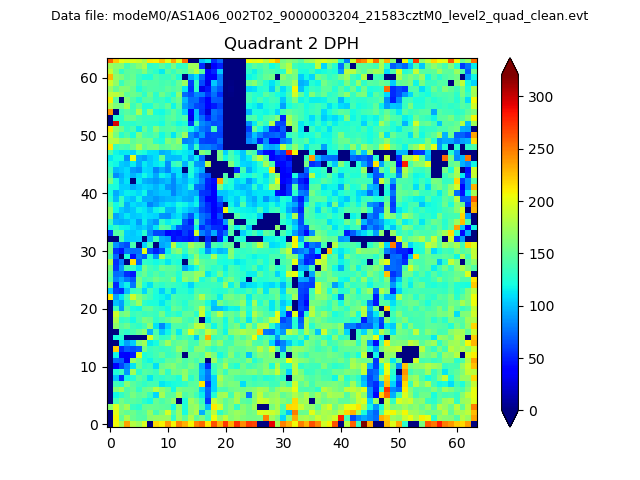
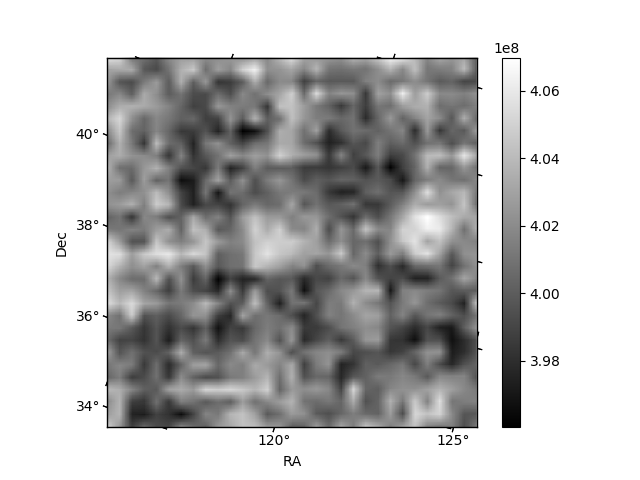
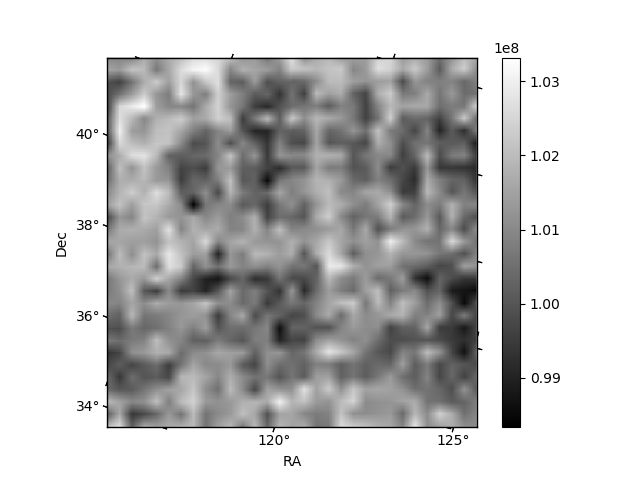
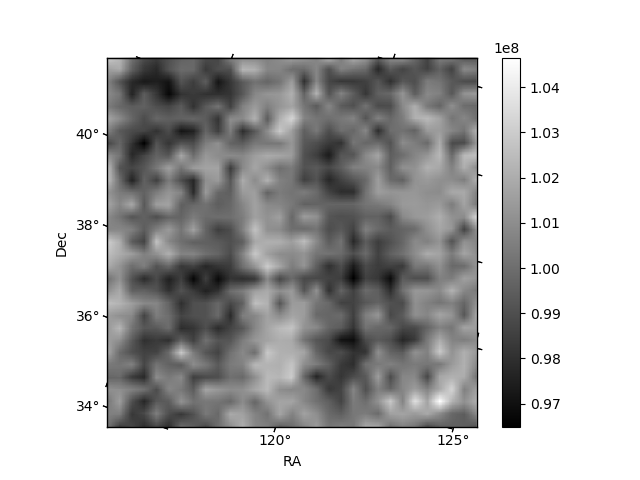
Histogram calculated using DETX and DETY for each event in the final _common_clean file
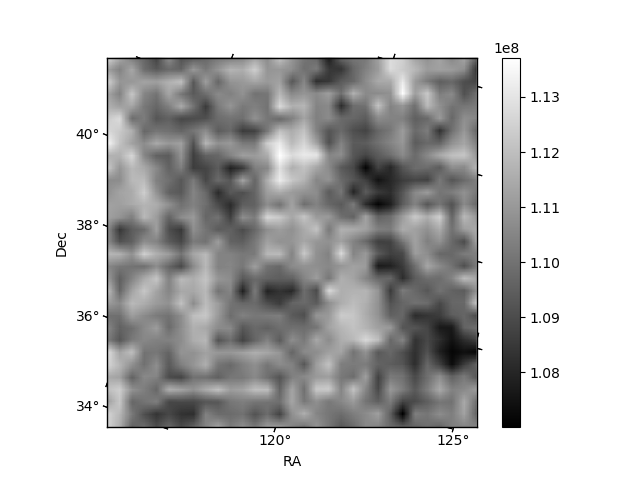
| Quadrant A |  |
 |
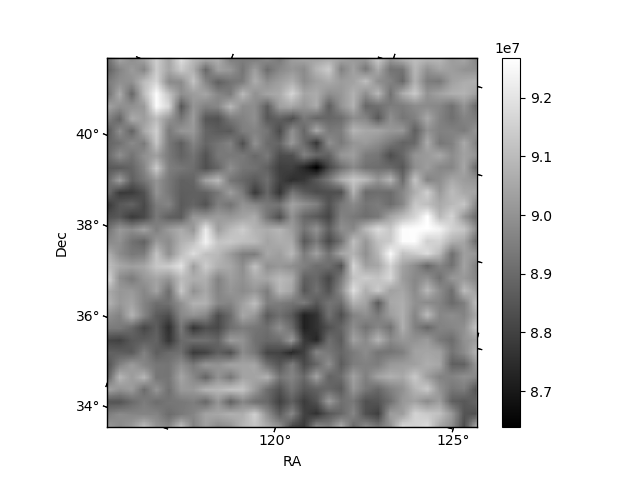
Quadrant B |
|---|---|---|---|
| Quadrant D | 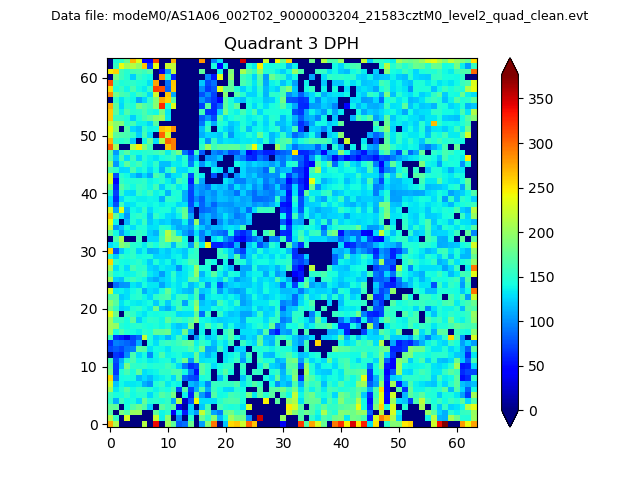 |
 |
Quadrant C |
| Plot type | Count rate plots | Images |
|---|---|---|
| Comparison with Poisson distribution Blue bars denote a histogram of data divided into 1 sec bins. Red curve is a Poisson curve with rate = median count rate of data. |
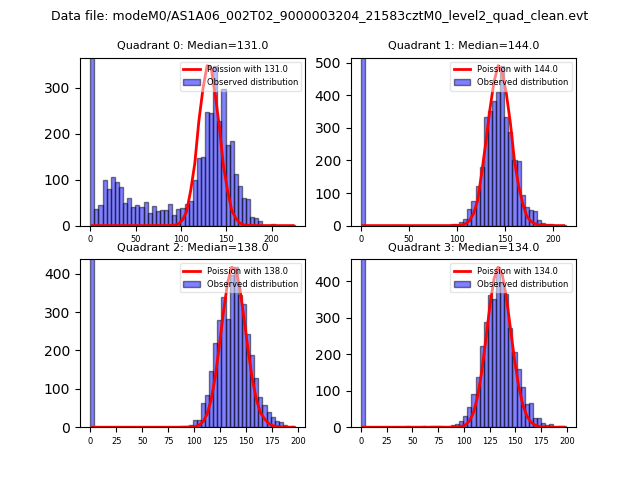 |
 |
| Quadrant-wise count rates Data is divided into 100 sec bins |
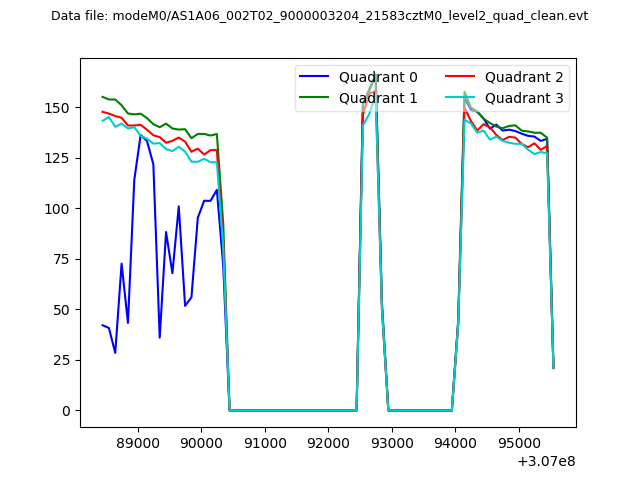 |
|
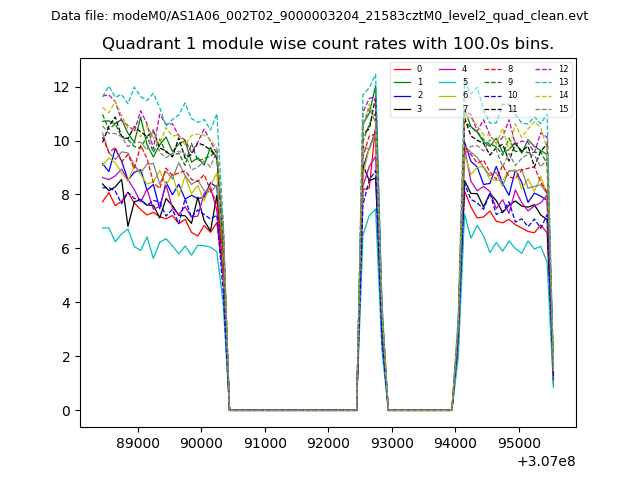
| Module-wise count rates for Quadrant A Data is divided into 100 sec bins |
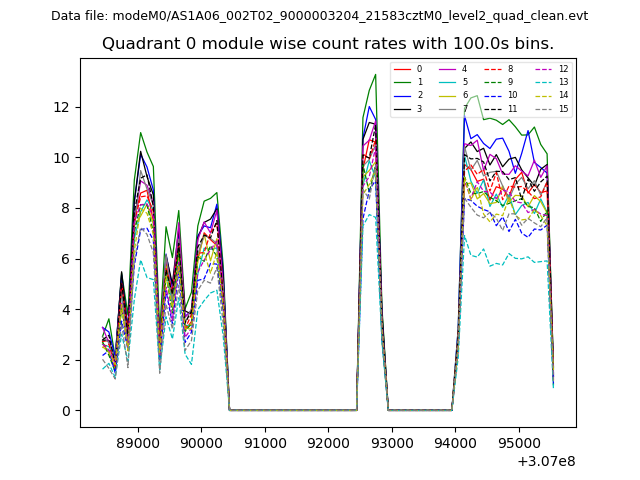 |
 |
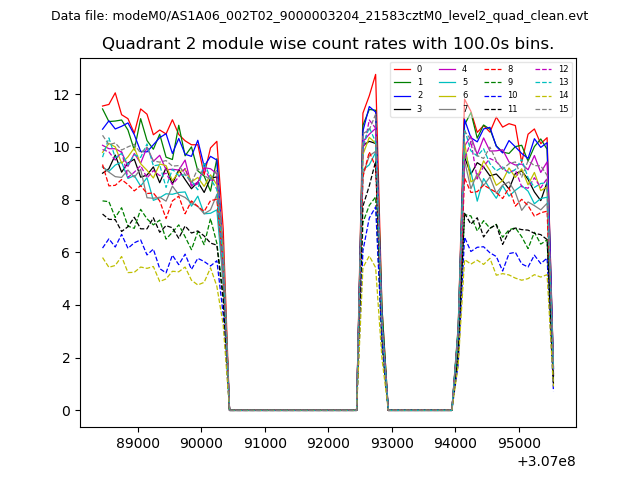
| Module-wise count rates for Quadrant B Data is divided into 100 sec bins |
 |
 |
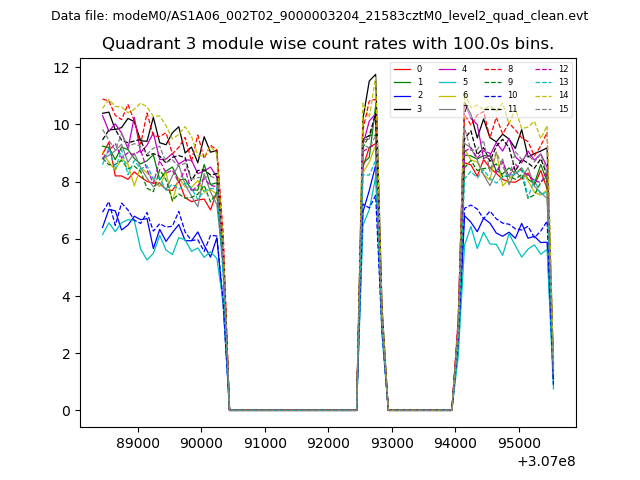
| Module-wise count rates for Quadrant C Data is divided into 100 sec bins |
 |
 |
| Module-wise count rates for Quadrant D Data is divided into 100 sec bins |
 |
 |
| Parameter | Plot |
|---|---|
| CZT HV Monitor | 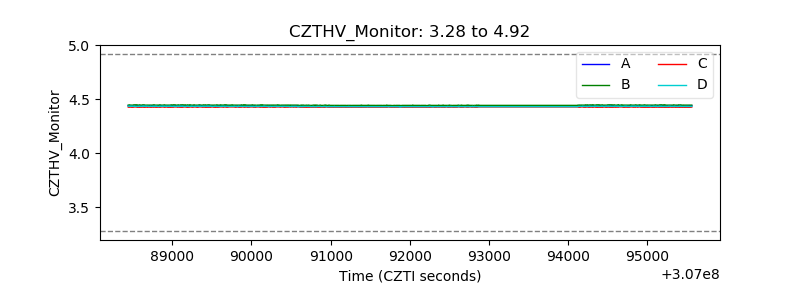 |
| D_VDD | 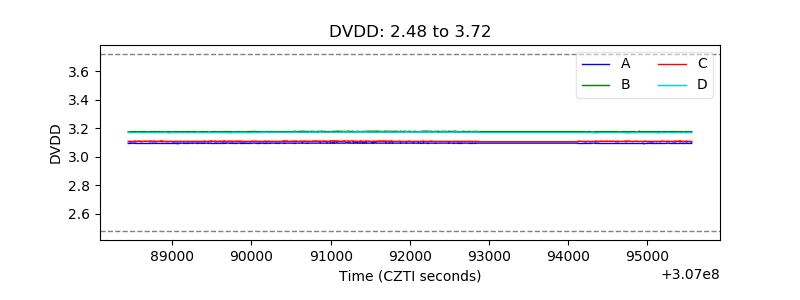 |
| Temperature 1 | 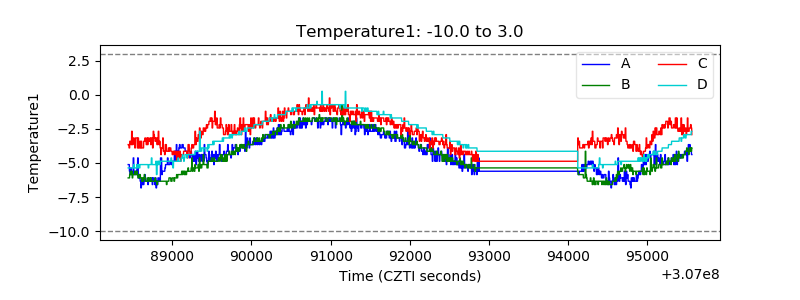 |
| Veto HV Monitor | 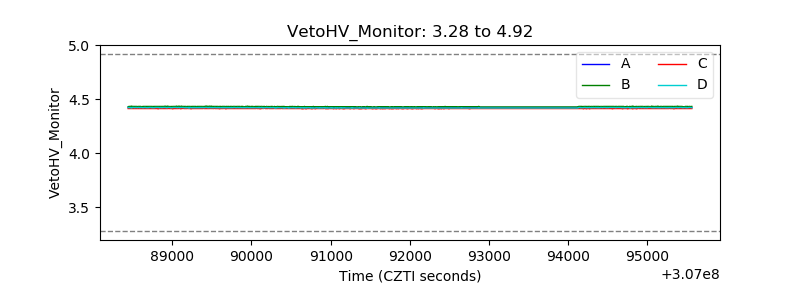 |
| Veto LLD | 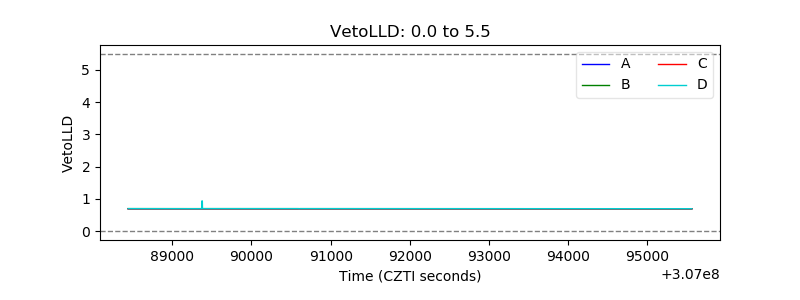 |
| Alpha Counter | 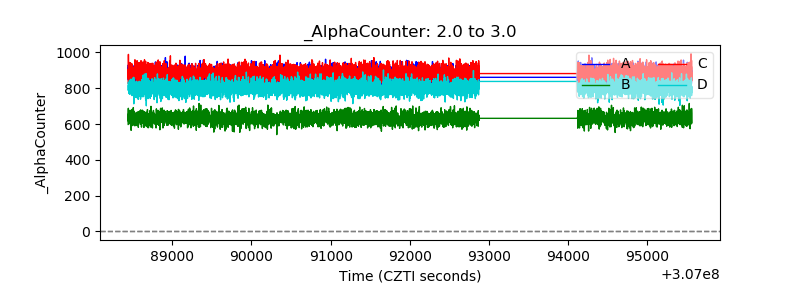 |
| _CPM_Rate | 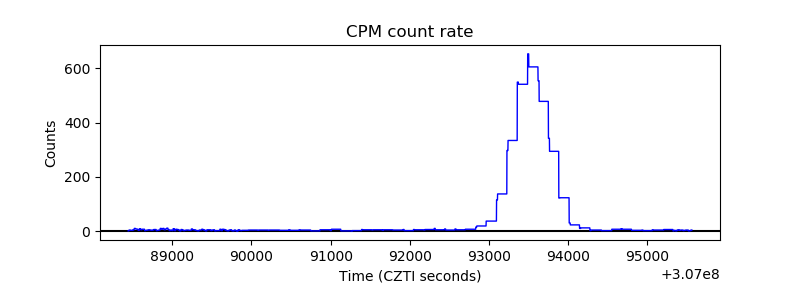 |
| CZT Counter | 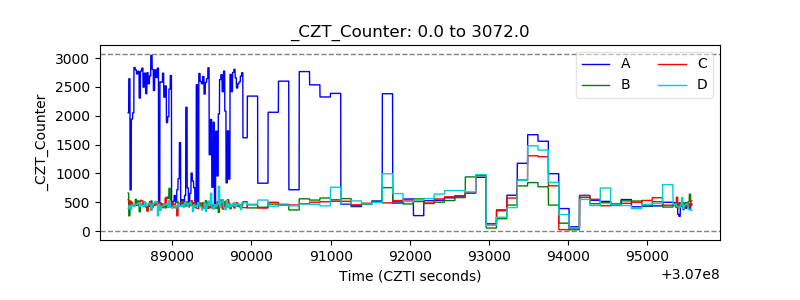 |
| +2.5 Volts monitor |  |
| +5 Volts monitor |  |
| _ROLL_ROT | 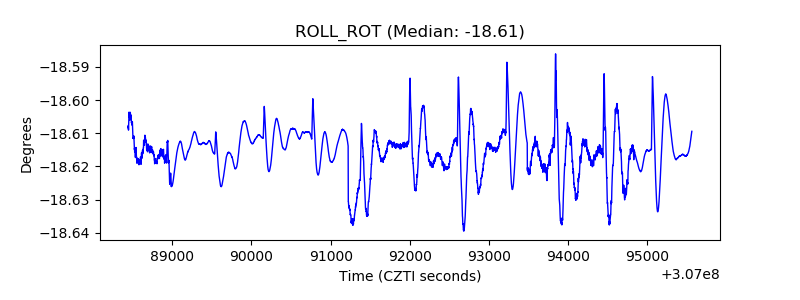 |
| _Roll_DEC | 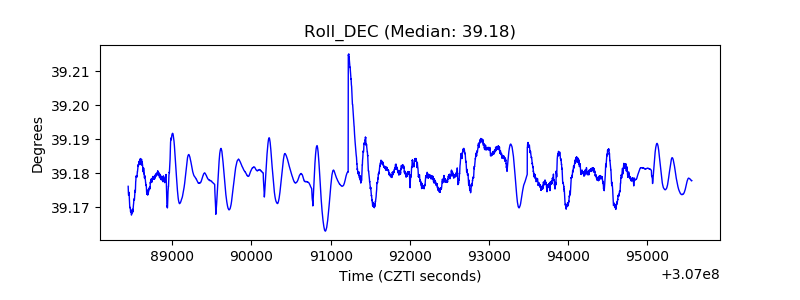 |
| _Roll_RA | 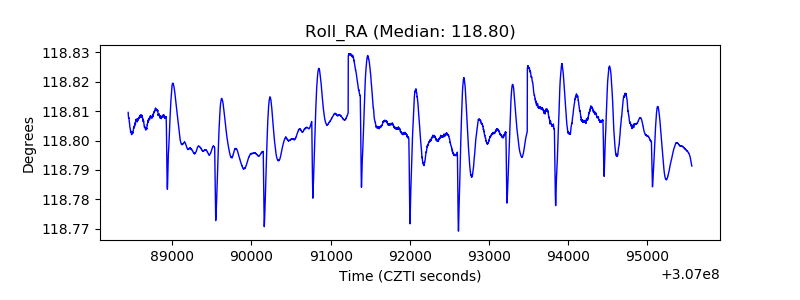 |
| Veto Counter | 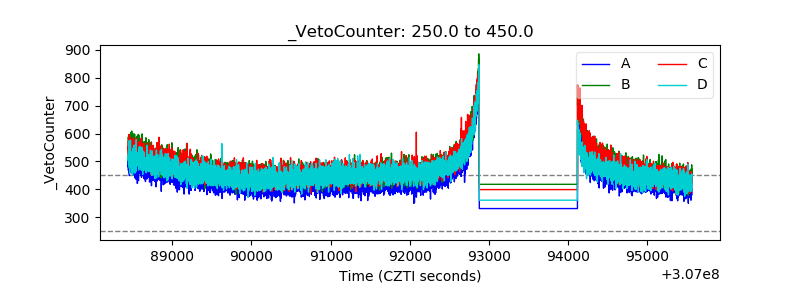 |