| Param | Original file | Final file |
|---|---|---|
| Filename | modeM0/AS1A06_002T02_9000003204_21584cztM0_level2.evt | modeM0/AS1A06_002T02_9000003204_21584cztM0_level2_quad_clean.evt |
| Size (bytes) | 482,446,080 | 91,477,440 |
| Size | 460.1 MB | 87.2 MB |
| Events in quadrant A | 3,111,691 | 591,467 |
| Events in quadrant B | 3,296,998 | 598,970 |
| Events in quadrant C | 3,095,233 | 578,758 |
| Events in quadrant D | 4,664,102 | 546,136 |
| Mode M0 | |||
|---|---|---|---|
| Quadrant | BADHDUFLAG | Total packets | Discarded packets |
| A | 0 | 13286 | 0 |
| B | 0 | 13776 | 0 |
| C | 0 | 13294 | 0 |
| D | 0 | 18260 | 0 |
| Mode SS | |||
|---|---|---|---|
| Quadrant | BADHDUFLAG | Total packets | Discarded packets |
| A | 0 | 130 | 0 |
| B | 0 | 130 | 0 |
| C | 0 | 130 | 0 |
| D | 0 | 130 | 0 |
| Mode M9 | |||
|---|---|---|---|
| Quadrant | BADHDUFLAG | Total packets | Discarded packets |
| A | 0 | 10 | 0 |
| B | 0 | 10 | 0 |
| C | 0 | 10 | 0 |
| D | 0 | 10 | 0 |
| Quadrant | Total seconds | Saturated seconds | Saturation percentage |
|---|---|---|---|
| A | 6529 | 23 | 0.352274% |
| B | 6529 | 64 | 0.980242% |
| C | 6529 | 40 | 0.612651% |
| D | 6529 | 370 | 5.667024% |
Noise dominated data is calculated using 1-second bins in cleaned event files. If a bin has >2000 counts, and if more than 50% of those come from <1% of pixels, then it is considered to be noise-dominated and hence unusable.
| Quadrant | # 1 sec bins | Bins with >0 counts | Bins with >2000 counts | High rate bins dominated by noise | Noise dominated (total time) | Noise dominated (detector-on time) | Marked lightcurve |
|---|---|---|---|---|---|---|---|
| A | 7459 | 6530 | 0 | 0 | 0.00% | 0.00% |  |
| B | 7459 | 6530 | 22 | 22 | 0.29% | 0.34% | 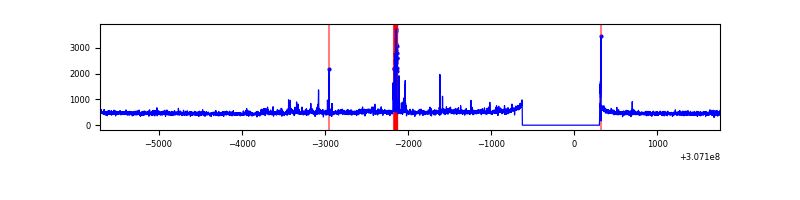 |
| C | 7459 | 6530 | 0 | 0 | 0.00% | 0.00% | 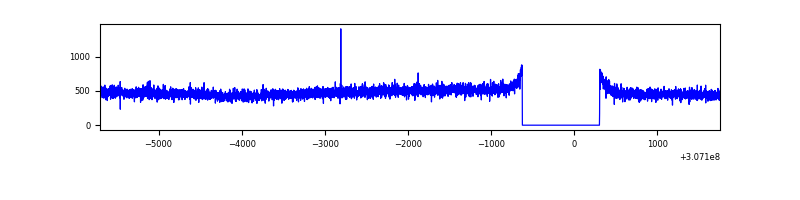 |
| D | 7459 | 6530 | 313 | 313 | 4.20% | 4.79% | 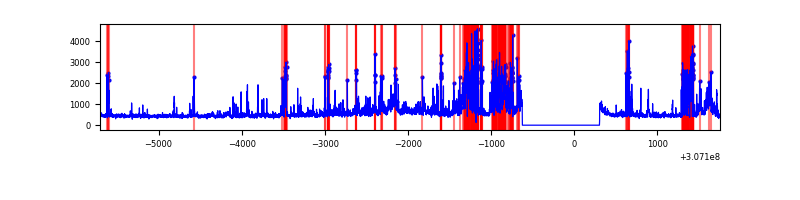 |
Top three noisy pixels from each quadrant. If the there are fewer than three noisy pixels in the level2.evt file, extra rows are filled as -1
| Pixel properties | Quadrant properties | ||||||
|---|---|---|---|---|---|---|---|
| Quadrant | DetID | PixID | Counts | Sigma | Mean | Median | Sigma |
| A | 15 | 236 | 20570 | 123.41 | 802 | 787 | 160.3 |
| A | 13 | 254 | 8508 | 48.17 | 802 | 787 | 160.3 |
| A | 0 | 226 | 7051 | 39.08 | 802 | 787 | 160.3 |
| B | 3 | 64 | 106078 | 701.53 | 792 | 775 | 150.1 |
| B | 0 | 189 | 31563 | 205.11 | 792 | 775 | 150.1 |
| B | 0 | 190 | 29328 | 190.22 | 792 | 775 | 150.1 |
| C | 14 | 238 | 120176 | 672.28 | 762 | 768 | 177.6 |
| C | 13 | 61 | 5409 | 26.13 | 762 | 768 | 177.6 |
| C | 12 | 4 | 2717 | 10.97 | 762 | 768 | 177.6 |
| D | 1 | 52 | 968454 | 5276.64 | 759 | 736 | 183.4 |
| D | 7 | 223 | 285484 | 1552.63 | 759 | 736 | 183.4 |
| D | 2 | 136 | 192734 | 1046.9 | 759 | 736 | 183.4 |
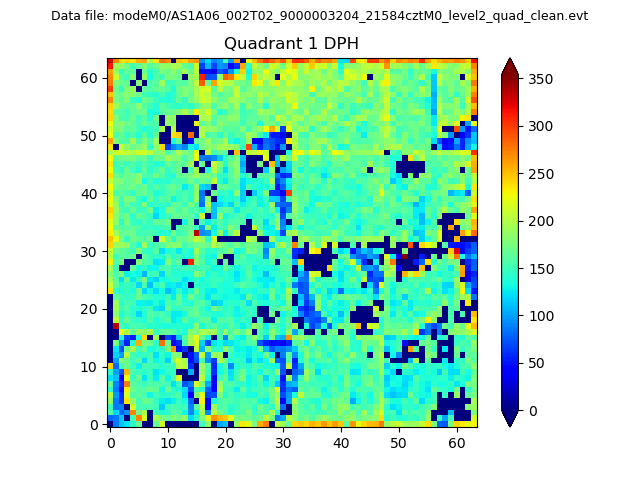
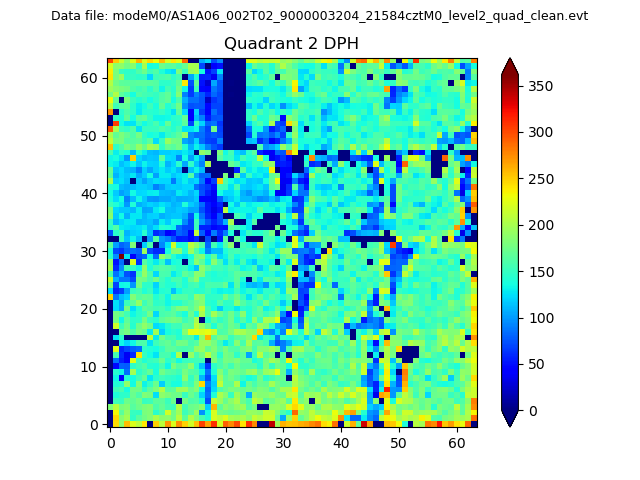
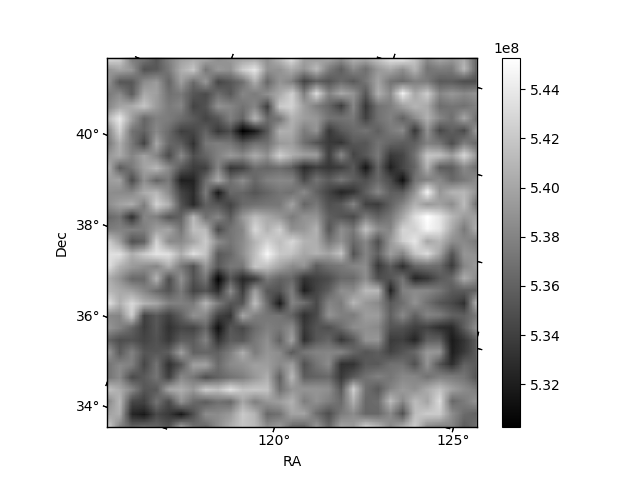
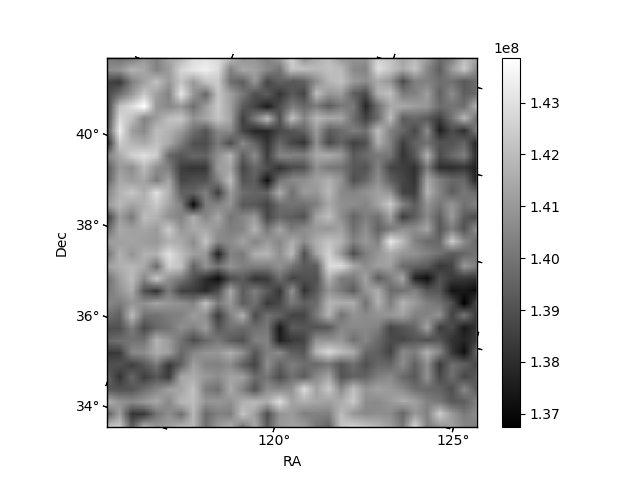
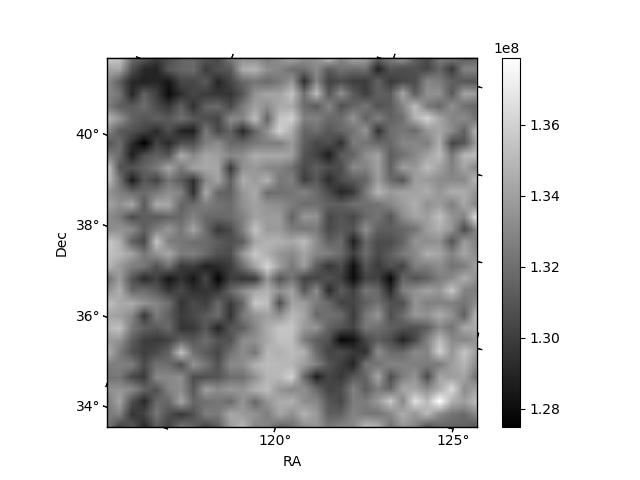
Histogram calculated using DETX and DETY for each event in the final _common_clean file
| Quadrant A | 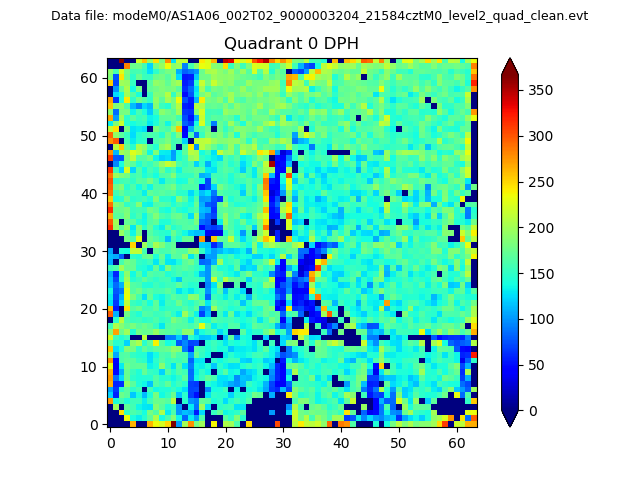 |
 |
Quadrant B |
|---|---|---|---|
| Quadrant D | 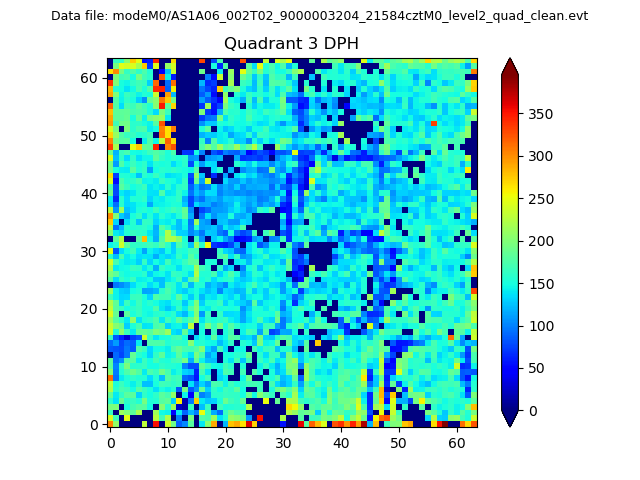 |
 |
Quadrant C |
| Plot type | Count rate plots | Images |
|---|---|---|
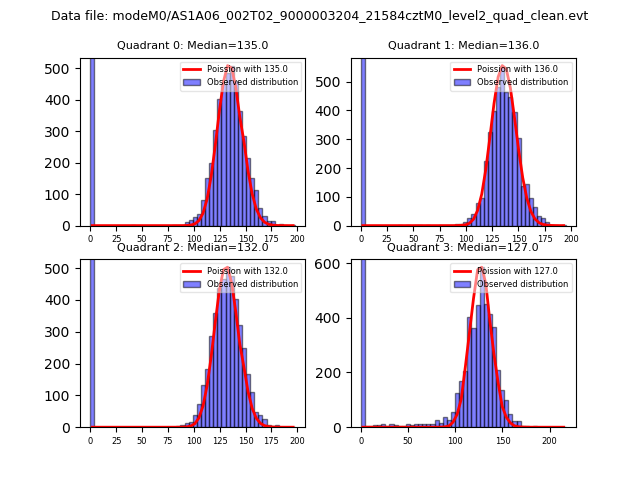
| Comparison with Poisson distribution Blue bars denote a histogram of data divided into 1 sec bins. Red curve is a Poisson curve with rate = median count rate of data. |
 |
 |
| Quadrant-wise count rates Data is divided into 100 sec bins |
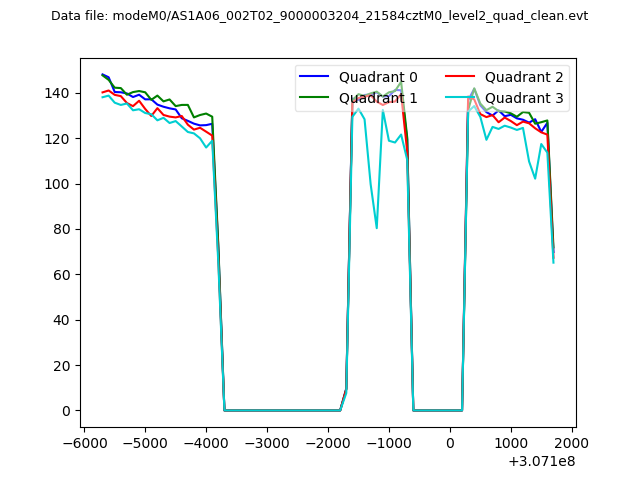 |
|
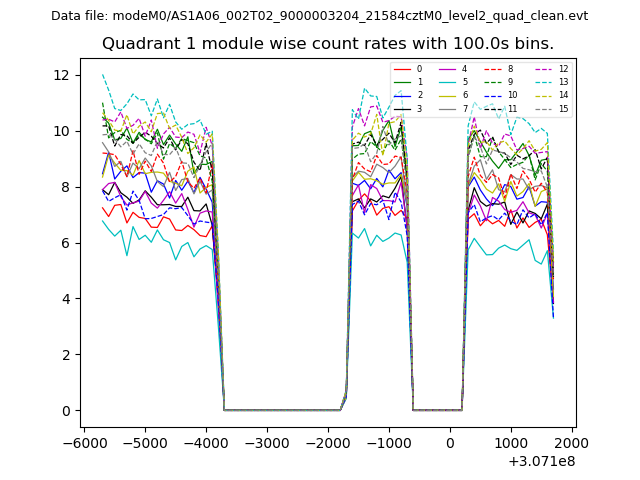
| Module-wise count rates for Quadrant A Data is divided into 100 sec bins |
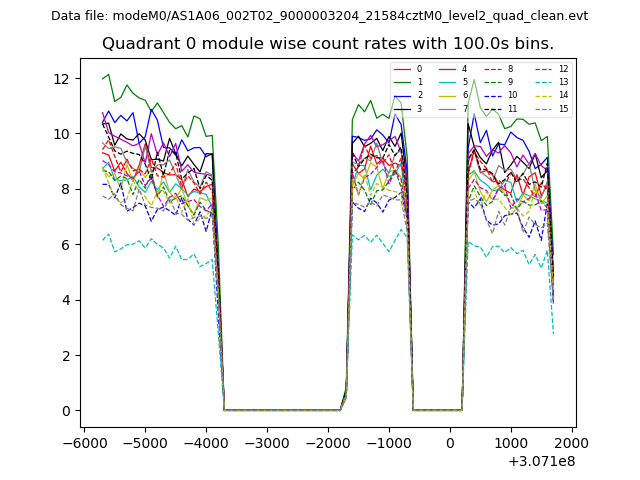 |
 |
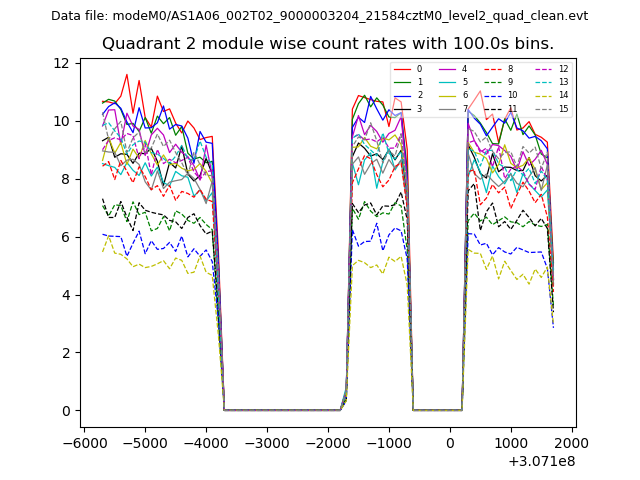
| Module-wise count rates for Quadrant B Data is divided into 100 sec bins |
 |
 |
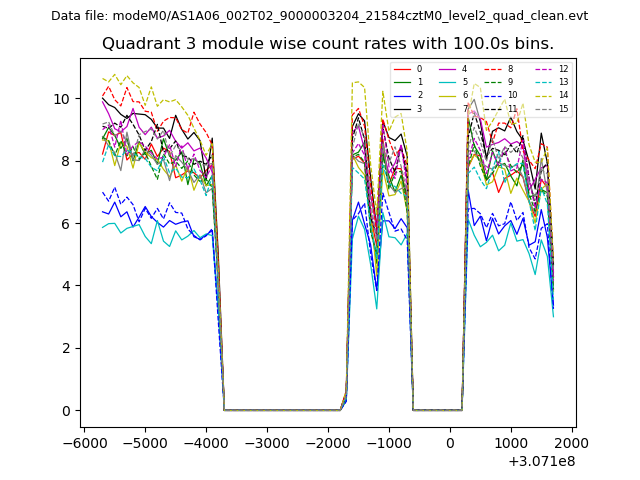
| Module-wise count rates for Quadrant C Data is divided into 100 sec bins |
 |
 |
| Module-wise count rates for Quadrant D Data is divided into 100 sec bins |
 |
 |
| Parameter | Plot |
|---|---|
| CZT HV Monitor | 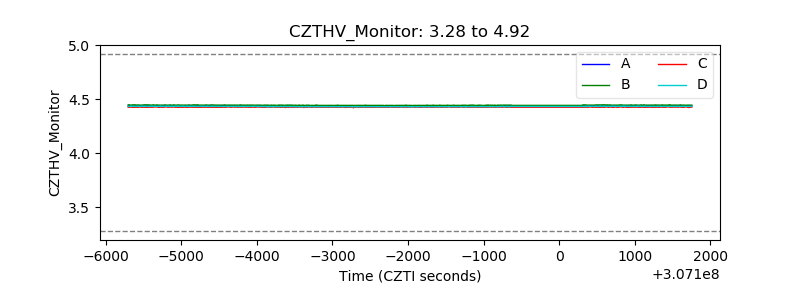 |
| D_VDD | 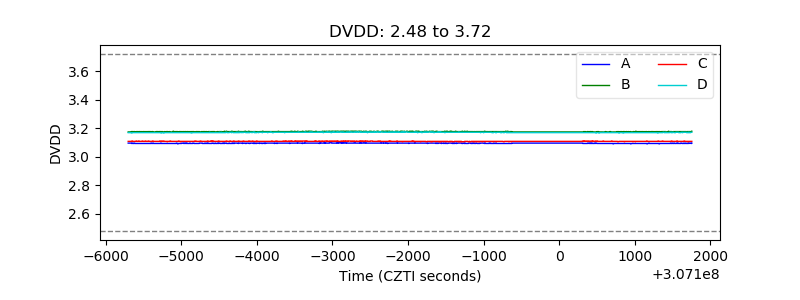 |
| Temperature 1 |  |
| Veto HV Monitor | 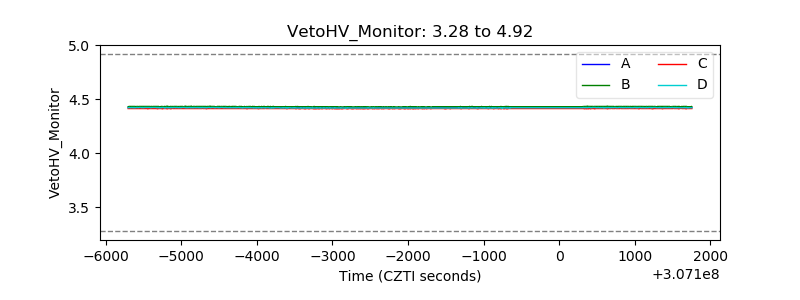 |
| Veto LLD |  |
| Alpha Counter | 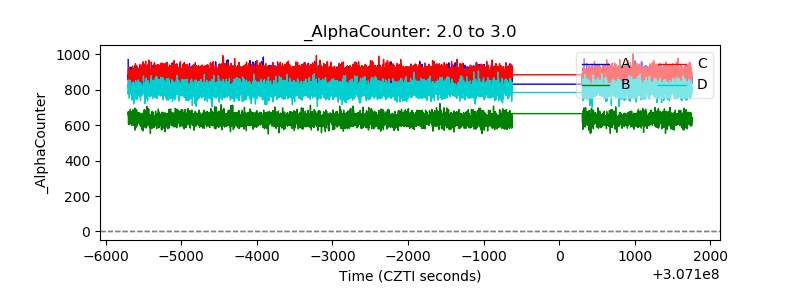 |
| _CPM_Rate | 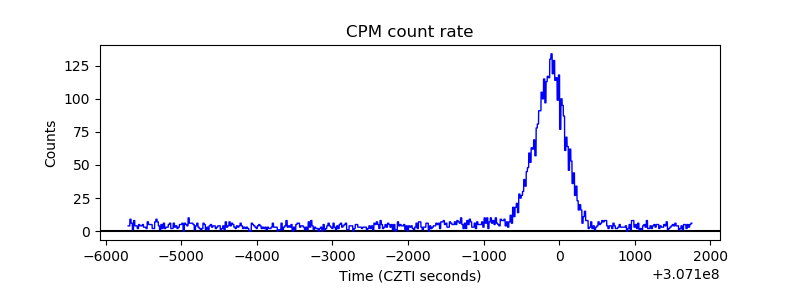 |
| CZT Counter | 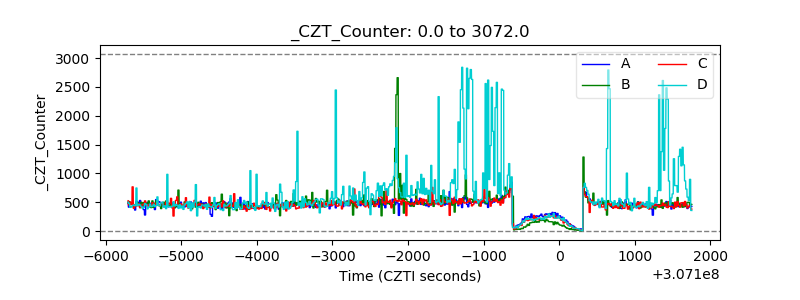 |
| +2.5 Volts monitor |  |
| +5 Volts monitor |  |
| _ROLL_ROT | 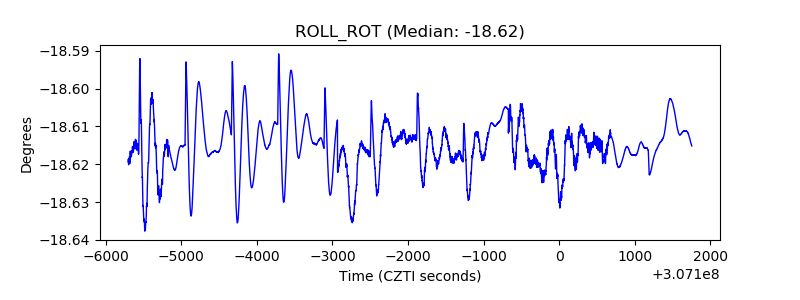 |
| _Roll_DEC | 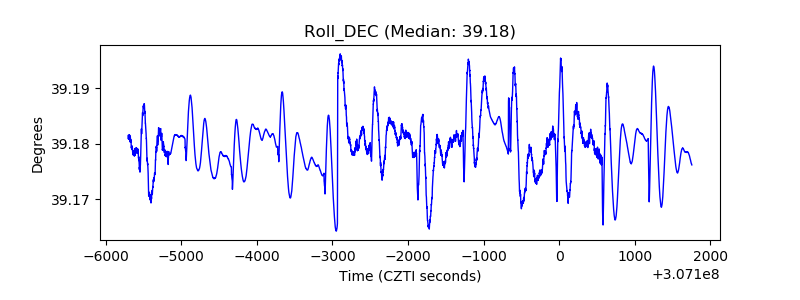 |
| _Roll_RA | 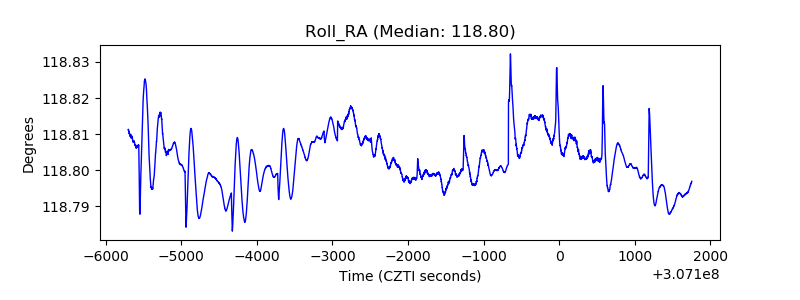 |
| Veto Counter | 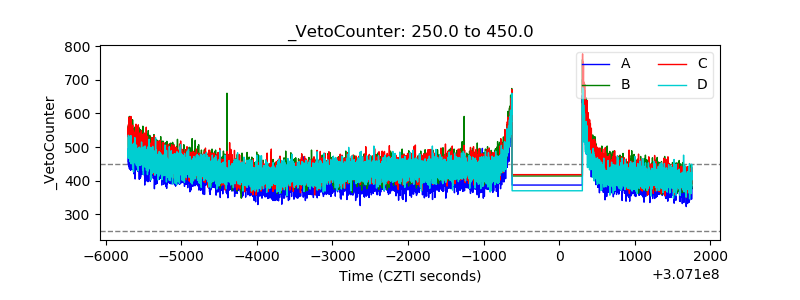 |