| Param | Original file | Final file |
|---|---|---|
| Filename | modeM0/AS1A06_002T02_9000003204_21586cztM0_level2.evt | modeM0/AS1A06_002T02_9000003204_21586cztM0_level2_quad_clean.evt |
| Size (bytes) | 383,624,640 | 71,861,760 |
| Size | 365.9 MB | 68.5 MB |
| Events in quadrant A | 3,749,986 | 451,992 |
| Events in quadrant B | 2,559,379 | 470,901 |
| Events in quadrant C | 2,386,394 | 455,899 |
| Events in quadrant D | 2,588,009 | 452,556 |
| Mode M0 | |||
|---|---|---|---|
| Quadrant | BADHDUFLAG | Total packets | Discarded packets |
| A | 0 | 14340 | 0 |
| B | 0 | 10684 | 0 |
| C | 0 | 10210 | 0 |
| D | 0 | 11072 | 0 |
| Mode SS | |||
|---|---|---|---|
| Quadrant | BADHDUFLAG | Total packets | Discarded packets |
| A | 0 | 100 | 0 |
| B | 0 | 100 | 0 |
| C | 0 | 100 | 0 |
| D | 0 | 100 | 0 |
| Mode M9 | |||
|---|---|---|---|
| Quadrant | BADHDUFLAG | Total packets | Discarded packets |
| A | 0 | 1 | 0 |
| B | 0 | 1 | 0 |
| C | 0 | 1 | 0 |
| D | 0 | 1 | 0 |
| Quadrant | Total seconds | Saturated seconds | Saturation percentage |
|---|---|---|---|
| A | 4907 | 394 | 8.029346% |
| B | 4908 | 215 | 4.380603% |
| C | 4908 | 211 | 4.299104% |
| D | 4906 | 197 | 4.015491% |
Noise dominated data is calculated using 1-second bins in cleaned event files. If a bin has >2000 counts, and if more than 50% of those come from <1% of pixels, then it is considered to be noise-dominated and hence unusable.
| Quadrant | # 1 sec bins | Bins with >0 counts | Bins with >2000 counts | High rate bins dominated by noise | Noise dominated (total time) | Noise dominated (detector-on time) | Marked lightcurve |
|---|---|---|---|---|---|---|---|
| A | 4996 | 4910 | 151 | 151 | 3.02% | 3.08% | 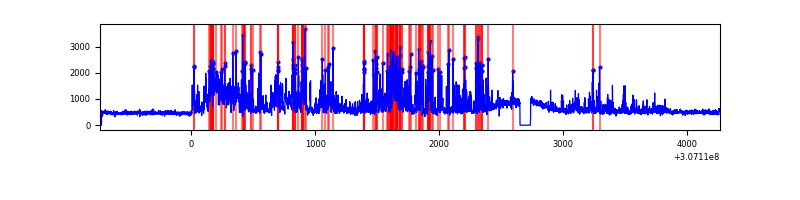 |
| B | 4997 | 4911 | 2 | 2 | 0.04% | 0.04% | 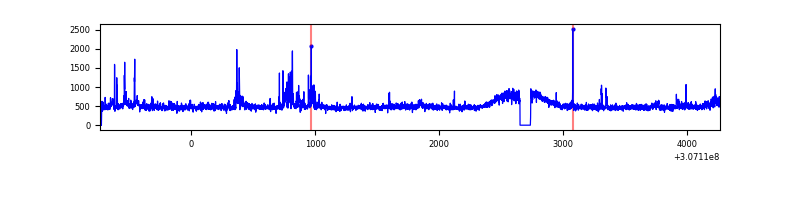 |
| C | 5001 | 4912 | 0 | 0 | 0.00% | 0.00% | 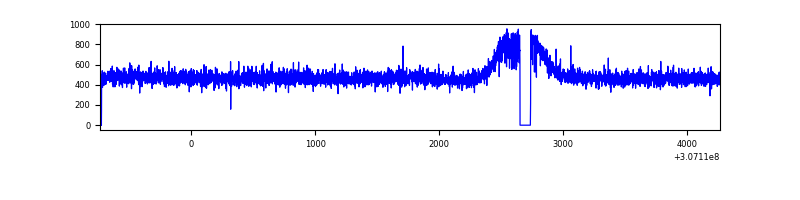 |
| D | 4996 | 4909 | 32 | 32 | 0.64% | 0.65% | 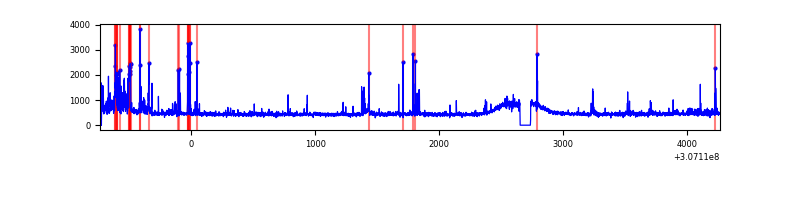 |
Top three noisy pixels from each quadrant. If the there are fewer than three noisy pixels in the level2.evt file, extra rows are filled as -1
| Pixel properties | Quadrant properties | ||||||
|---|---|---|---|---|---|---|---|
| Quadrant | DetID | PixID | Counts | Sigma | Mean | Median | Sigma |
| A | 15 | 236 | 1422456 | 11590.11 | 603 | 592 | 122.7 |
| A | 13 | 254 | 6872 | 51.19 | 603 | 592 | 122.7 |
| A | 3 | 137 | 5343 | 38.72 | 603 | 592 | 122.7 |
| B | 0 | 230 | 77387 | 652.73 | 609 | 593 | 117.7 |
| B | 3 | 64 | 32106 | 267.85 | 609 | 593 | 117.7 |
| B | 0 | 189 | 21013 | 173.57 | 609 | 593 | 117.7 |
| C | 14 | 238 | 90836 | 645.67 | 587 | 590 | 139.8 |
| C | 13 | 61 | 4240 | 26.11 | 587 | 590 | 139.8 |
| C | 8 | 128 | 3911 | 23.76 | 587 | 590 | 139.8 |
| D | 7 | 38 | 114789 | 779.84 | 597 | 578 | 146.5 |
| D | 1 | 52 | 55758 | 376.77 | 597 | 578 | 146.5 |
| D | 2 | 136 | 49437 | 333.61 | 597 | 578 | 146.5 |
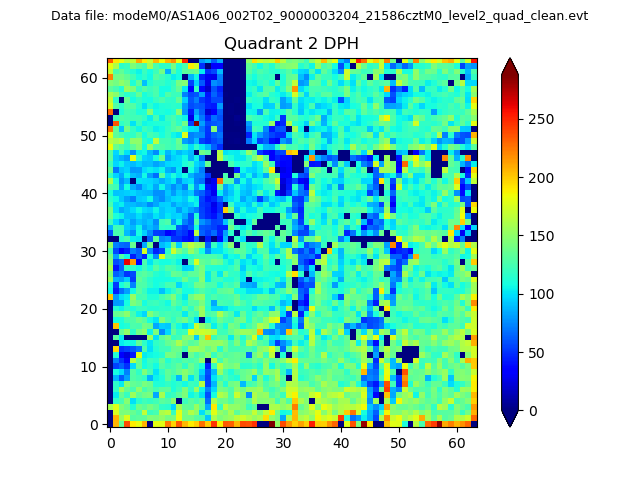
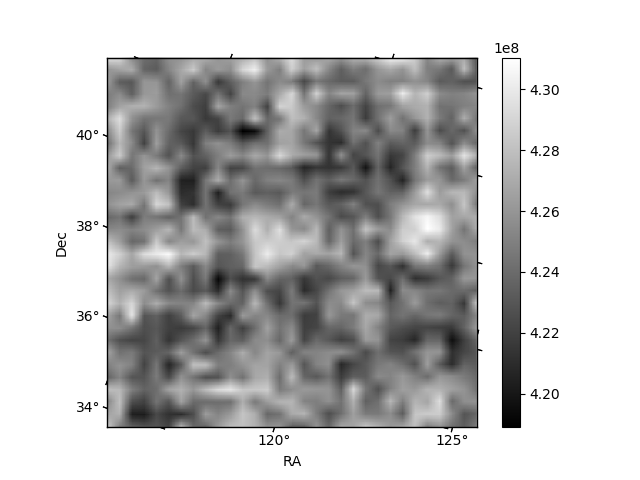
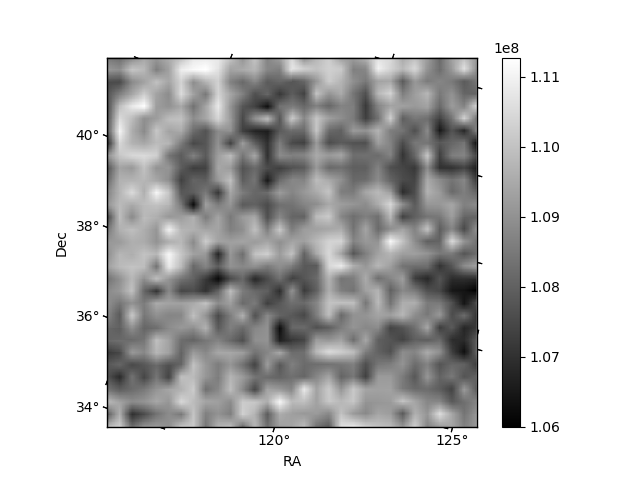
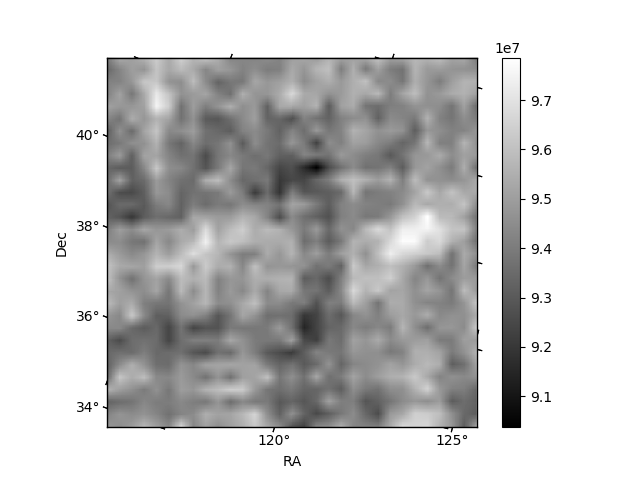
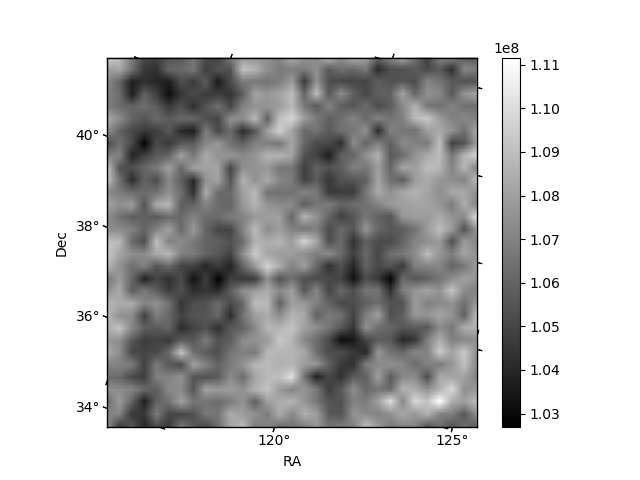
Histogram calculated using DETX and DETY for each event in the final _common_clean file
| Quadrant A | 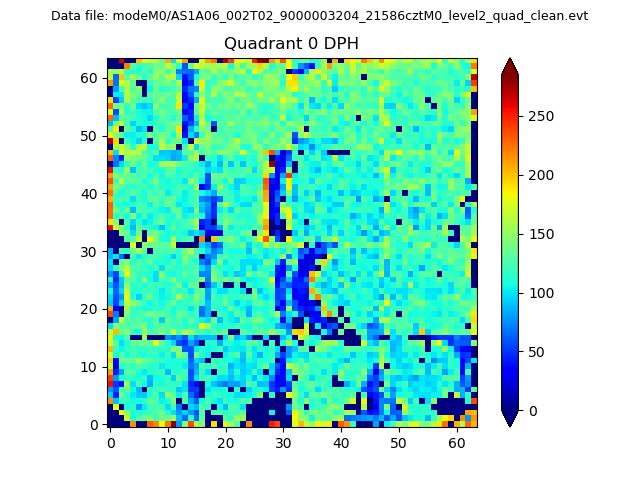 |
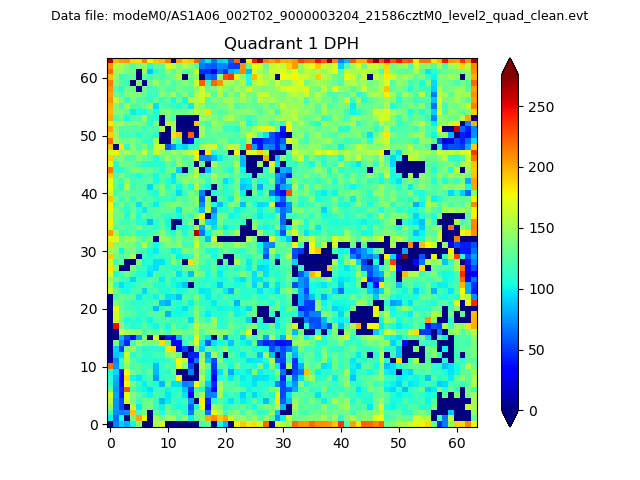 |
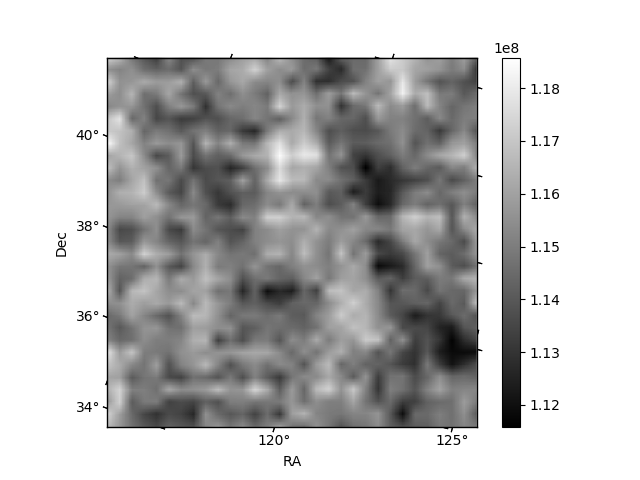
Quadrant B |
|---|---|---|---|
| Quadrant D | 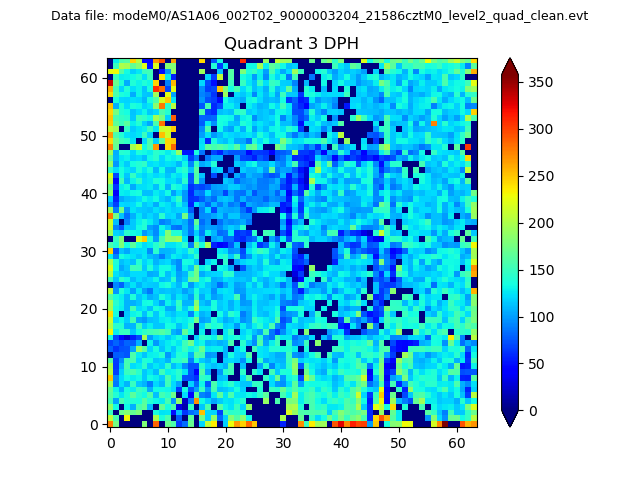 |
 |
Quadrant C |
| Plot type | Count rate plots | Images |
|---|---|---|
| Comparison with Poisson distribution Blue bars denote a histogram of data divided into 1 sec bins. Red curve is a Poisson curve with rate = median count rate of data. |
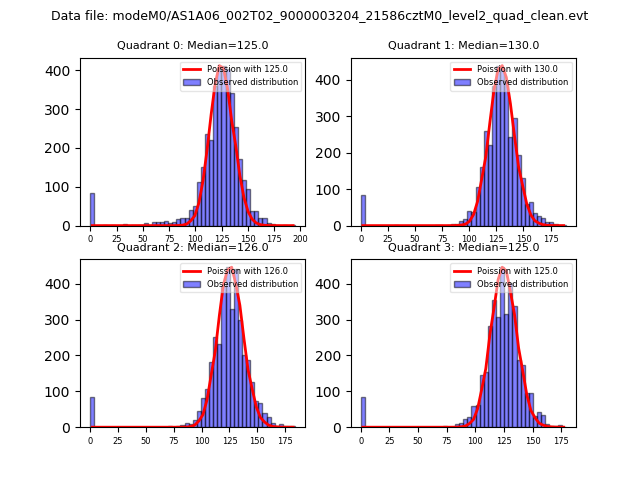 |
 |
| Quadrant-wise count rates Data is divided into 100 sec bins |
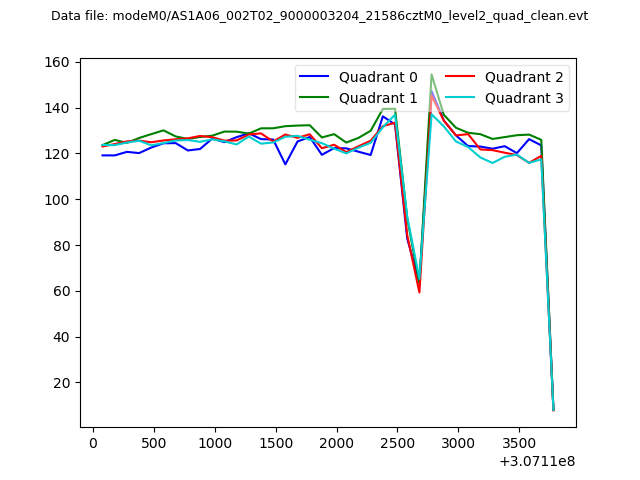 |
|
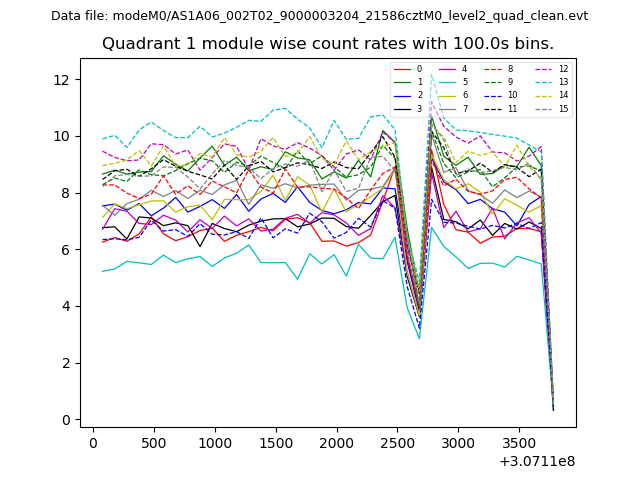
| Module-wise count rates for Quadrant A Data is divided into 100 sec bins |
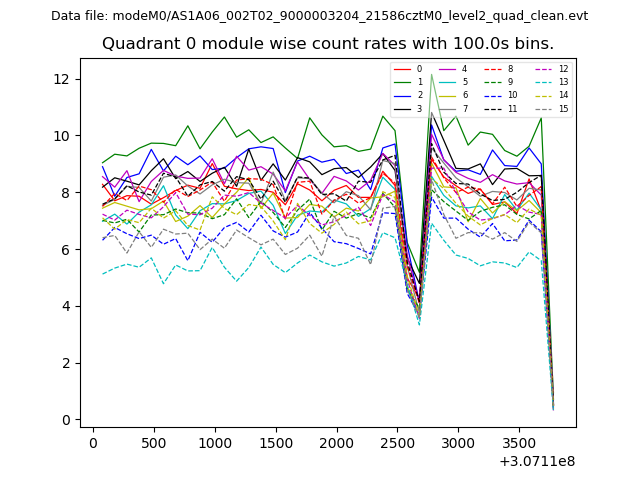 |
 |
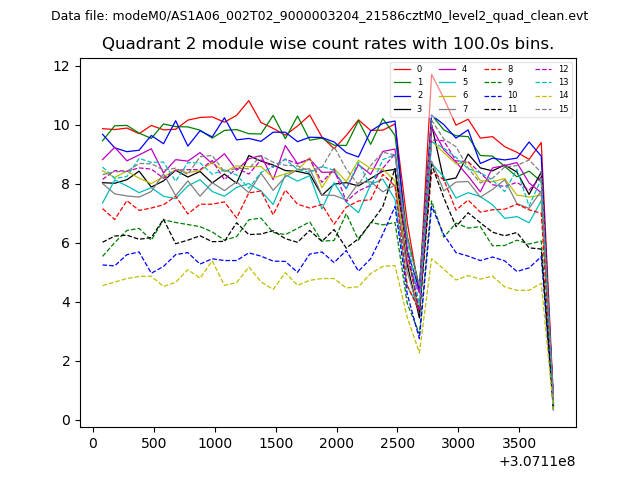
| Module-wise count rates for Quadrant B Data is divided into 100 sec bins |
 |
 |
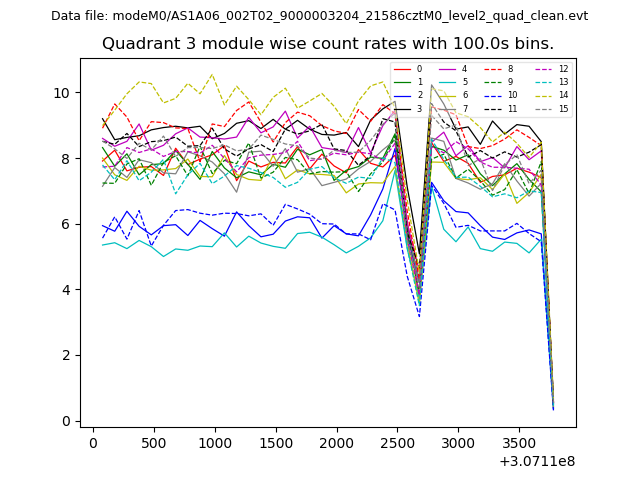
| Module-wise count rates for Quadrant C Data is divided into 100 sec bins |
 |
 |
| Module-wise count rates for Quadrant D Data is divided into 100 sec bins |
 |
 |
| Parameter | Plot |
|---|---|
| CZT HV Monitor | 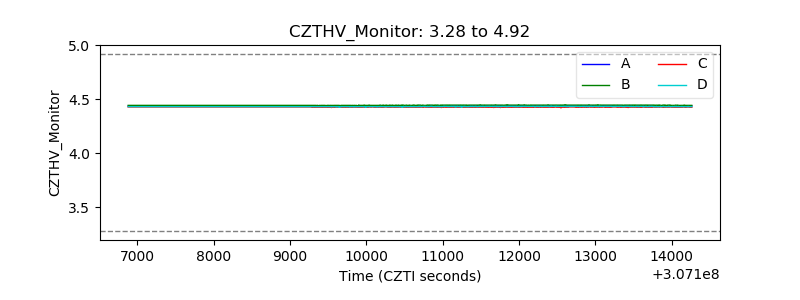 |
| D_VDD | 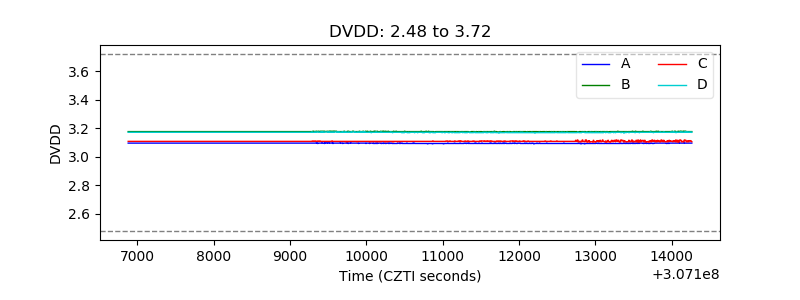 |
| Temperature 1 | 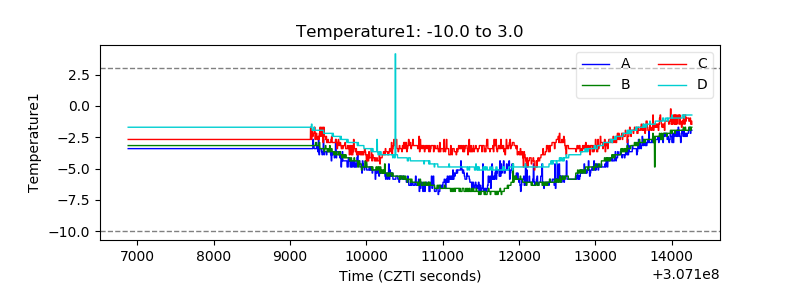 |
| Veto HV Monitor | 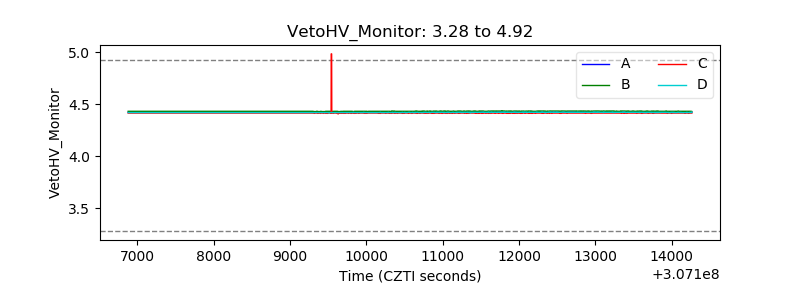 |
| Veto LLD | 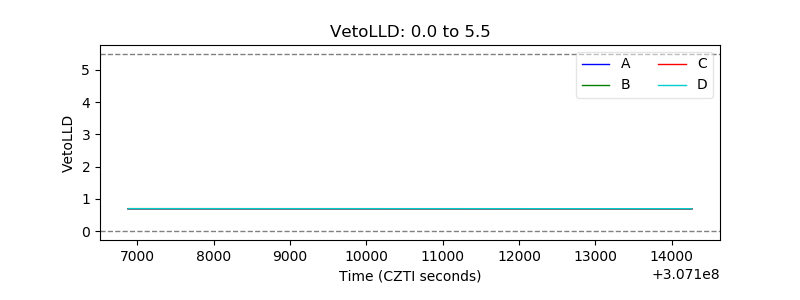 |
| Alpha Counter | 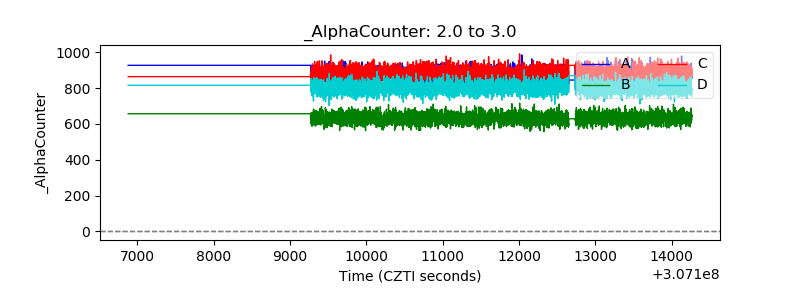 |
| _CPM_Rate | 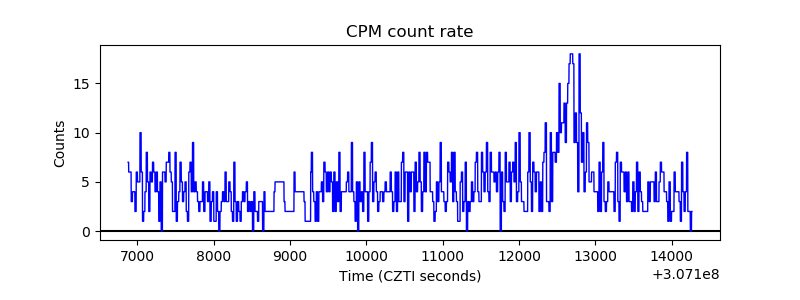 |
| CZT Counter | 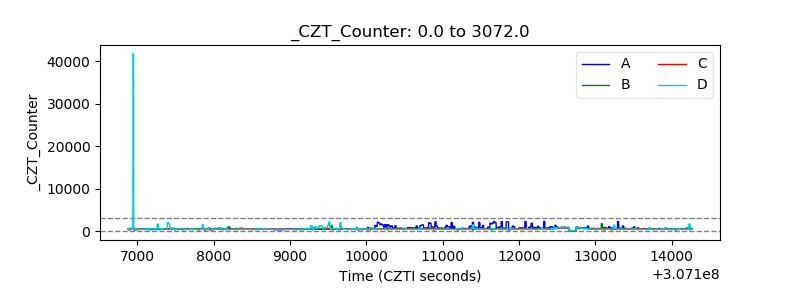 |
| +2.5 Volts monitor |  |
| +5 Volts monitor | 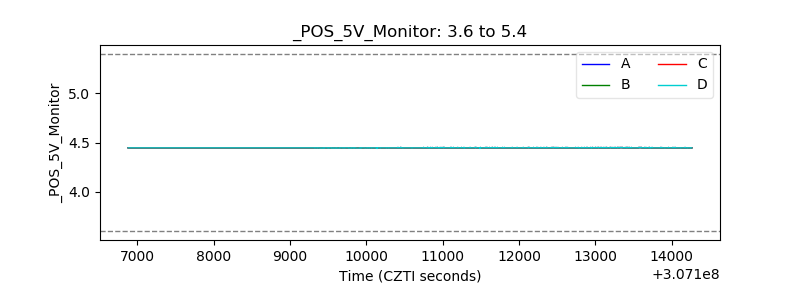 |
| _ROLL_ROT | 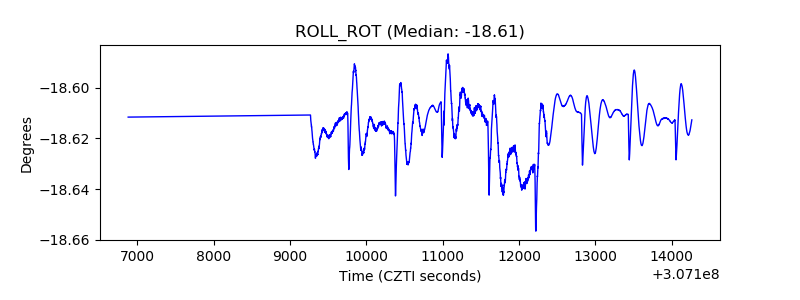 |
| _Roll_DEC | 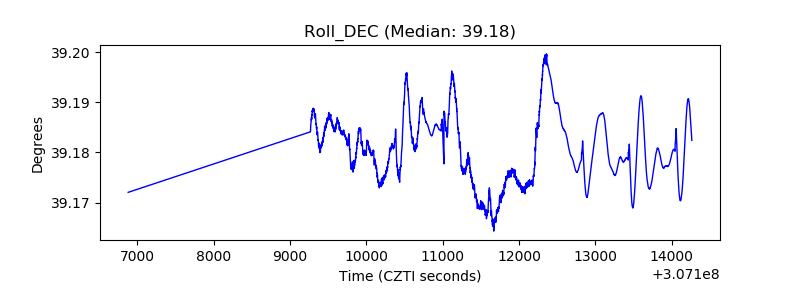 |
| _Roll_RA | 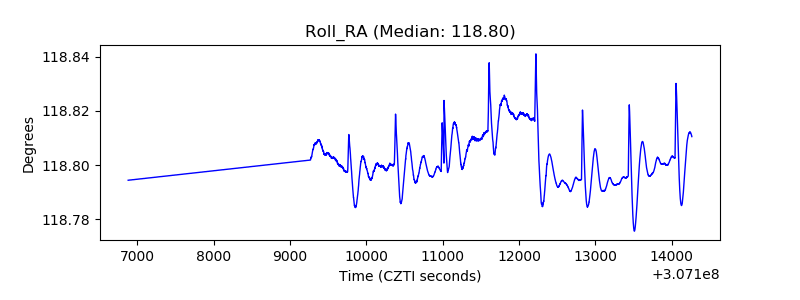 |
| Veto Counter | 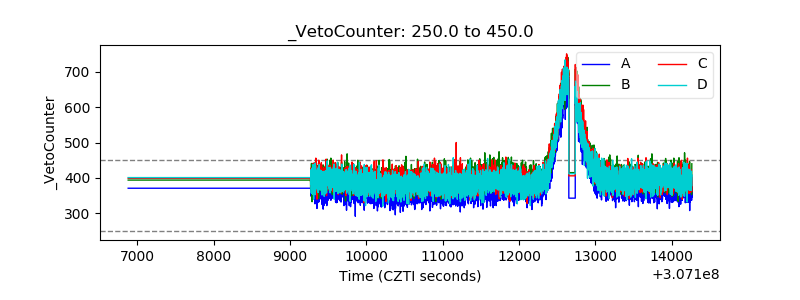 |