| Param | Original file | Final file |
|---|---|---|
| Filename | modeM0/AS1A06_002T02_9000003204_21587cztM0_level2.evt | modeM0/AS1A06_002T02_9000003204_21587cztM0_level2_quad_clean.evt |
| Size (bytes) | 950,448,960 | 155,586,240 |
| Size | 906.4 MB | 148.4 MB |
| Events in quadrant A | 7,826,624 | 956,234 |
| Events in quadrant B | 6,591,027 | 981,823 |
| Events in quadrant C | 6,092,941 | 950,411 |
| Events in quadrant D | 7,403,569 | 934,224 |
| Mode M0 | |||
|---|---|---|---|
| Quadrant | BADHDUFLAG | Total packets | Discarded packets |
| A | 0 | 31279 | 0 |
| B | 0 | 27687 | 0 |
| C | 0 | 26371 | 0 |
| D | 0 | 30588 | 0 |
| Mode SS | |||
|---|---|---|---|
| Quadrant | BADHDUFLAG | Total packets | Discarded packets |
| A | 0 | 262 | 0 |
| B | 0 | 262 | 0 |
| C | 0 | 262 | 0 |
| D | 0 | 262 | 0 |
| Mode M9 | |||
|---|---|---|---|
| Quadrant | BADHDUFLAG | Total packets | Discarded packets |
| A | 0 | 4 | 0 |
| B | 0 | 4 | 0 |
| C | 0 | 4 | 0 |
| D | 0 | 4 | 0 |
| Quadrant | Total seconds | Saturated seconds | Saturation percentage |
|---|---|---|---|
| A | 12858 | 474 | 3.686421% |
| B | 12859 | 318 | 2.472976% |
| C | 12859 | 317 | 2.465199% |
| D | 12859 | 461 | 3.585038% |
Noise dominated data is calculated using 1-second bins in cleaned event files. If a bin has >2000 counts, and if more than 50% of those come from <1% of pixels, then it is considered to be noise-dominated and hence unusable.
| Quadrant | # 1 sec bins | Bins with >0 counts | Bins with >2000 counts | High rate bins dominated by noise | Noise dominated (total time) | Noise dominated (detector-on time) | Marked lightcurve |
|---|---|---|---|---|---|---|---|
| A | 13248 | 12860 | 151 | 151 | 1.14% | 1.17% | 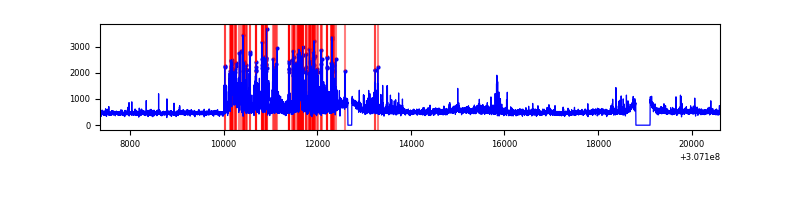 |
| B | 13249 | 12861 | 9 | 9 | 0.07% | 0.07% | 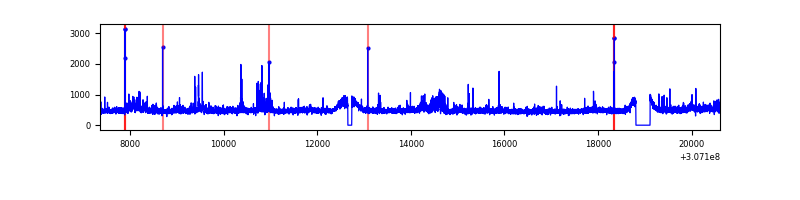 |
| C | 13249 | 12861 | 0 | 0 | 0.00% | 0.00% | 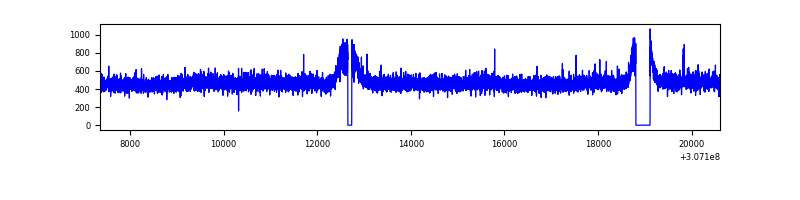 |
| D | 13249 | 12861 | 213 | 213 | 1.61% | 1.66% | 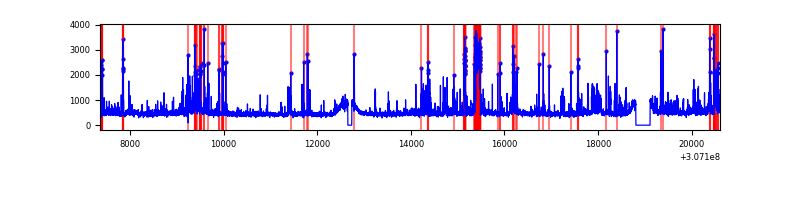 |
Top three noisy pixels from each quadrant. If the there are fewer than three noisy pixels in the level2.evt file, extra rows are filled as -1
| Pixel properties | Quadrant properties | ||||||
|---|---|---|---|---|---|---|---|
| Quadrant | DetID | PixID | Counts | Sigma | Mean | Median | Sigma |
| A | 15 | 236 | 1836356 | 5891.99 | 1553 | 1519 | 311.4 |
| A | 13 | 254 | 18373 | 54.12 | 1553 | 1519 | 311.4 |
| A | 0 | 226 | 13546 | 38.62 | 1553 | 1519 | 311.4 |
| B | 0 | 189 | 210248 | 701.74 | 1557 | 1516 | 297.4 |
| B | 0 | 230 | 124286 | 412.74 | 1557 | 1516 | 297.4 |
| B | 3 | 64 | 79264 | 261.38 | 1557 | 1516 | 297.4 |
| C | 14 | 238 | 232978 | 657.18 | 1497 | 1506 | 352.2 |
| C | 8 | 128 | 11850 | 29.37 | 1497 | 1506 | 352.2 |
| C | 13 | 61 | 10812 | 26.42 | 1497 | 1506 | 352.2 |
| D | 1 | 52 | 642482 | 1735.03 | 1513 | 1464 | 369.5 |
| D | 7 | 38 | 490511 | 1323.69 | 1513 | 1464 | 369.5 |
| D | 2 | 136 | 175478 | 471.0 | 1513 | 1464 | 369.5 |
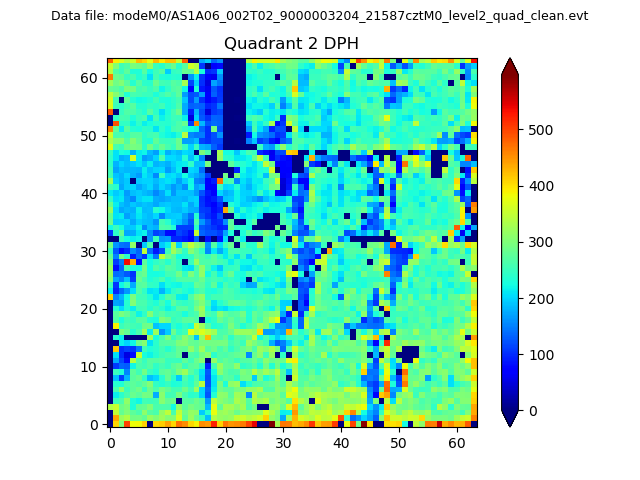
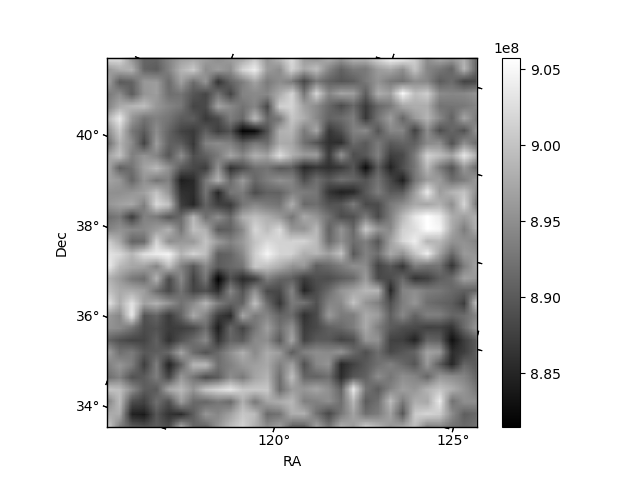
Histogram calculated using DETX and DETY for each event in the final _common_clean file
| Quadrant A | 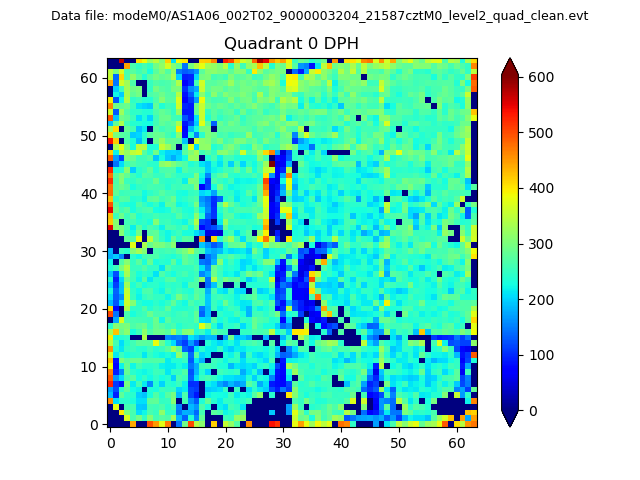 |
 |
Quadrant B |
|---|---|---|---|
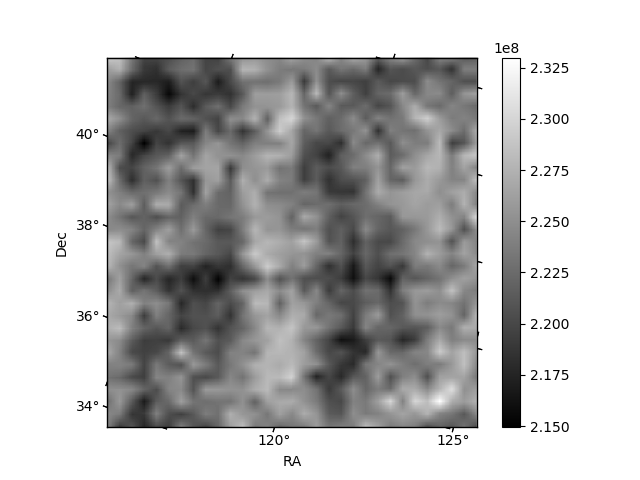
| Quadrant D | 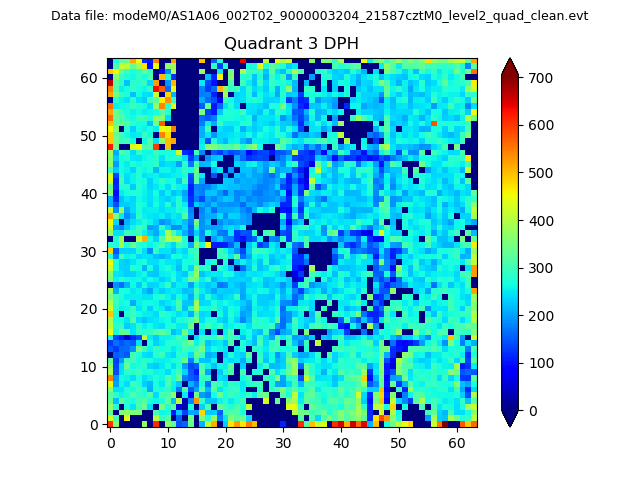 |
 |
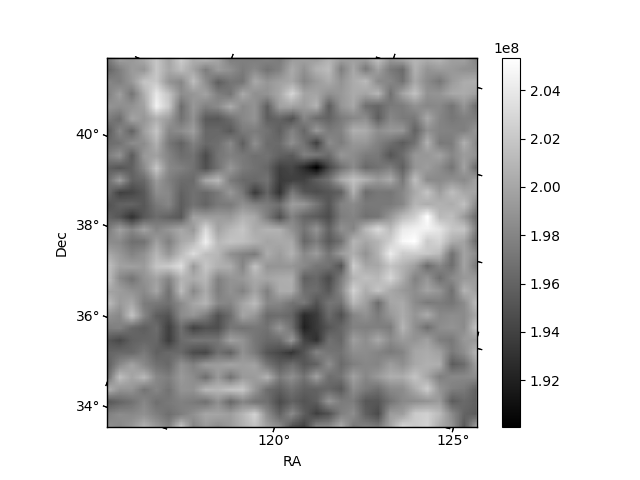
Quadrant C |
| Plot type | Count rate plots | Images |
|---|---|---|
| Comparison with Poisson distribution Blue bars denote a histogram of data divided into 1 sec bins. Red curve is a Poisson curve with rate = median count rate of data. |
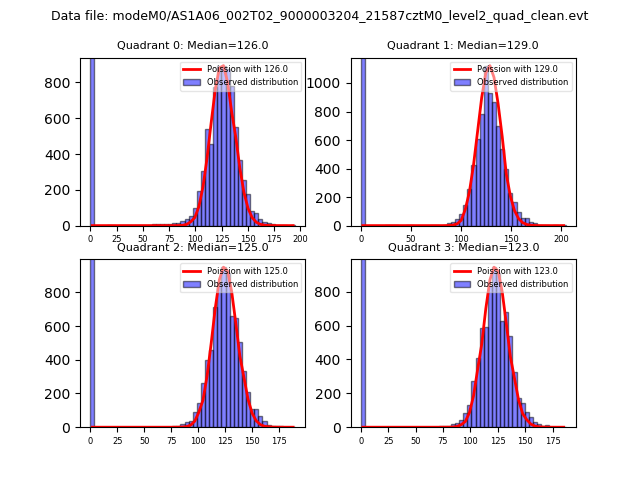 |
 |
| Quadrant-wise count rates Data is divided into 100 sec bins |
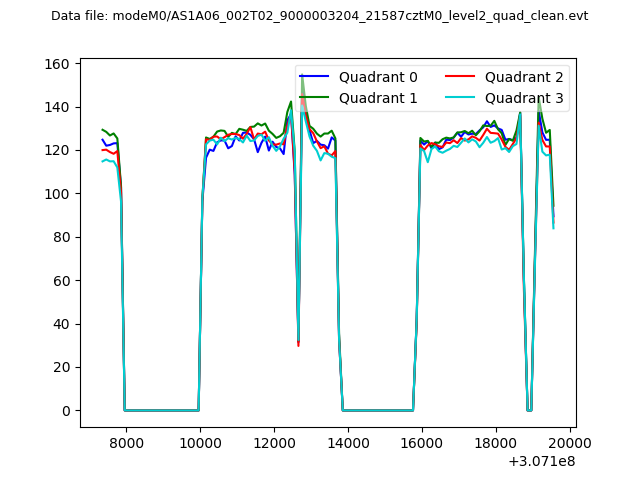 |
|
| Module-wise count rates for Quadrant A Data is divided into 100 sec bins |
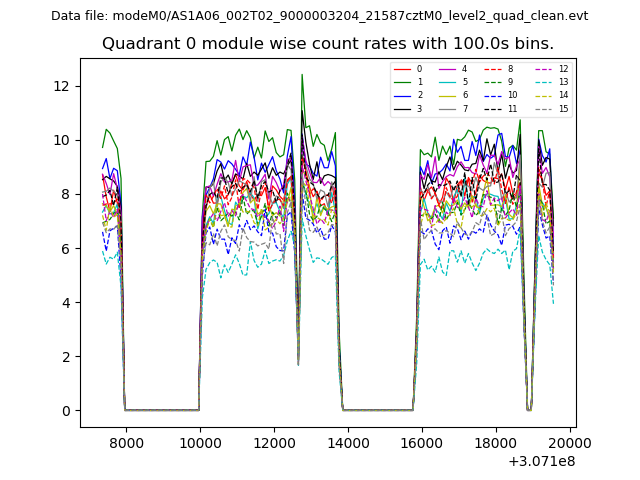 |
 |
| Module-wise count rates for Quadrant B Data is divided into 100 sec bins |
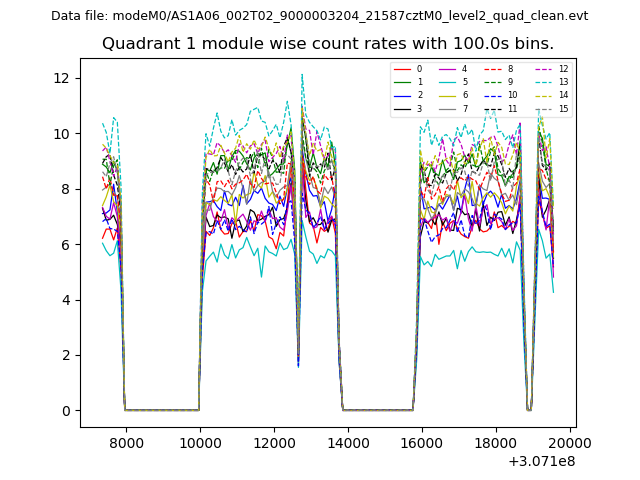 |
 |
| Module-wise count rates for Quadrant C Data is divided into 100 sec bins |
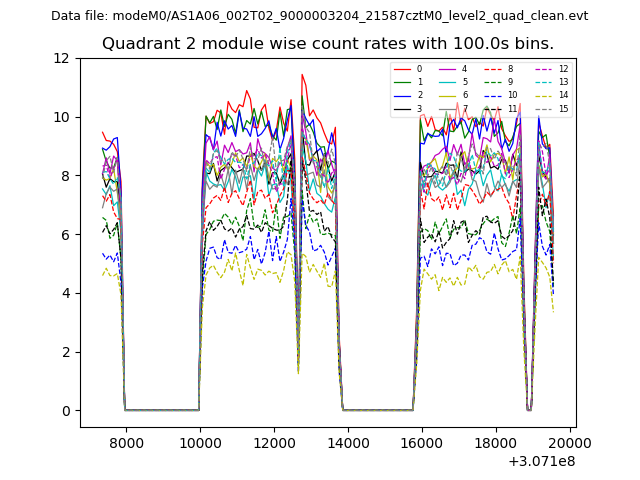 |
 |
| Module-wise count rates for Quadrant D Data is divided into 100 sec bins |
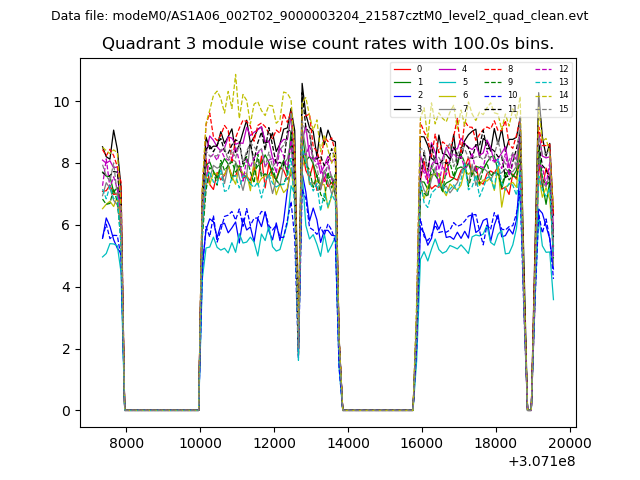 |
 |
| Parameter | Plot |
|---|---|
| CZT HV Monitor | 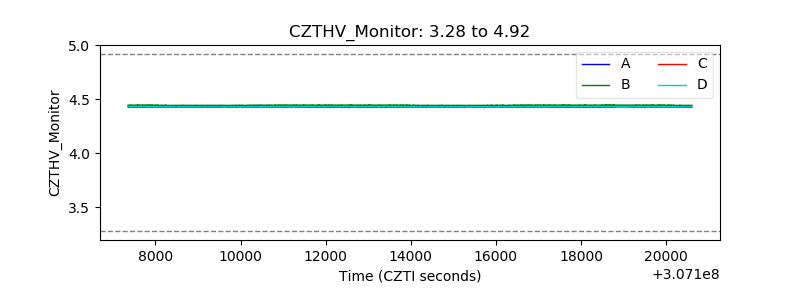 |
| D_VDD | 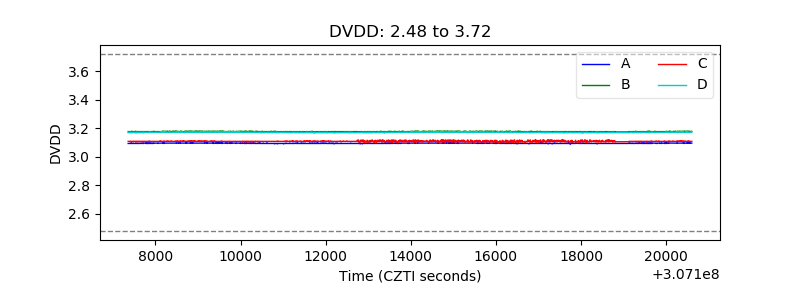 |
| Temperature 1 | 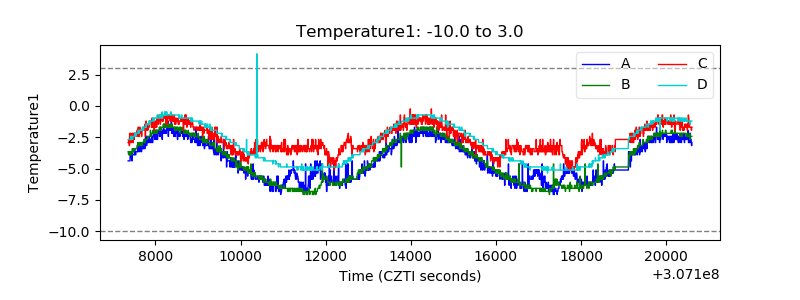 |
| Veto HV Monitor | 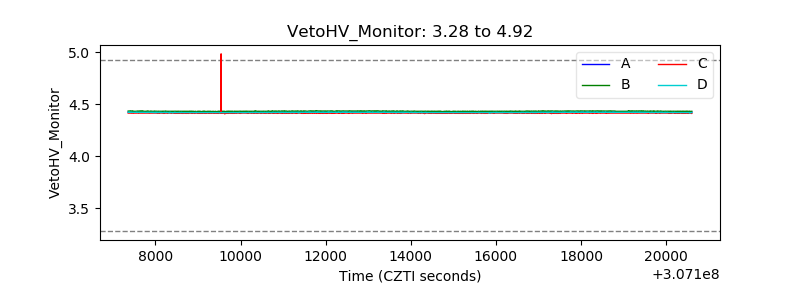 |
| Veto LLD | 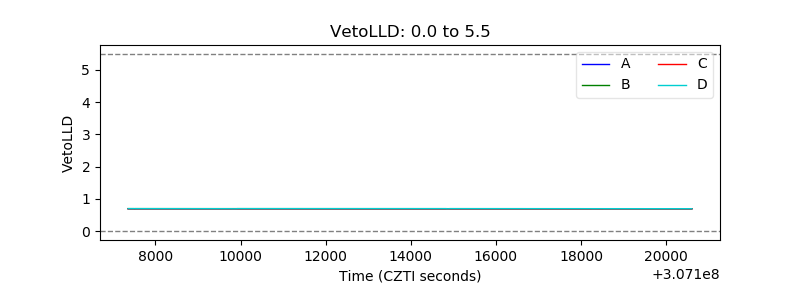 |
| Alpha Counter | 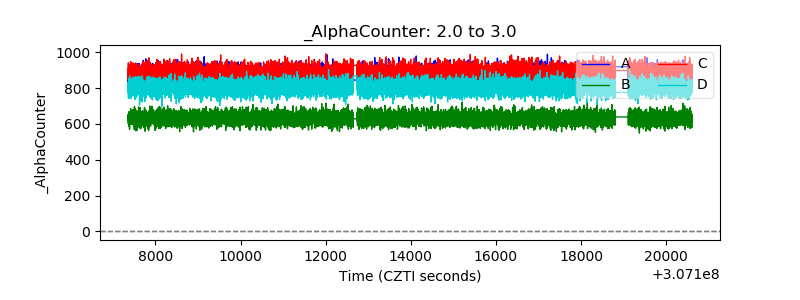 |
| _CPM_Rate | 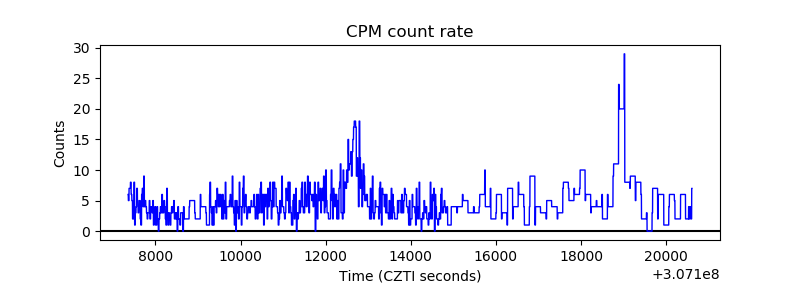 |
| CZT Counter | 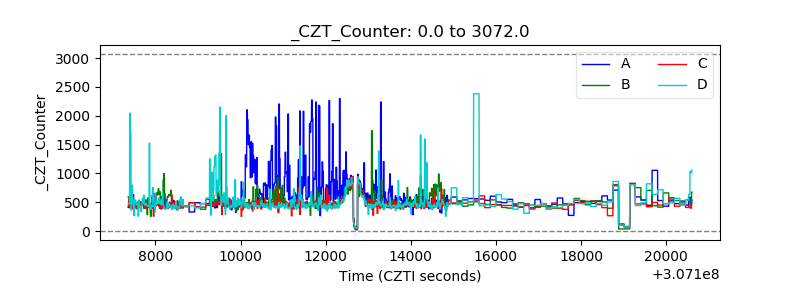 |
| +2.5 Volts monitor | 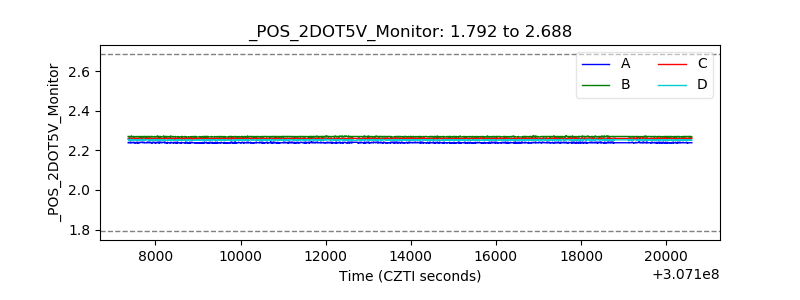 |
| +5 Volts monitor |  |
| _ROLL_ROT | 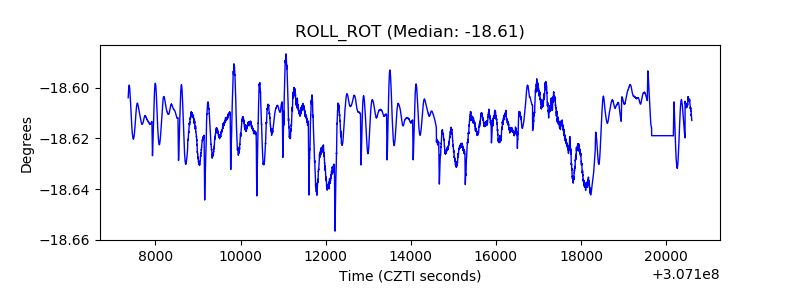 |
| _Roll_DEC | 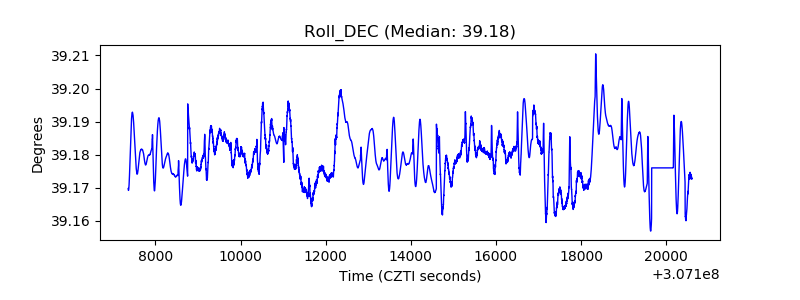 |
| _Roll_RA | 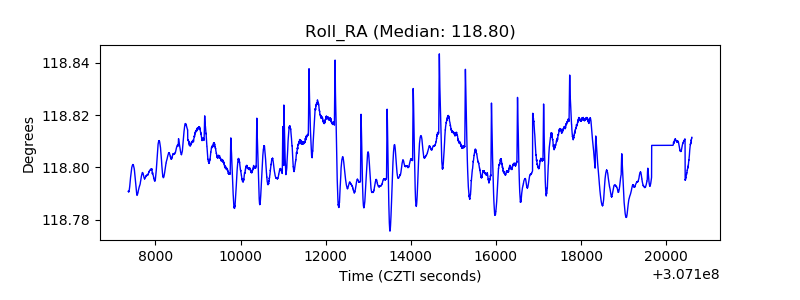 |
| Veto Counter | 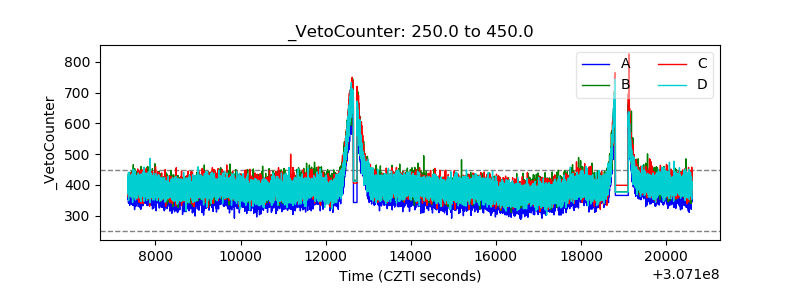 |