| Param | Original file | Final file |
|---|---|---|
| Filename | modeM0/AS1A06_002T02_9000003204_21589cztM0_level2.evt | modeM0/AS1A06_002T02_9000003204_21589cztM0_level2_quad_clean.evt |
| Size (bytes) | 635,618,880 | 87,782,400 |
| Size | 606.2 MB | 83.7 MB |
| Events in quadrant A | 4,164,931 | 525,252 |
| Events in quadrant B | 4,324,183 | 528,549 |
| Events in quadrant C | 3,963,693 | 516,276 |
| Events in quadrant D | 6,220,936 | 497,700 |
| Mode M0 | |||
|---|---|---|---|
| Quadrant | BADHDUFLAG | Total packets | Discarded packets |
| A | 0 | 17630 | 0 |
| B | 0 | 18328 | 0 |
| C | 0 | 17222 | 0 |
| D | 0 | 24228 | 0 |
| Mode SS | |||
|---|---|---|---|
| Quadrant | BADHDUFLAG | Total packets | Discarded packets |
| A | 0 | 172 | 0 |
| B | 0 | 172 | 0 |
| C | 0 | 172 | 0 |
| D | 0 | 172 | 0 |
| Mode M9 | |||
|---|---|---|---|
| Quadrant | BADHDUFLAG | Total packets | Discarded packets |
| A | 0 | 5 | 0 |
| B | 0 | 5 | 0 |
| C | 0 | 5 | 0 |
| D | 0 | 5 | 0 |
| Quadrant | Total seconds | Saturated seconds | Saturation percentage |
|---|---|---|---|
| A | 8499 | 53 | 0.623603% |
| B | 8500 | 96 | 1.129412% |
| C | 8500 | 82 | 0.964706% |
| D | 8499 | 493 | 5.800682% |
Noise dominated data is calculated using 1-second bins in cleaned event files. If a bin has >2000 counts, and if more than 50% of those come from <1% of pixels, then it is considered to be noise-dominated and hence unusable.
| Quadrant | # 1 sec bins | Bins with >0 counts | Bins with >2000 counts | High rate bins dominated by noise | Noise dominated (total time) | Noise dominated (detector-on time) | Marked lightcurve |
|---|---|---|---|---|---|---|---|
| A | 8984 | 8500 | 0 | 0 | 0.00% | 0.00% | 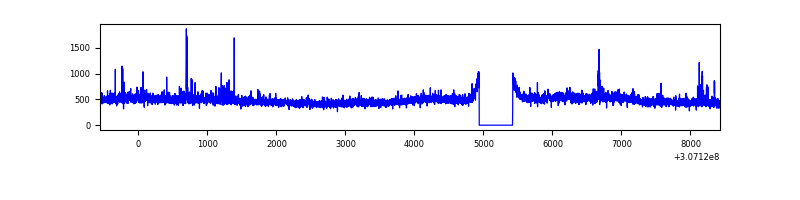 |
| B | 8985 | 8501 | 19 | 19 | 0.21% | 0.22% | 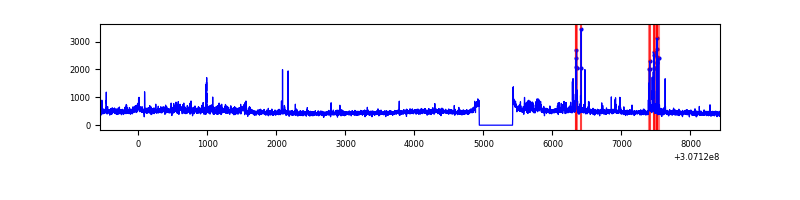 |
| C | 8985 | 8501 | 0 | 0 | 0.00% | 0.00% | 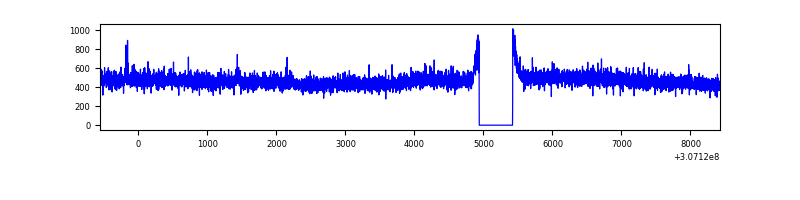 |
| D | 8984 | 8499 | 299 | 299 | 3.33% | 3.52% | 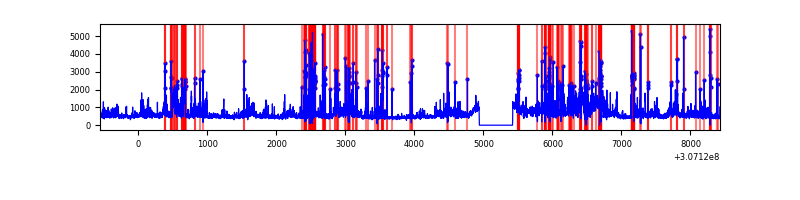 |
Top three noisy pixels from each quadrant. If the there are fewer than three noisy pixels in the level2.evt file, extra rows are filled as -1
| Pixel properties | Quadrant properties | ||||||
|---|---|---|---|---|---|---|---|
| Quadrant | DetID | PixID | Counts | Sigma | Mean | Median | Sigma |
| A | 15 | 236 | 262314 | 1275.8 | 1013 | 992 | 204.8 |
| A | 13 | 254 | 10950 | 48.62 | 1013 | 992 | 204.8 |
| A | 0 | 226 | 8686 | 37.56 | 1013 | 992 | 204.8 |
| B | 0 | 189 | 151577 | 780.43 | 1007 | 985 | 193.0 |
| B | 3 | 64 | 141965 | 730.62 | 1007 | 985 | 193.0 |
| B | 0 | 190 | 45113 | 228.69 | 1007 | 985 | 193.0 |
| C | 14 | 238 | 153123 | 658.05 | 975 | 981 | 231.2 |
| C | 3 | 233 | 7361 | 27.6 | 975 | 981 | 231.2 |
| C | 13 | 61 | 6661 | 24.57 | 975 | 981 | 231.2 |
| D | 1 | 52 | 2199693 | 9366.52 | 964 | 934 | 234.7 |
| D | 2 | 136 | 170662 | 723.03 | 964 | 934 | 234.7 |
| D | 7 | 223 | 95102 | 401.15 | 964 | 934 | 234.7 |
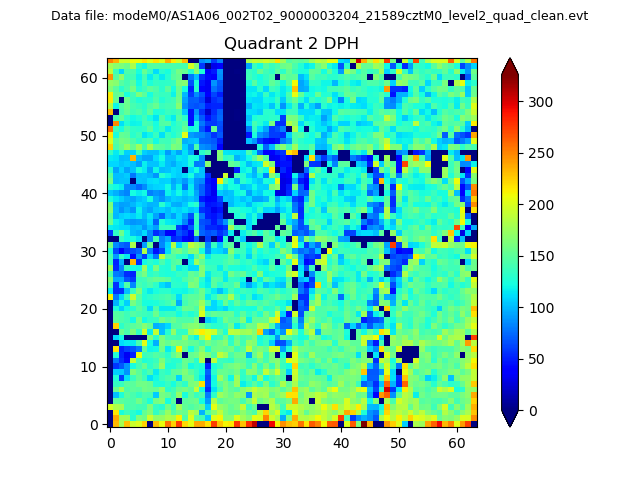
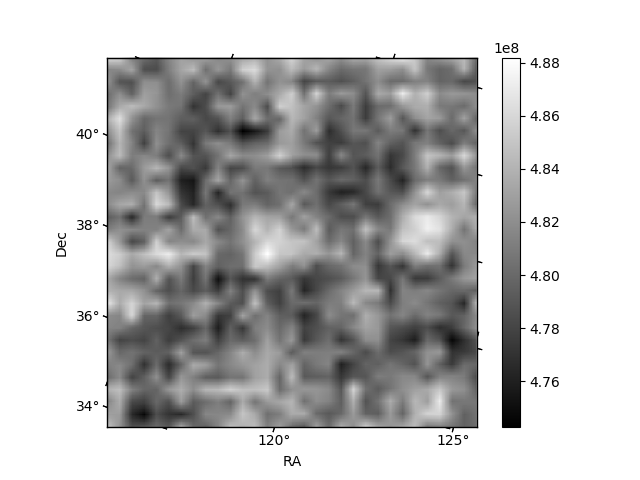
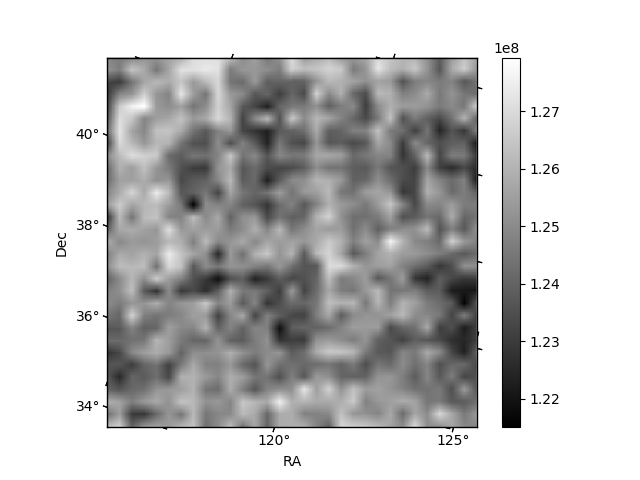
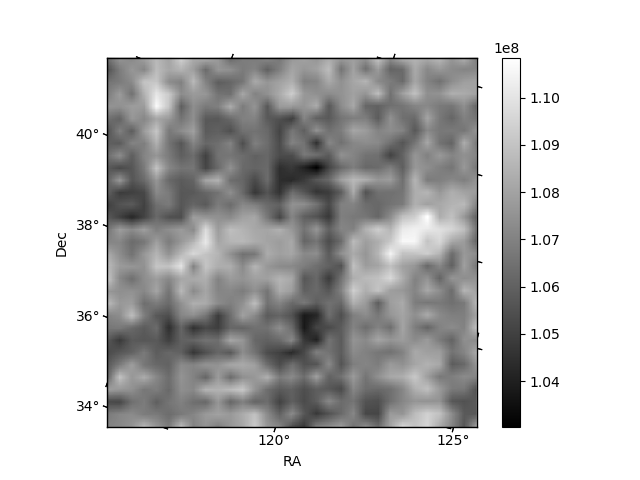
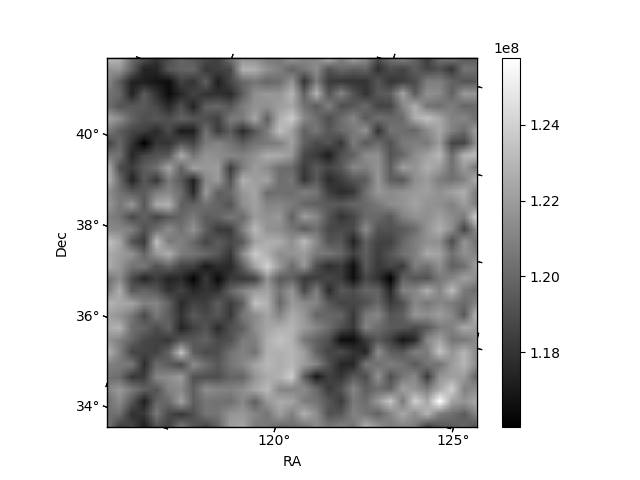
Histogram calculated using DETX and DETY for each event in the final _common_clean file
| Quadrant A | 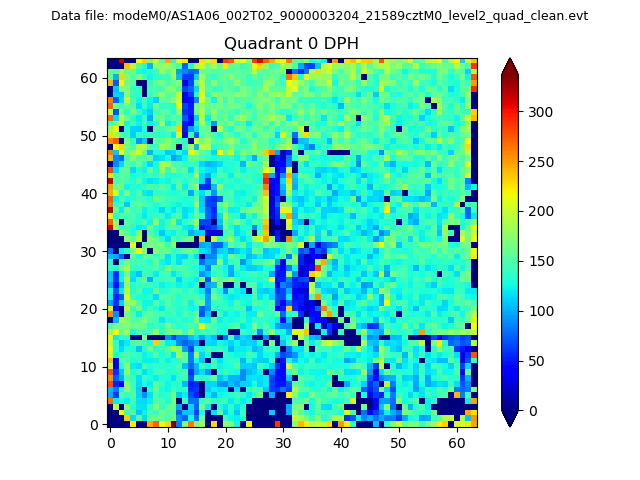 |
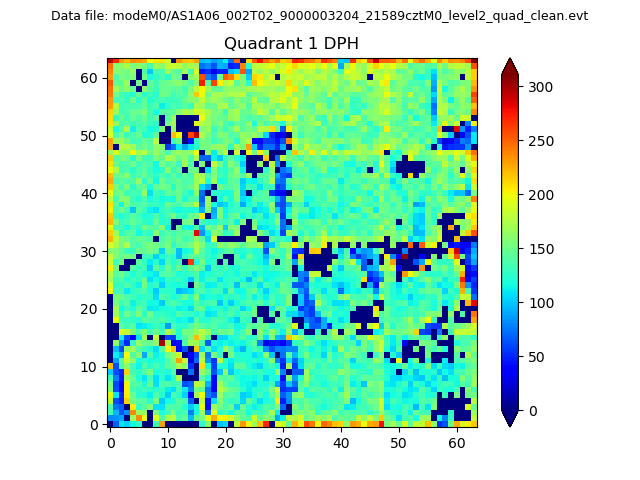 |
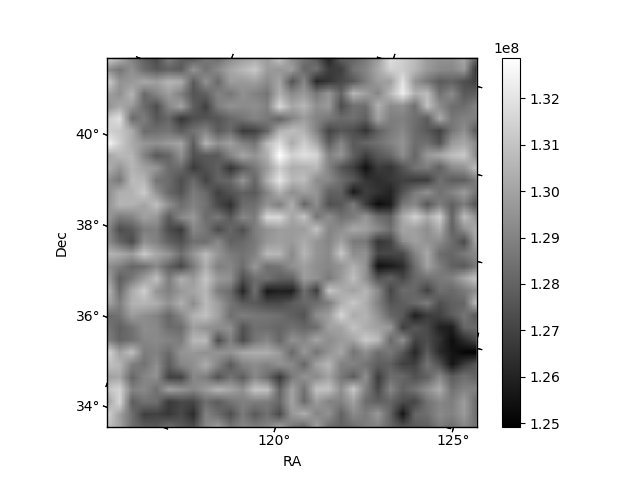
Quadrant B |
|---|---|---|---|
| Quadrant D | 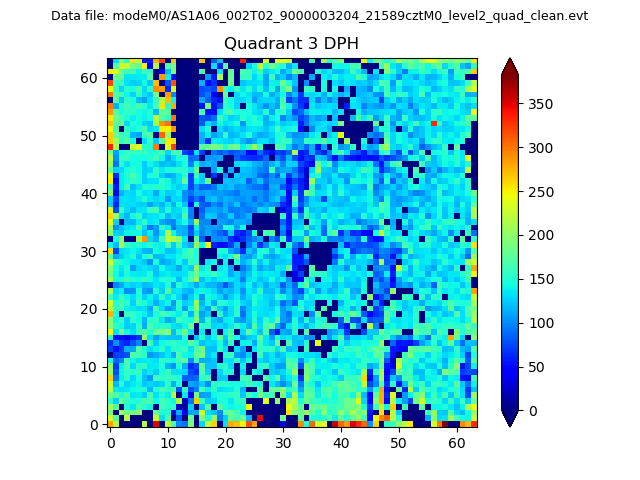 |
 |
Quadrant C |
| Plot type | Count rate plots | Images |
|---|---|---|
| Comparison with Poisson distribution Blue bars denote a histogram of data divided into 1 sec bins. Red curve is a Poisson curve with rate = median count rate of data. |
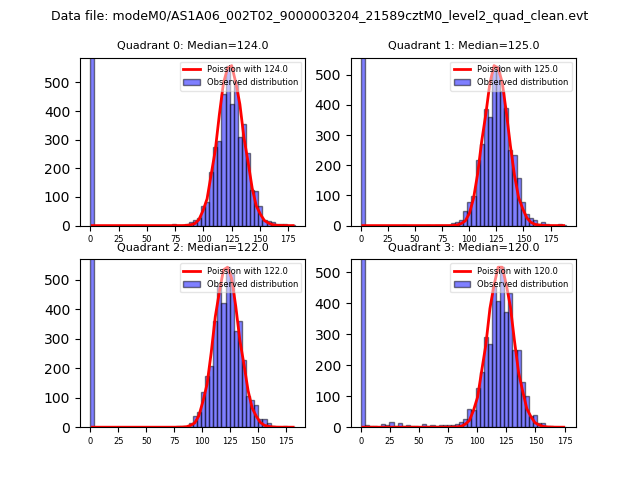 |
 |
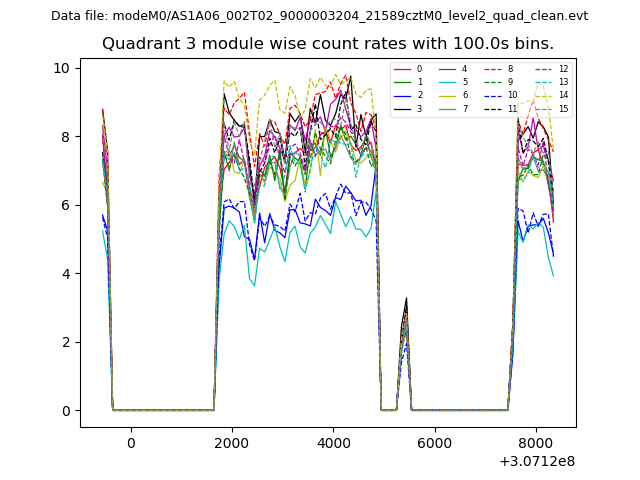
| Quadrant-wise count rates Data is divided into 100 sec bins |
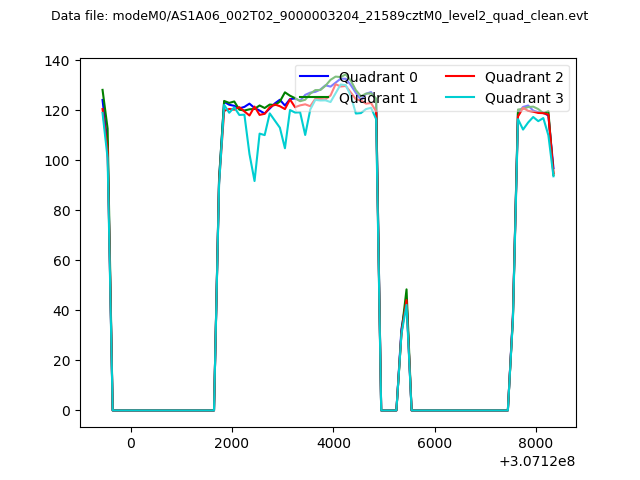 |
|
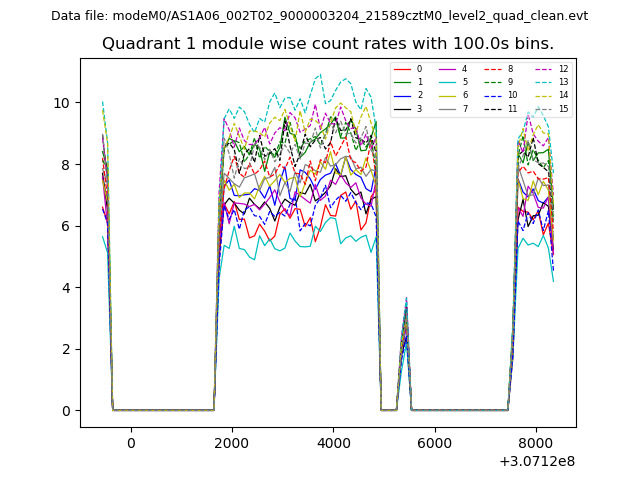
| Module-wise count rates for Quadrant A Data is divided into 100 sec bins |
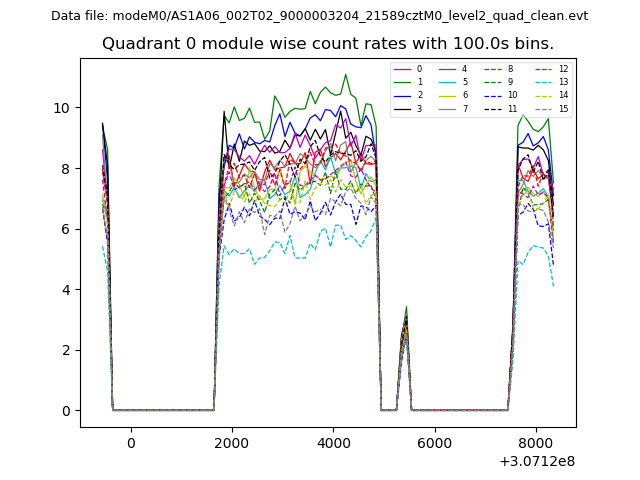 |
 |
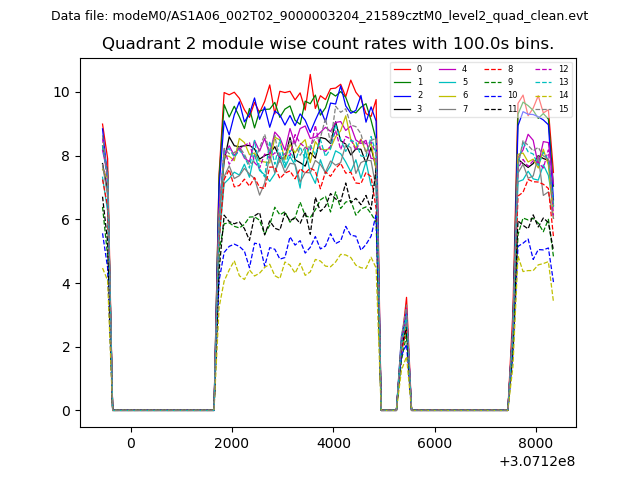
| Module-wise count rates for Quadrant B Data is divided into 100 sec bins |
 |
 |
| Module-wise count rates for Quadrant C Data is divided into 100 sec bins |
 |
 |
| Module-wise count rates for Quadrant D Data is divided into 100 sec bins |
 |
 |
| Parameter | Plot |
|---|---|
| CZT HV Monitor | 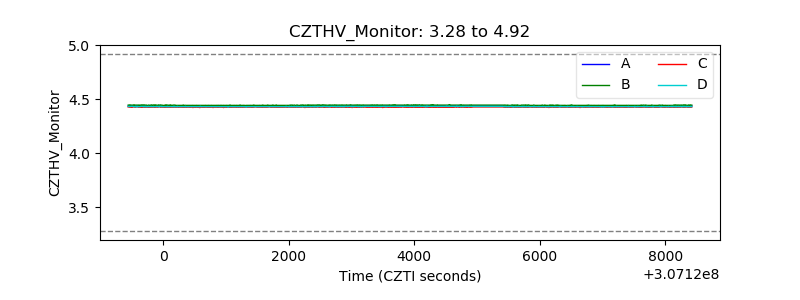 |
| D_VDD | 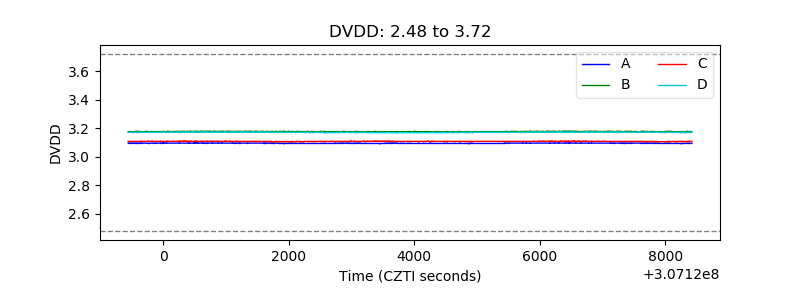 |
| Temperature 1 | 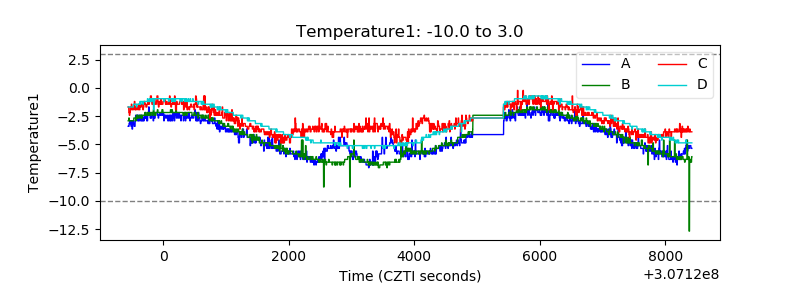 |
| Veto HV Monitor | 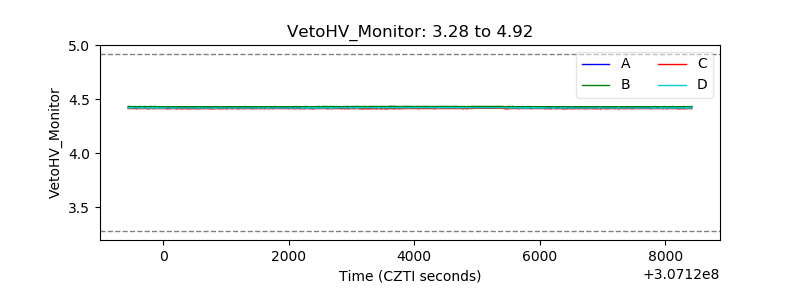 |
| Veto LLD | 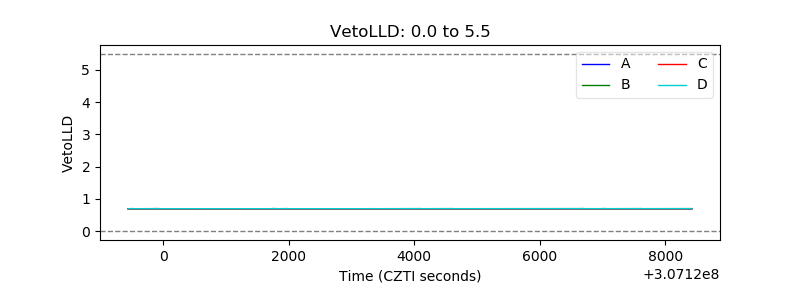 |
| Alpha Counter | 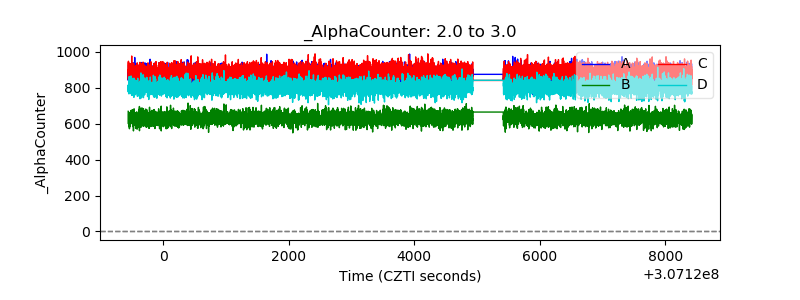 |
| _CPM_Rate | 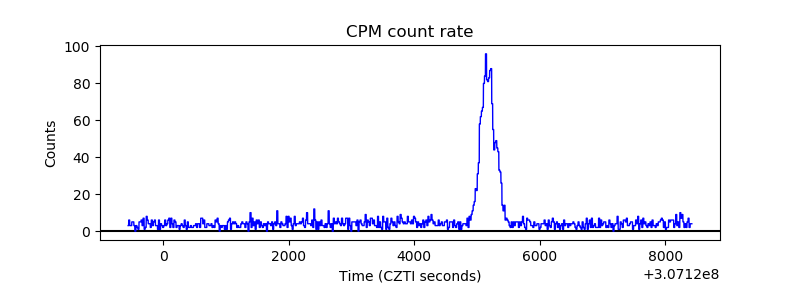 |
| CZT Counter | 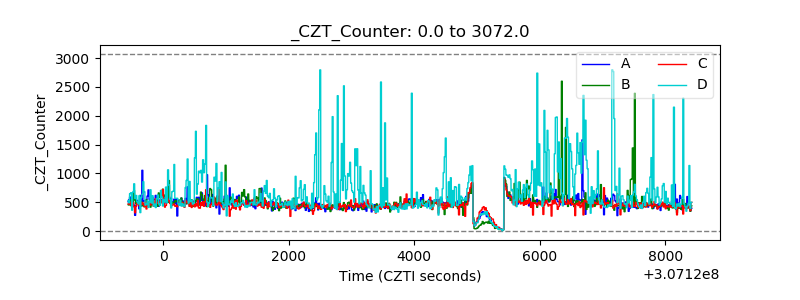 |
| +2.5 Volts monitor | 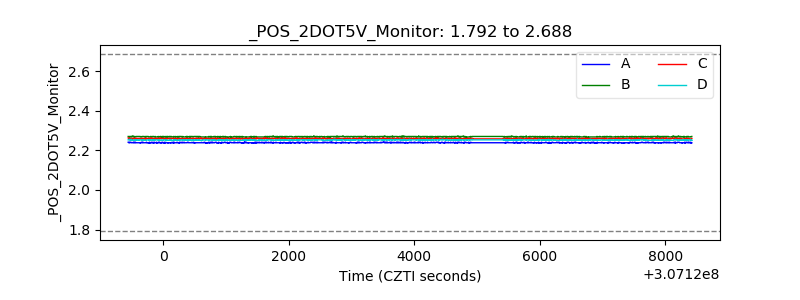 |
| +5 Volts monitor |  |
| _ROLL_ROT | 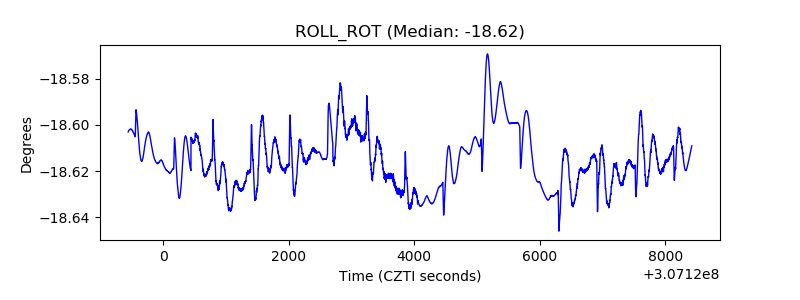 |
| _Roll_DEC | 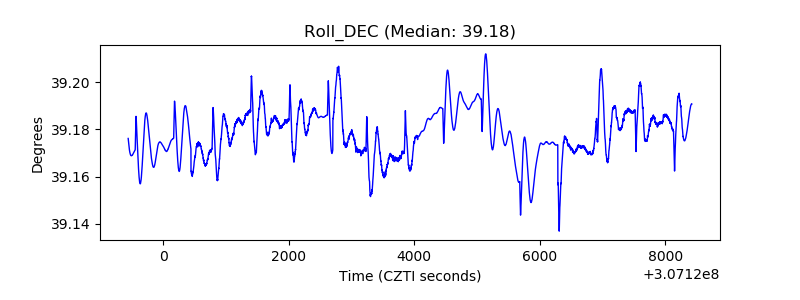 |
| _Roll_RA | 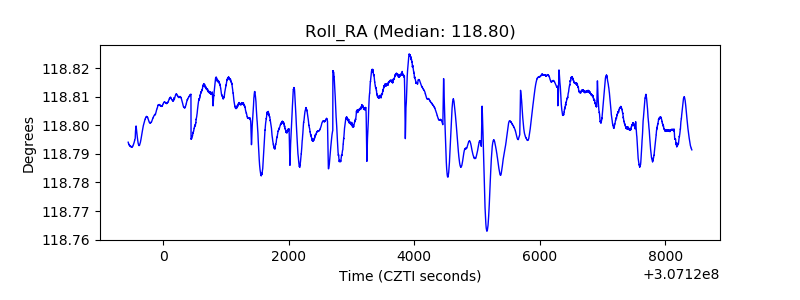 |
| Veto Counter | 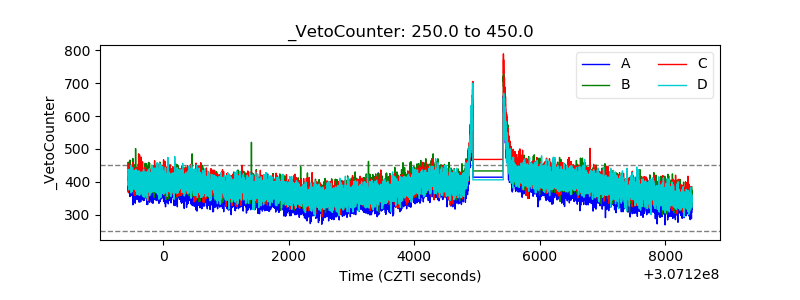 |