| Param | Original file | Final file |
|---|---|---|
| Filename | modeM0/AS1A06_002T02_9000003204_21590cztM0_level2.evt | modeM0/AS1A06_002T02_9000003204_21590cztM0_level2_quad_clean.evt |
| Size (bytes) | 688,066,560 | 129,438,720 |
| Size | 656.2 MB | 123.4 MB |
| Events in quadrant A | 5,222,547 | 822,886 |
| Events in quadrant B | 4,763,017 | 827,555 |
| Events in quadrant C | 4,550,437 | 808,588 |
| Events in quadrant D | 5,648,676 | 792,826 |
| Mode M0 | |||
|---|---|---|---|
| Quadrant | BADHDUFLAG | Total packets | Discarded packets |
| A | 0 | 22189 | 0 |
| B | 0 | 20419 | 0 |
| C | 0 | 19770 | 0 |
| D | 0 | 23362 | 0 |
| Mode SS | |||
|---|---|---|---|
| Quadrant | BADHDUFLAG | Total packets | Discarded packets |
| A | 0 | 198 | 0 |
| B | 0 | 198 | 0 |
| C | 0 | 198 | 0 |
| D | 0 | 198 | 0 |
| Mode M9 | |||
|---|---|---|---|
| Quadrant | BADHDUFLAG | Total packets | Discarded packets |
| A | 0 | 15 | 0 |
| B | 0 | 15 | 0 |
| C | 0 | 15 | 0 |
| D | 0 | 15 | 0 |
| Quadrant | Total seconds | Saturated seconds | Saturation percentage |
|---|---|---|---|
| A | 9637 | 157 | 1.629138% |
| B | 9637 | 111 | 1.151811% |
| C | 9637 | 115 | 1.193317% |
| D | 9638 | 425 | 4.409629% |
Noise dominated data is calculated using 1-second bins in cleaned event files. If a bin has >2000 counts, and if more than 50% of those come from <1% of pixels, then it is considered to be noise-dominated and hence unusable.
| Quadrant | # 1 sec bins | Bins with >0 counts | Bins with >2000 counts | High rate bins dominated by noise | Noise dominated (total time) | Noise dominated (detector-on time) | Marked lightcurve |
|---|---|---|---|---|---|---|---|
| A | 11157 | 9639 | 53 | 53 | 0.48% | 0.55% | 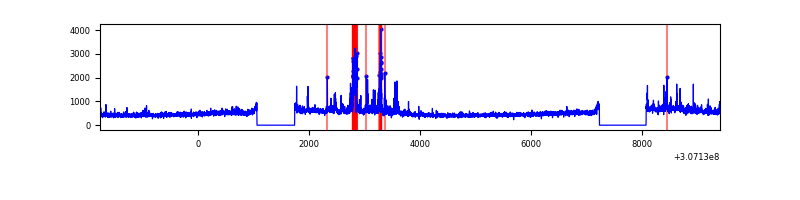 |
| B | 11157 | 9639 | 19 | 19 | 0.17% | 0.20% | 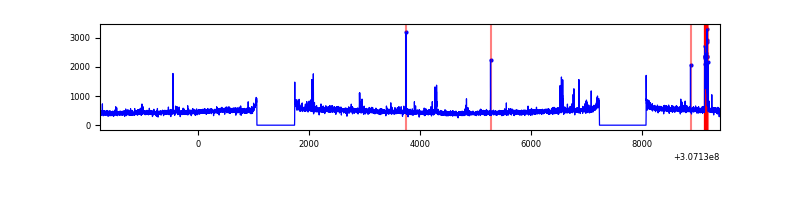 |
| C | 11157 | 9639 | 0 | 0 | 0.00% | 0.00% | 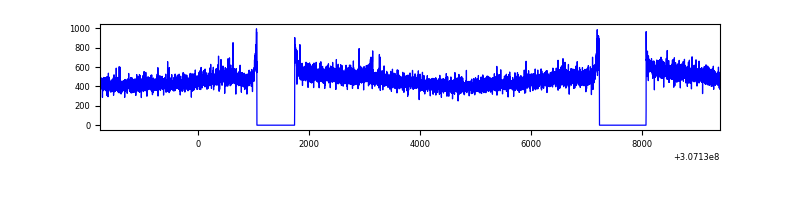 |
| D | 11158 | 9640 | 227 | 227 | 2.03% | 2.35% | 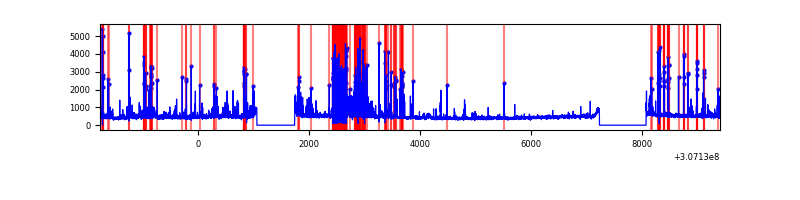 |
Top three noisy pixels from each quadrant. If the there are fewer than three noisy pixels in the level2.evt file, extra rows are filled as -1
| Pixel properties | Quadrant properties | ||||||
|---|---|---|---|---|---|---|---|
| Quadrant | DetID | PixID | Counts | Sigma | Mean | Median | Sigma |
| A | 15 | 236 | 744968 | 3179.91 | 1161 | 1135 | 233.9 |
| A | 13 | 254 | 13243 | 51.76 | 1161 | 1135 | 233.9 |
| A | 0 | 226 | 9987 | 37.84 | 1161 | 1135 | 233.9 |
| B | 3 | 64 | 125354 | 553.58 | 1160 | 1131 | 224.4 |
| B | 0 | 230 | 37437 | 161.79 | 1160 | 1131 | 224.4 |
| B | 0 | 229 | 31124 | 133.66 | 1160 | 1131 | 224.4 |
| C | 14 | 238 | 172171 | 649.68 | 1120 | 1127 | 263.3 |
| C | 3 | 233 | 9759 | 32.79 | 1120 | 1127 | 263.3 |
| C | 13 | 61 | 7788 | 25.3 | 1120 | 1127 | 263.3 |
| D | 1 | 52 | 1128446 | 4175.35 | 1113 | 1080 | 270.0 |
| D | 2 | 136 | 178401 | 656.73 | 1113 | 1080 | 270.0 |
| D | 2 | 234 | 37965 | 136.61 | 1113 | 1080 | 270.0 |
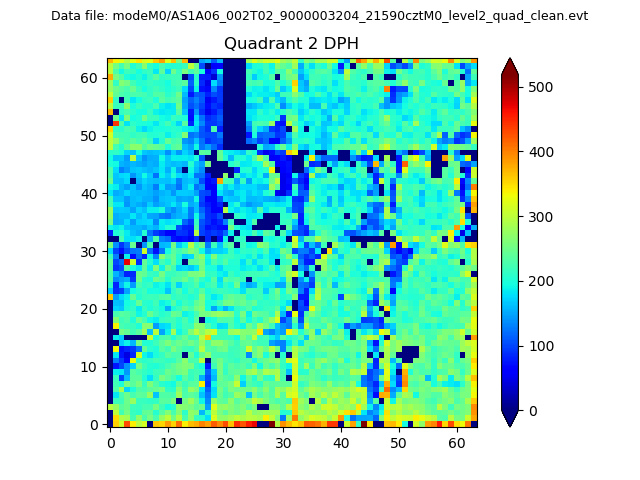
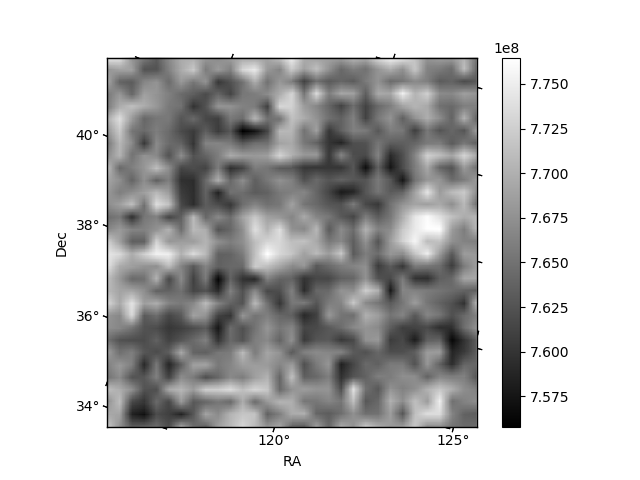
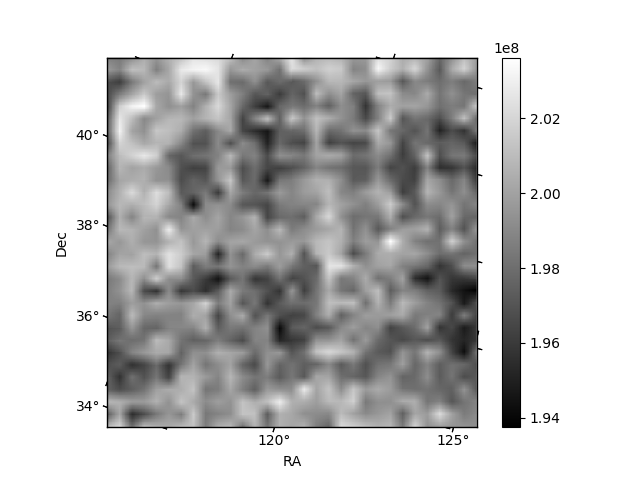
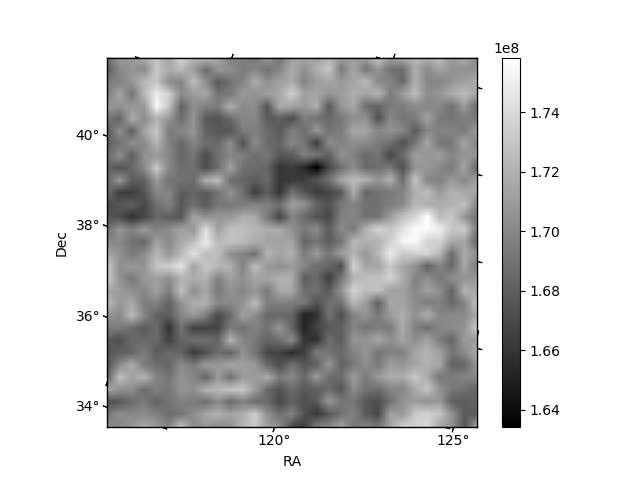
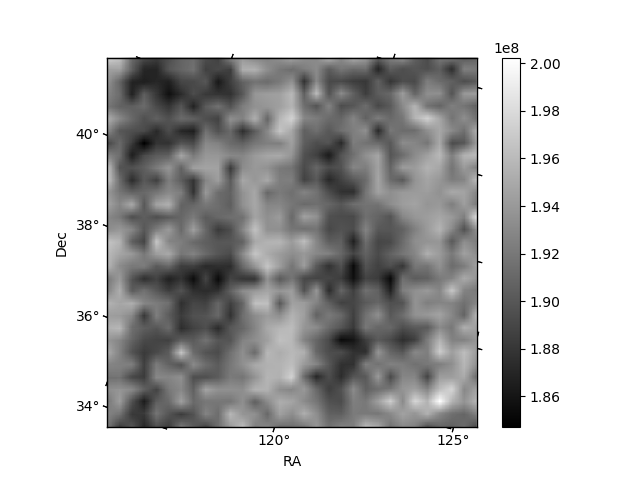
Histogram calculated using DETX and DETY for each event in the final _common_clean file
| Quadrant A | 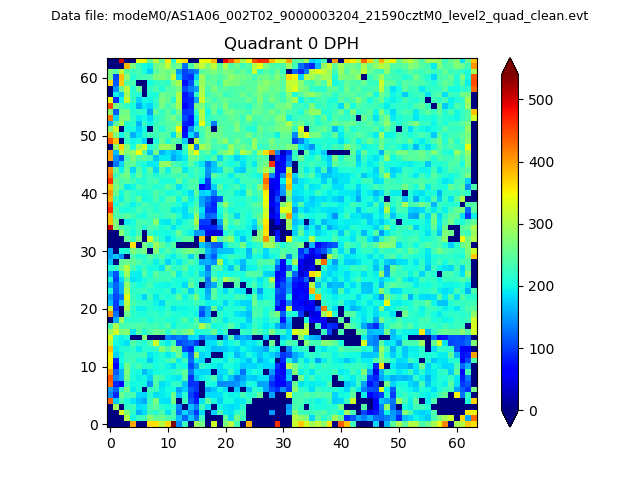 |
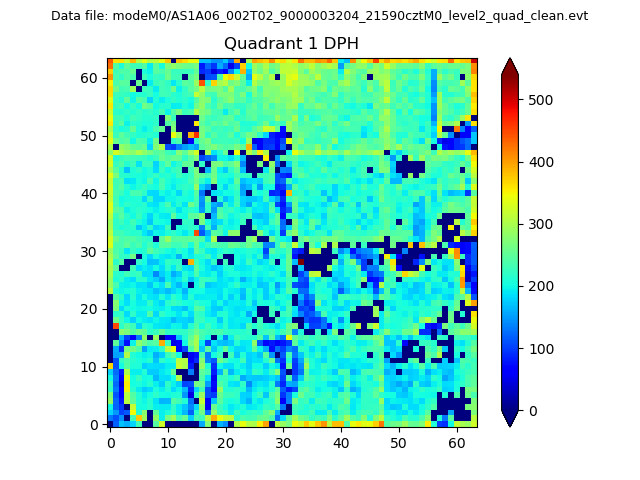 |
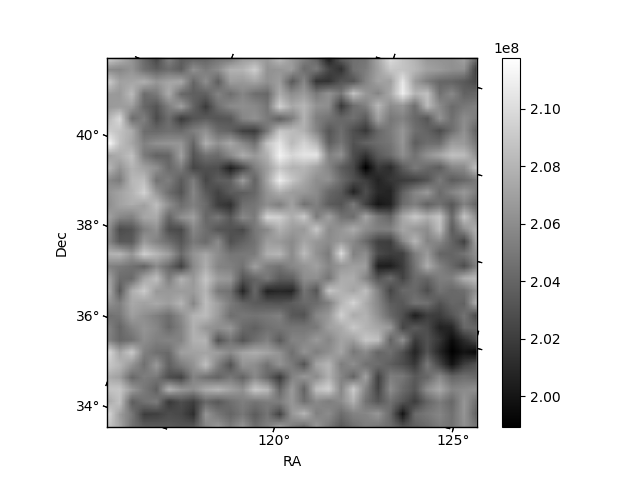
Quadrant B |
|---|---|---|---|
| Quadrant D | 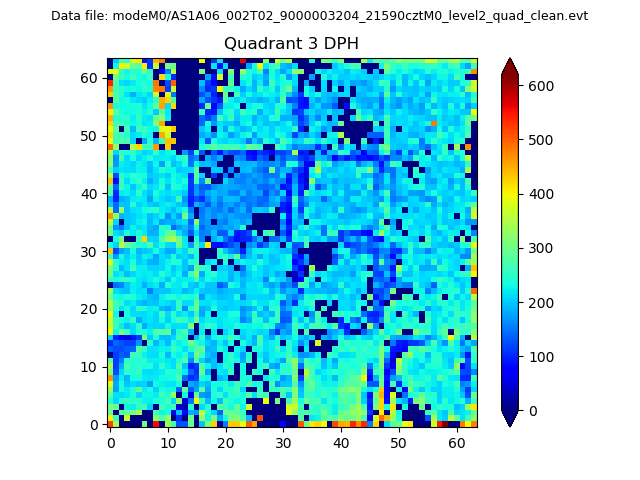 |
 |
Quadrant C |
| Plot type | Count rate plots | Images |
|---|---|---|
| Comparison with Poisson distribution Blue bars denote a histogram of data divided into 1 sec bins. Red curve is a Poisson curve with rate = median count rate of data. |
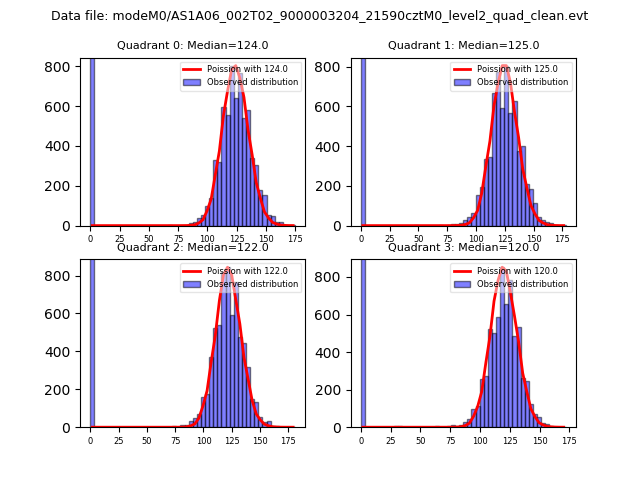 |
 |
| Quadrant-wise count rates Data is divided into 100 sec bins |
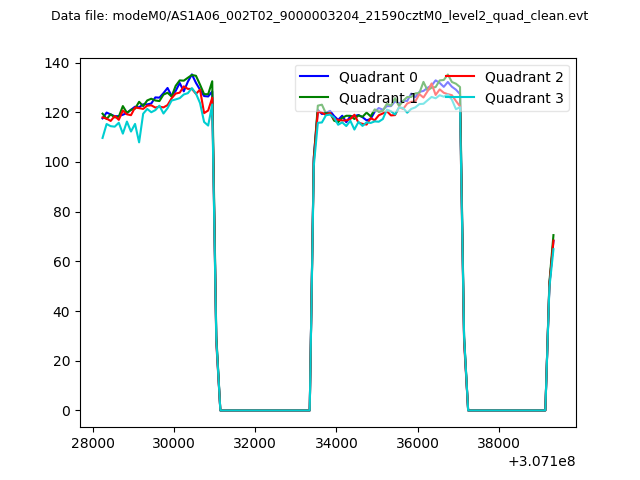 |
|
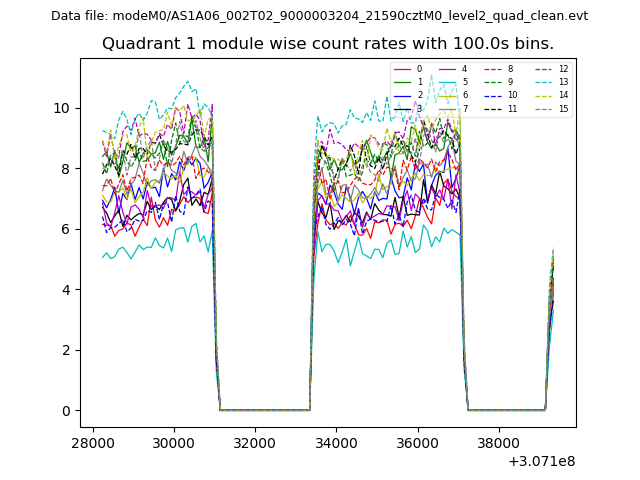
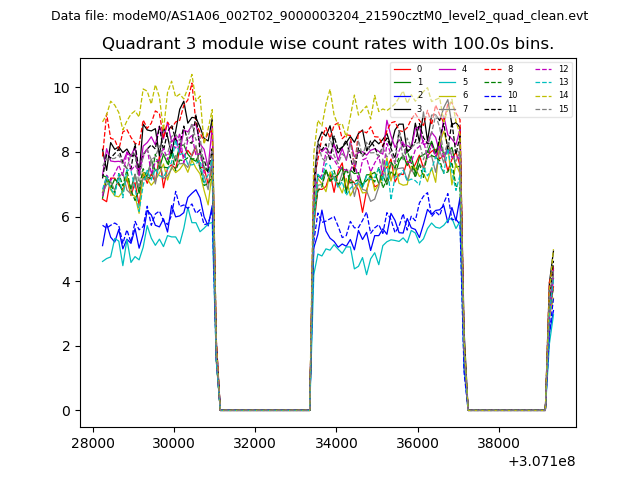
| Module-wise count rates for Quadrant A Data is divided into 100 sec bins |
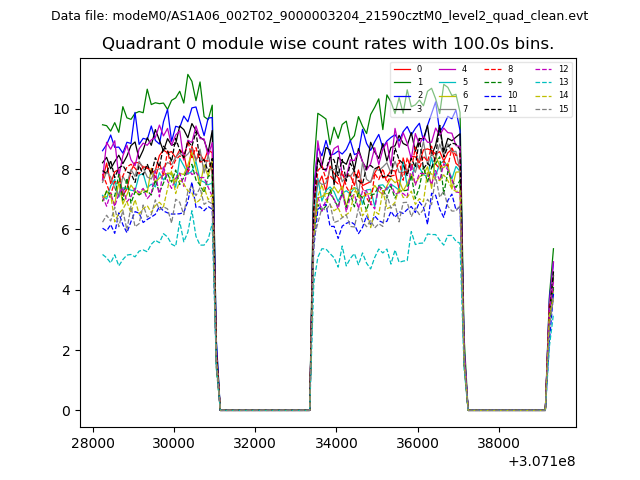 |
 |
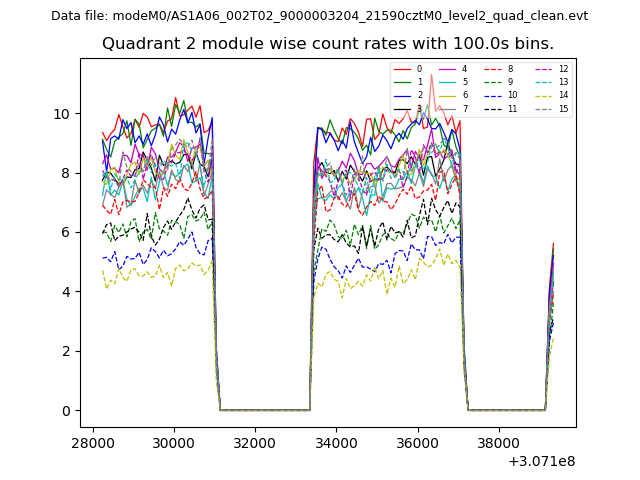
| Module-wise count rates for Quadrant B Data is divided into 100 sec bins |
 |
 |
| Module-wise count rates for Quadrant C Data is divided into 100 sec bins |
 |
 |
| Module-wise count rates for Quadrant D Data is divided into 100 sec bins |
 |
 |
| Parameter | Plot |
|---|---|
| CZT HV Monitor | 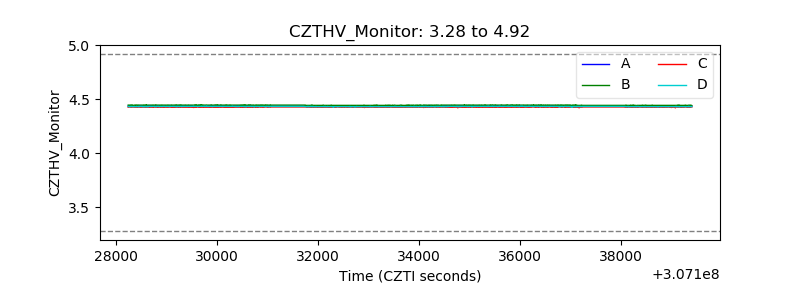 |
| D_VDD | 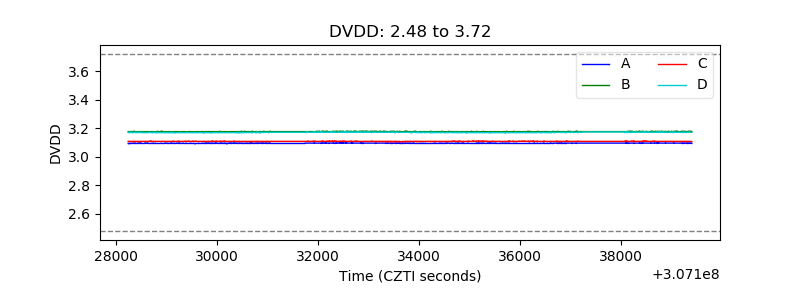 |
| Temperature 1 | 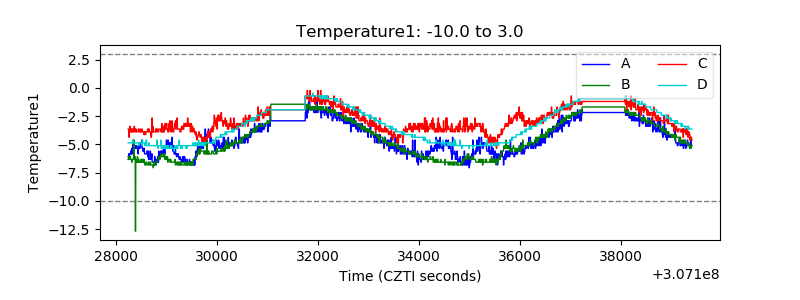 |
| Veto HV Monitor | 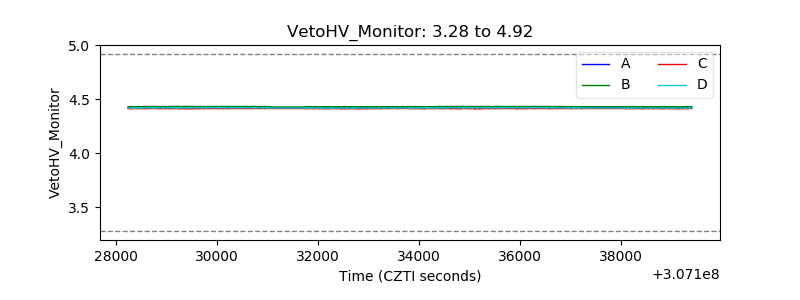 |
| Veto LLD | 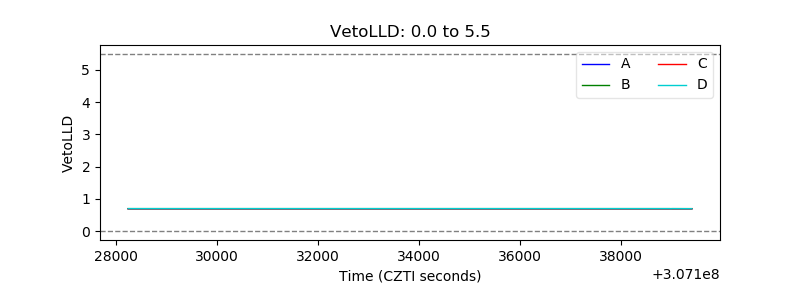 |
| Alpha Counter | 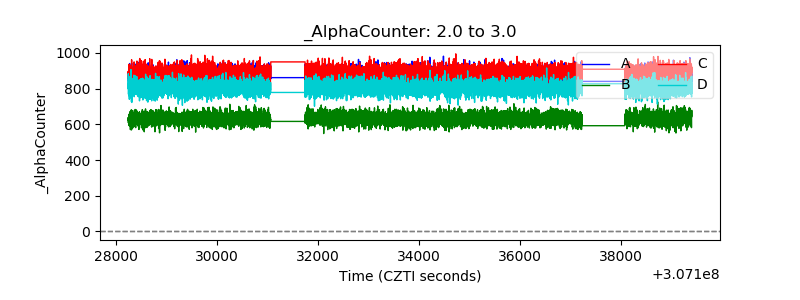 |
| _CPM_Rate | 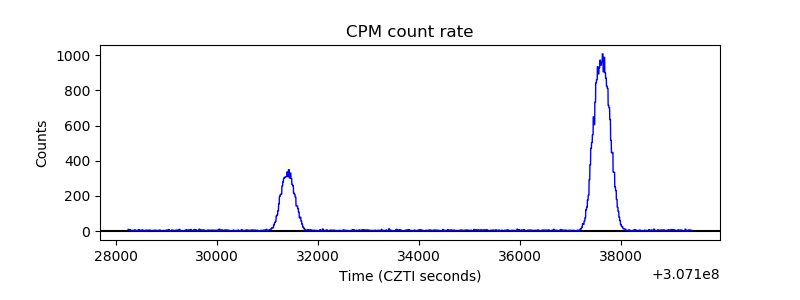 |
| CZT Counter | 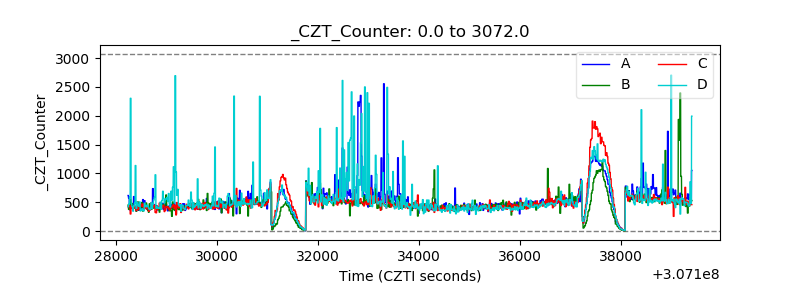 |
| +2.5 Volts monitor |  |
| +5 Volts monitor |  |
| _ROLL_ROT | 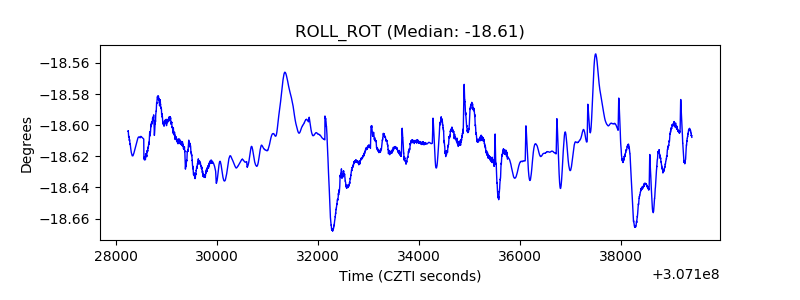 |
| _Roll_DEC | 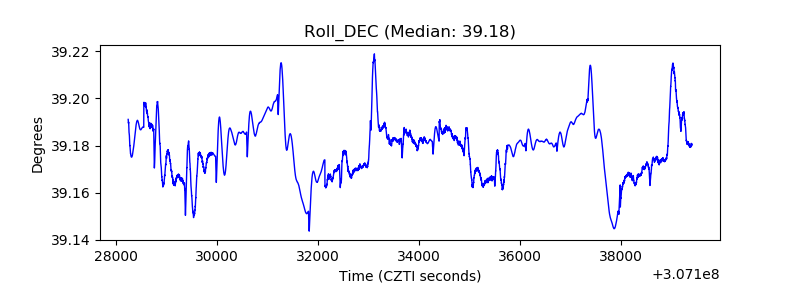 |
| _Roll_RA | 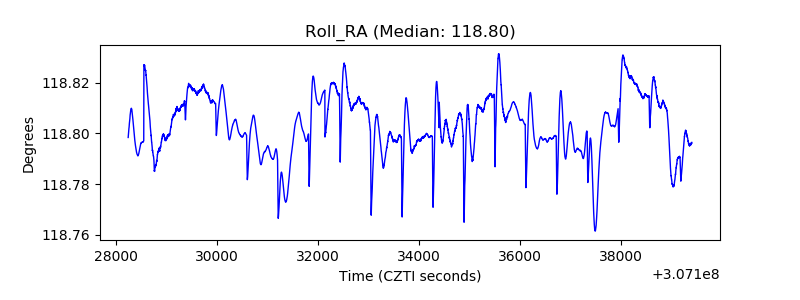 |
| Veto Counter |  |