| Param | Original file | Final file |
|---|---|---|
| Filename | modeM0/AS1A05_094T01_9000003204_21596cztM0_level2.evt | modeM0/AS1A05_094T01_9000003204_21596cztM0_level2_quad_clean.evt |
| Size (bytes) | 438,762,240 | 87,621,120 |
| Size | 418.4 MB | 83.6 MB |
| Events in quadrant A | 4,238,657 | 556,122 |
| Events in quadrant B | 2,881,605 | 598,489 |
| Events in quadrant C | 2,765,729 | 568,834 |
| Events in quadrant D | 3,023,997 | 540,912 |
| Mode M0 | |||
|---|---|---|---|
| Quadrant | BADHDUFLAG | Total packets | Discarded packets |
| A | 0 | 16100 | 1 |
| B | 0 | 11963 | 1 |
| C | 0 | 11600 | 1 |
| D | 0 | 12725 | 1 |
| Mode M9 | |||
|---|---|---|---|
| Quadrant | BADHDUFLAG | Total packets | Discarded packets |
| A | 0 | 14 | 0 |
| B | 0 | 14 | 0 |
| C | 0 | 14 | 0 |
| D | 0 | 14 | 0 |
| Mode SS | |||
|---|---|---|---|
| Quadrant | BADHDUFLAG | Total packets | Discarded packets |
| A | 0 | 112 | 0 |
| B | 0 | 112 | 0 |
| C | 0 | 112 | 0 |
| D | 0 | 112 | 0 |
| Quadrant | Total seconds | Saturated seconds | Saturation percentage |
|---|---|---|---|
| A | 5564 | 572 | 10.280374% |
| B | 5565 | 51 | 0.916442% |
| C | 5565 | 68 | 1.221923% |
| D | 5565 | 101 | 1.814915% |
Noise dominated data is calculated using 1-second bins in cleaned event files. If a bin has >2000 counts, and if more than 50% of those come from <1% of pixels, then it is considered to be noise-dominated and hence unusable.
| Quadrant | # 1 sec bins | Bins with >0 counts | Bins with >2000 counts | High rate bins dominated by noise | Noise dominated (total time) | Noise dominated (detector-on time) | Marked lightcurve |
|---|---|---|---|---|---|---|---|
| A | 6959 | 5565 | 500 | 500 | 7.18% | 8.98% | 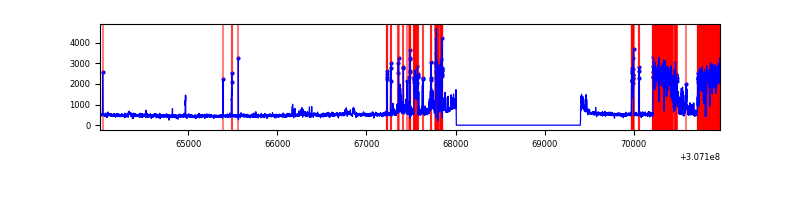 |
| B | 6960 | 5566 | 8 | 8 | 0.11% | 0.14% | 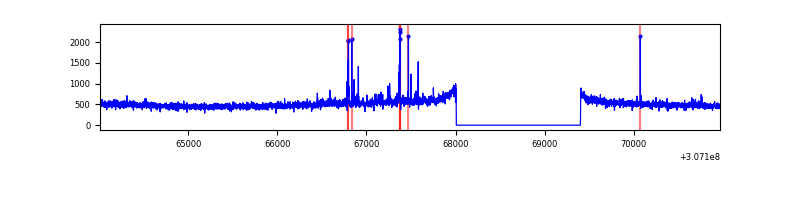 |
| C | 6960 | 5566 | 0 | 0 | 0.00% | 0.00% | 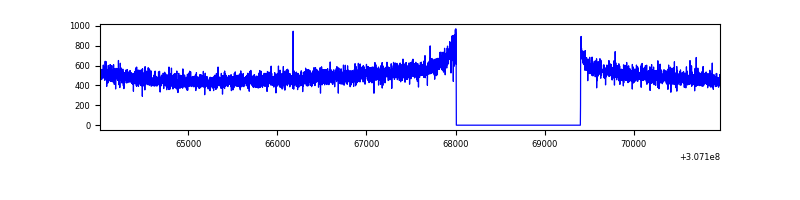 |
| D | 6960 | 5566 | 72 | 72 | 1.03% | 1.29% | 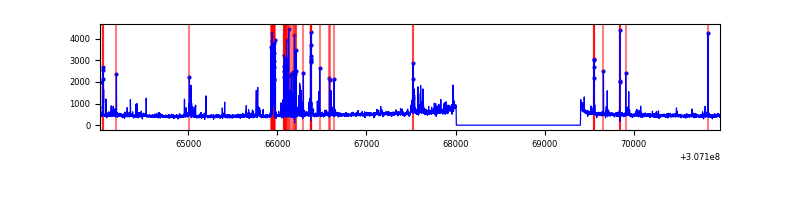 |
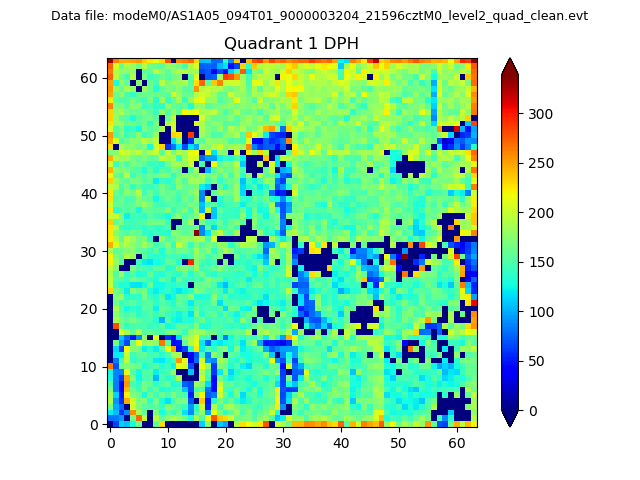
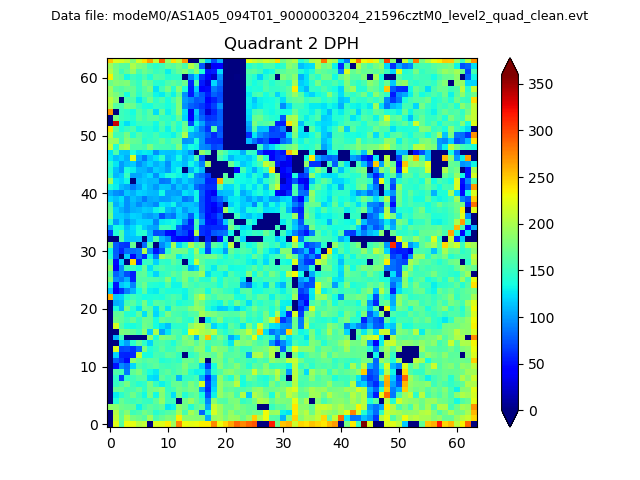
Top three noisy pixels from each quadrant. If the there are fewer than three noisy pixels in the level2.evt file, extra rows are filled as -1
| Pixel properties | Quadrant properties | ||||||
|---|---|---|---|---|---|---|---|
| Quadrant | DetID | PixID | Counts | Sigma | Mean | Median | Sigma |
| A | 15 | 236 | 1575770 | 11573.77 | 688 | 678 | 136.1 |
| A | 15 | 174 | 14836 | 104.03 | 688 | 678 | 136.1 |
| A | 13 | 254 | 7426 | 49.58 | 688 | 678 | 136.1 |
| B | 3 | 64 | 41945 | 315.72 | 711 | 694 | 130.7 |
| B | 0 | 190 | 18632 | 137.29 | 711 | 694 | 130.7 |
| B | 0 | 229 | 16528 | 121.19 | 711 | 694 | 130.7 |
| C | 14 | 238 | 109910 | 690.13 | 680 | 686 | 158.3 |
| C | 13 | 61 | 4747 | 25.66 | 680 | 686 | 158.3 |
| C | 7 | 221 | 2287 | 10.12 | 680 | 686 | 158.3 |
| D | 1 | 52 | 232338 | 1423.57 | 676 | 657 | 162.7 |
| D | 13 | 153 | 84263 | 513.72 | 676 | 657 | 162.7 |
| D | 2 | 136 | 42265 | 255.66 | 676 | 657 | 162.7 |
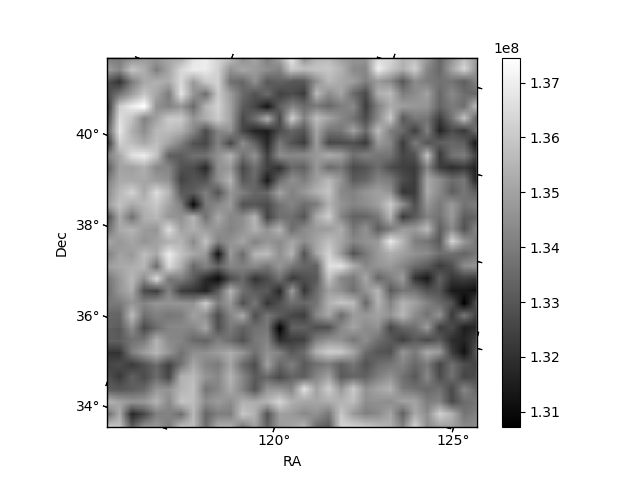
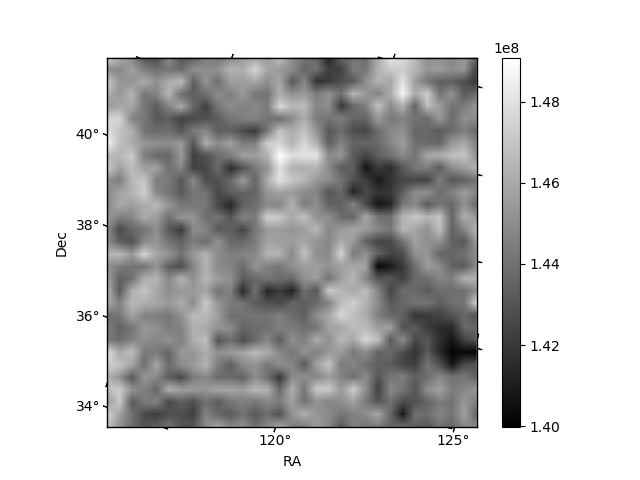
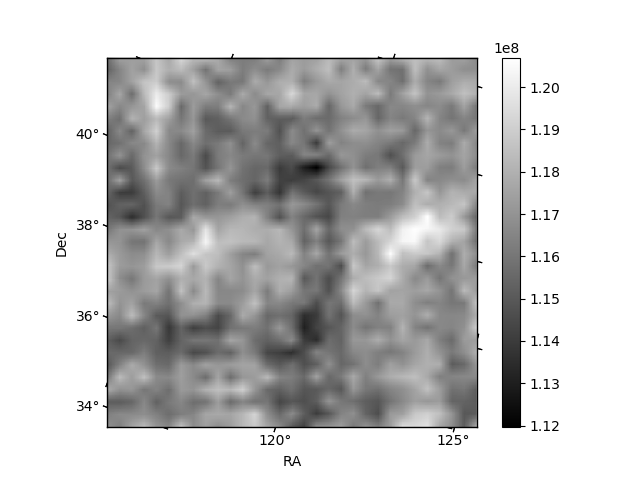
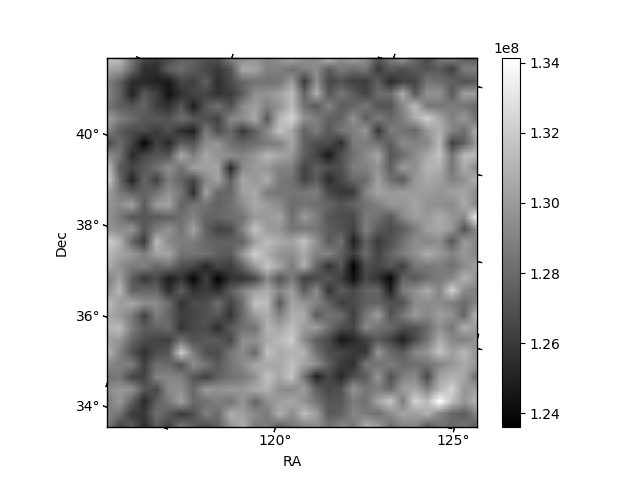
Histogram calculated using DETX and DETY for each event in the final _common_clean file
| Quadrant A | 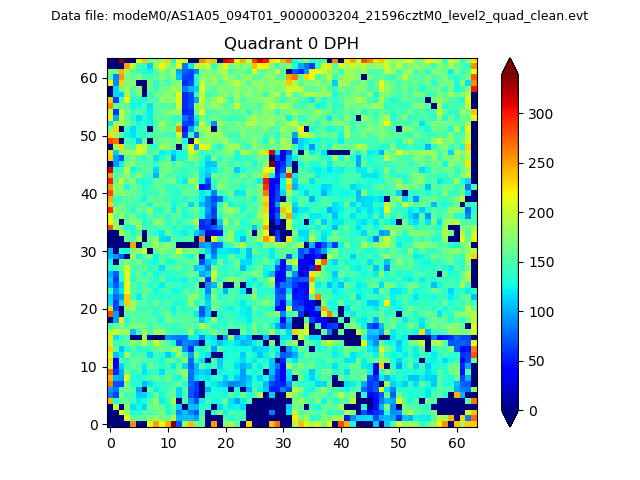 |
 |
Quadrant B |
|---|---|---|---|
| Quadrant D | 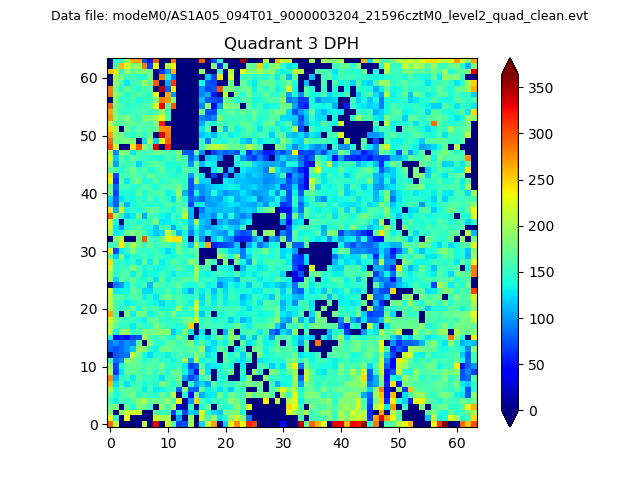 |
 |
Quadrant C |
| Plot type | Count rate plots | Images |
|---|---|---|
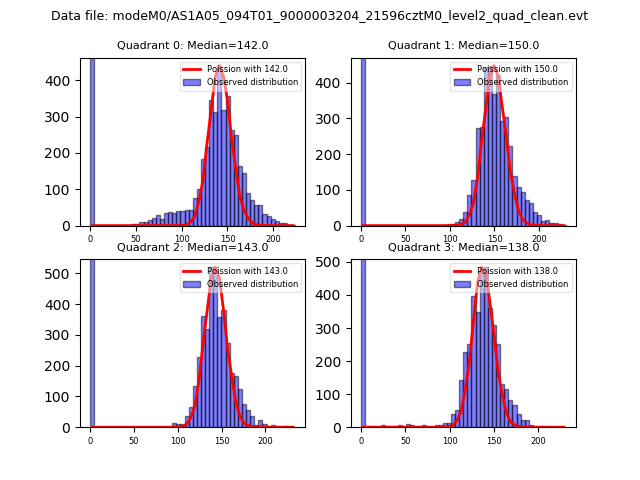
| Comparison with Poisson distribution Blue bars denote a histogram of data divided into 1 sec bins. Red curve is a Poisson curve with rate = median count rate of data. |
 |
 |
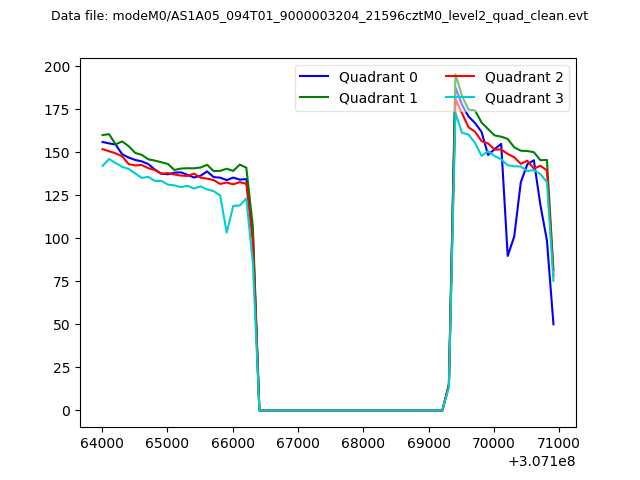
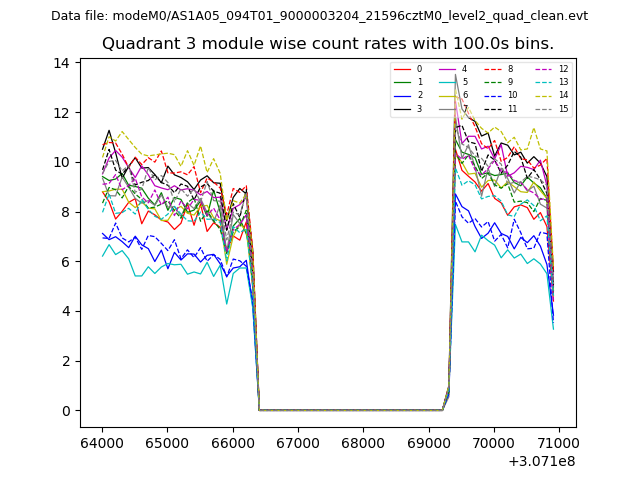
| Quadrant-wise count rates Data is divided into 100 sec bins |
 |
|
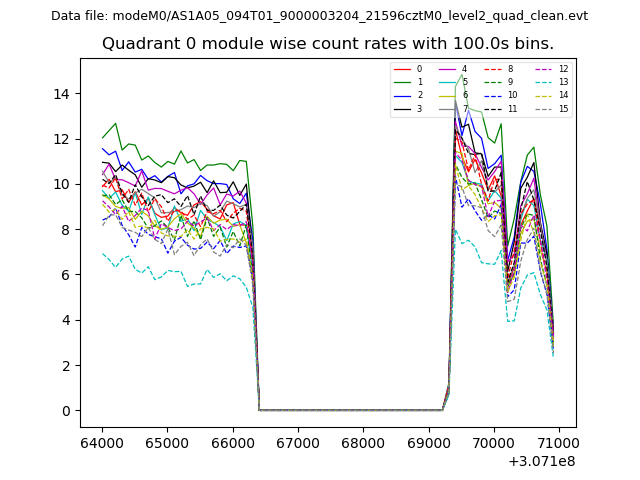
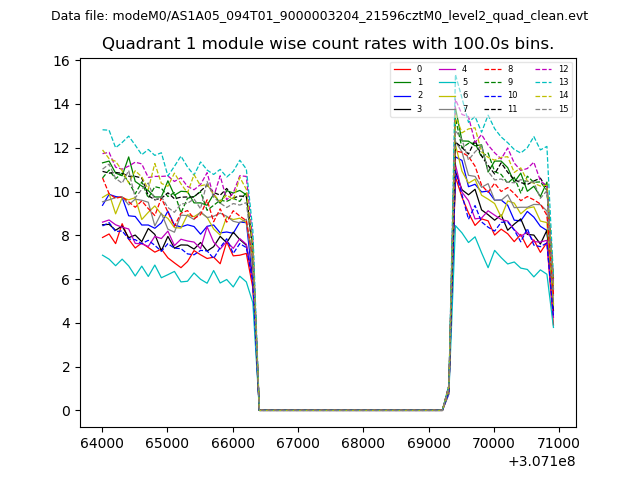
| Module-wise count rates for Quadrant A Data is divided into 100 sec bins |
 |
 |
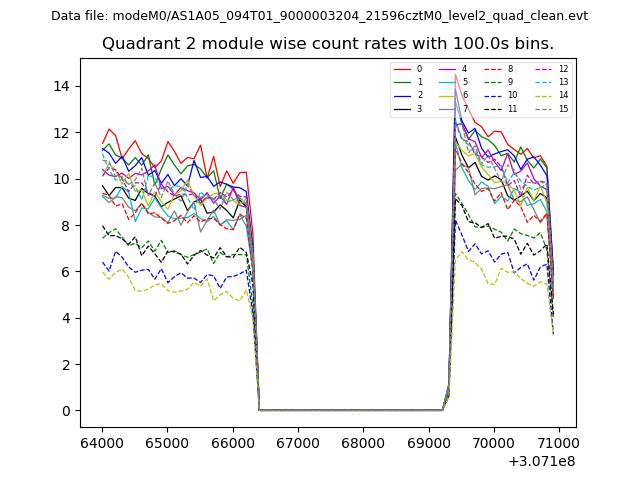
| Module-wise count rates for Quadrant B Data is divided into 100 sec bins |
 |
 |
| Module-wise count rates for Quadrant C Data is divided into 100 sec bins |
 |
 |
| Module-wise count rates for Quadrant D Data is divided into 100 sec bins |
 |
 |
| Parameter | Plot |
|---|---|
| CZT HV Monitor | 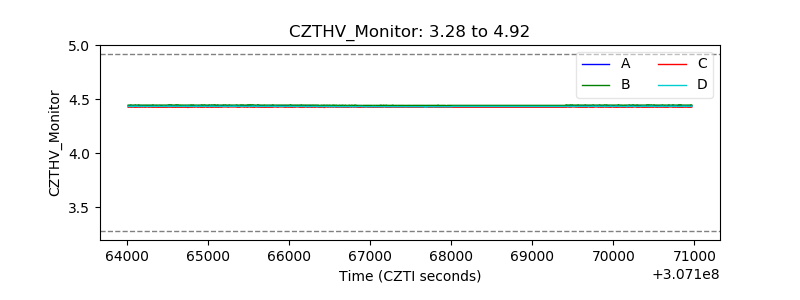 |
| D_VDD | 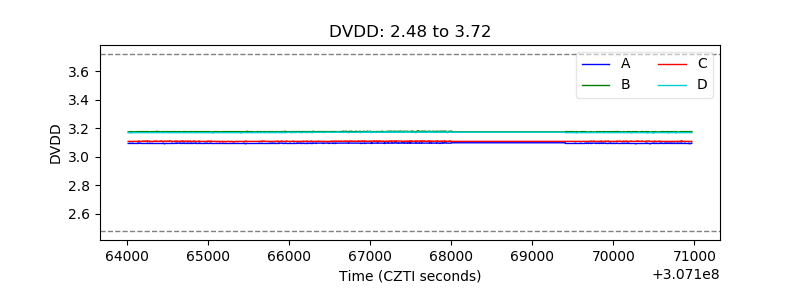 |
| Temperature 1 | 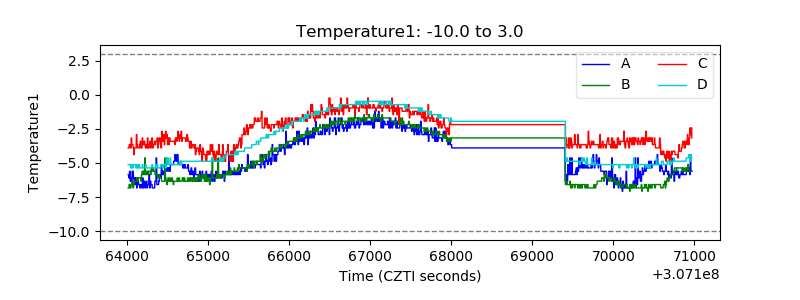 |
| Veto HV Monitor | 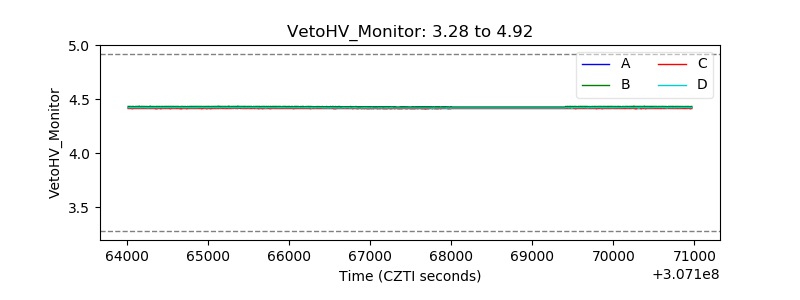 |
| Veto LLD | 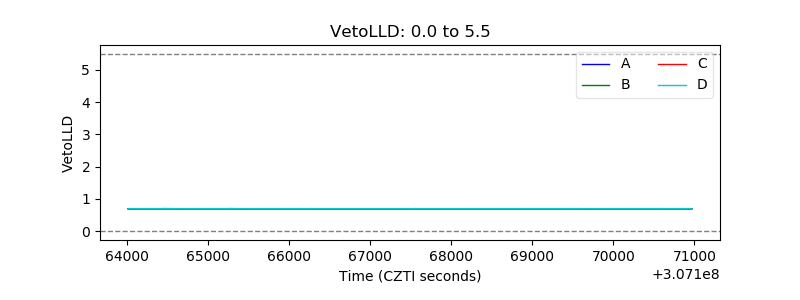 |
| Alpha Counter | 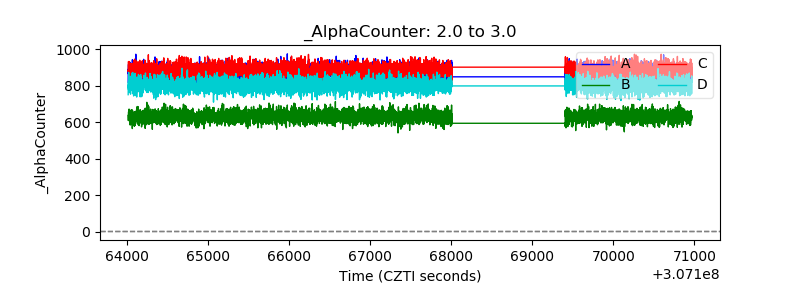 |
| _CPM_Rate | 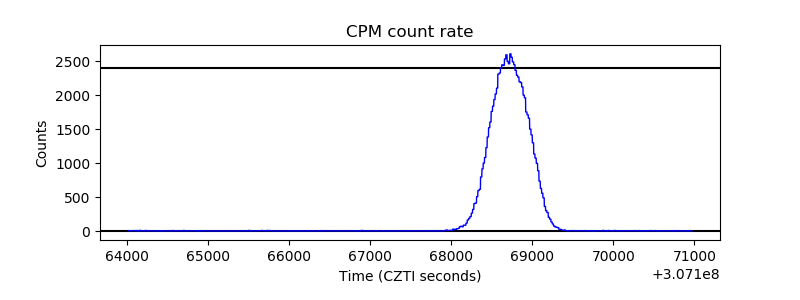 |
| CZT Counter | 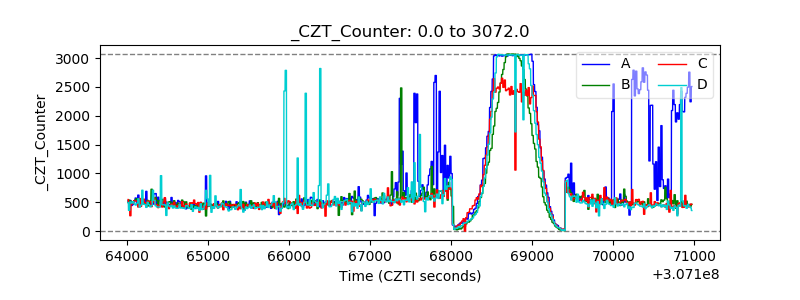 |
| +2.5 Volts monitor |  |
| +5 Volts monitor |  |
| _ROLL_ROT | 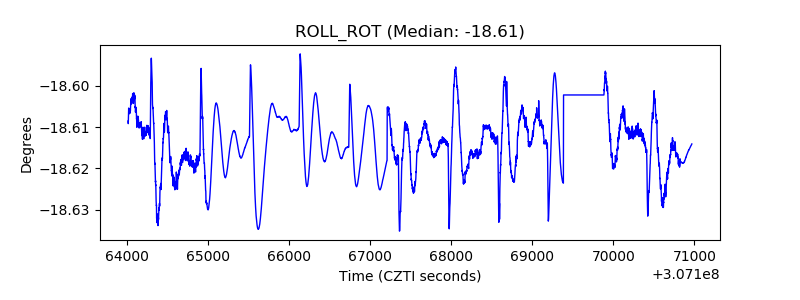 |
| _Roll_DEC | 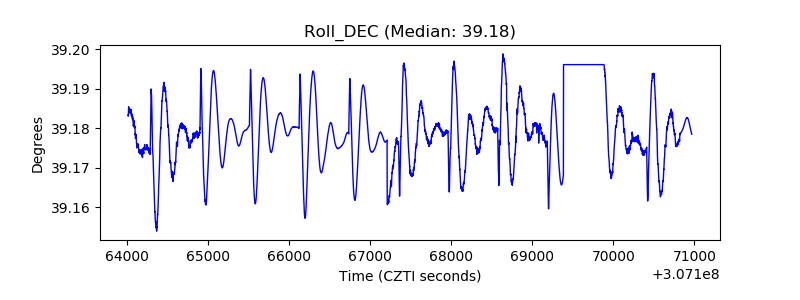 |
| _Roll_RA | 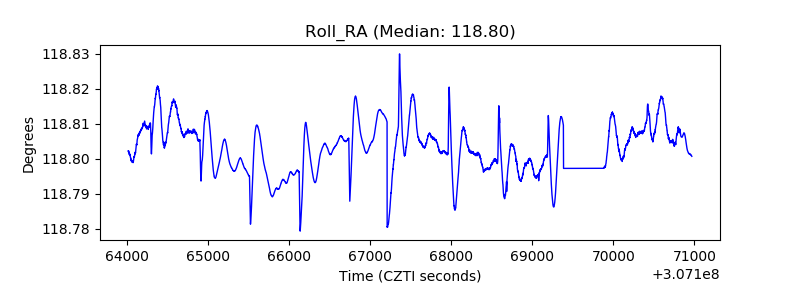 |
| Veto Counter | 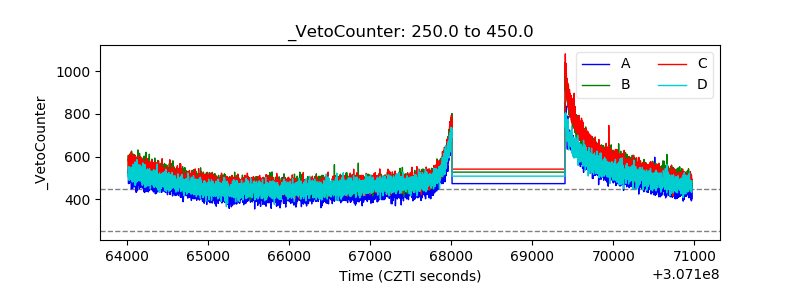 |