| Param | Original file | Final file |
|---|---|---|
| Filename | modeM0/AS1A05_094T01_9000003204_21599cztM0_level2.evt | modeM0/AS1A05_094T01_9000003204_21599cztM0_level2_quad_clean.evt |
| Size (bytes) | 441,362,880 | 89,971,200 |
| Size | 420.9 MB | 85.8 MB |
| Events in quadrant A | 3,071,861 | 573,616 |
| Events in quadrant B | 3,234,623 | 582,232 |
| Events in quadrant C | 3,090,417 | 562,310 |
| Events in quadrant D | 3,524,374 | 549,652 |
| Mode M0 | |||
|---|---|---|---|
| Quadrant | BADHDUFLAG | Total packets | Discarded packets |
| A | 0 | 13347 | 1 |
| B | 0 | 13740 | 1 |
| C | 0 | 13355 | 1 |
| D | 0 | 14770 | 1 |
| Mode M9 | |||
|---|---|---|---|
| Quadrant | BADHDUFLAG | Total packets | Discarded packets |
| A | 0 | 6 | 0 |
| B | 0 | 6 | 0 |
| C | 0 | 6 | 0 |
| D | 0 | 6 | 0 |
| Mode SS | |||
|---|---|---|---|
| Quadrant | BADHDUFLAG | Total packets | Discarded packets |
| A | 0 | 134 | 0 |
| B | 0 | 134 | 0 |
| C | 0 | 134 | 0 |
| D | 0 | 134 | 0 |
| Quadrant | Total seconds | Saturated seconds | Saturation percentage |
|---|---|---|---|
| A | 6545 | 89 | 1.359817% |
| B | 6546 | 104 | 1.588756% |
| C | 6546 | 114 | 1.741522% |
| D | 6546 | 149 | 2.276199% |
Noise dominated data is calculated using 1-second bins in cleaned event files. If a bin has >2000 counts, and if more than 50% of those come from <1% of pixels, then it is considered to be noise-dominated and hence unusable.
| Quadrant | # 1 sec bins | Bins with >0 counts | Bins with >2000 counts | High rate bins dominated by noise | Noise dominated (total time) | Noise dominated (detector-on time) | Marked lightcurve |
|---|---|---|---|---|---|---|---|
| A | 7195 | 6546 | 0 | 0 | 0.00% | 0.00% | 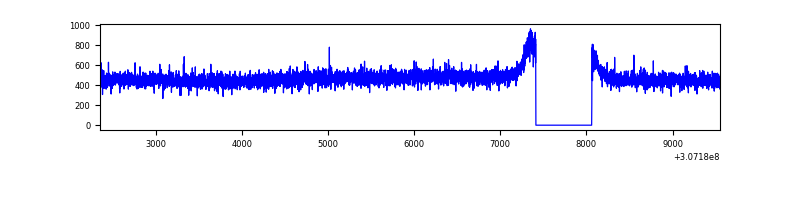 |
| B | 7196 | 6547 | 10 | 10 | 0.14% | 0.15% | 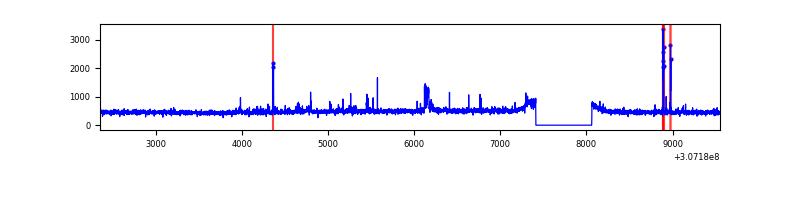 |
| C | 7196 | 6547 | 0 | 0 | 0.00% | 0.00% | 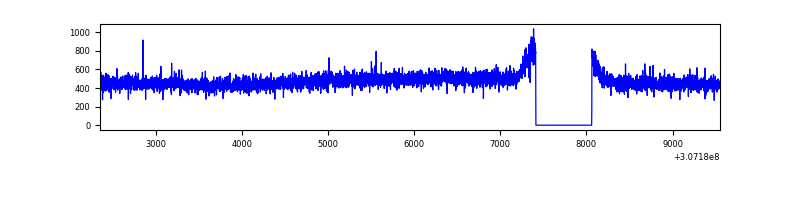 |
| D | 7196 | 6547 | 72 | 72 | 1.00% | 1.10% | 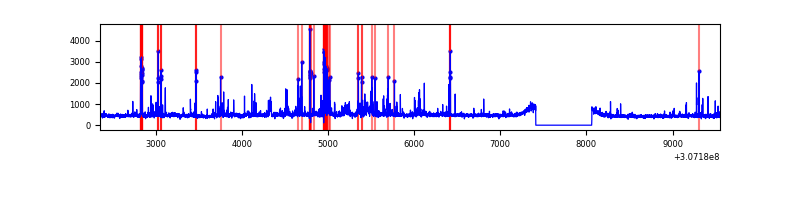 |
Top three noisy pixels from each quadrant. If the there are fewer than three noisy pixels in the level2.evt file, extra rows are filled as -1
| Pixel properties | Quadrant properties | ||||||
|---|---|---|---|---|---|---|---|
| Quadrant | DetID | PixID | Counts | Sigma | Mean | Median | Sigma |
| A | 13 | 254 | 8786 | 49.93 | 796 | 777 | 160.4 |
| A | 0 | 226 | 7087 | 39.34 | 796 | 777 | 160.4 |
| A | 3 | 137 | 6669 | 36.73 | 796 | 777 | 160.4 |
| B | 3 | 64 | 46338 | 300.64 | 790 | 770 | 151.6 |
| B | 0 | 228 | 42958 | 278.34 | 790 | 770 | 151.6 |
| B | 0 | 190 | 32708 | 210.71 | 790 | 770 | 151.6 |
| C | 14 | 238 | 121327 | 674.59 | 761 | 764 | 178.7 |
| C | 13 | 61 | 5383 | 25.84 | 761 | 764 | 178.7 |
| C | 4 | 175 | 2358 | 8.92 | 761 | 764 | 178.7 |
| D | 1 | 52 | 478088 | 2528.35 | 771 | 748 | 188.8 |
| D | 2 | 136 | 89800 | 471.69 | 771 | 748 | 188.8 |
| D | 14 | 35 | 25744 | 132.4 | 771 | 748 | 188.8 |
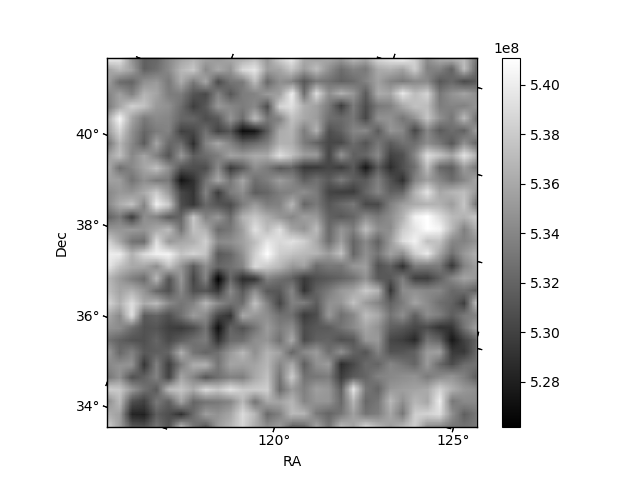
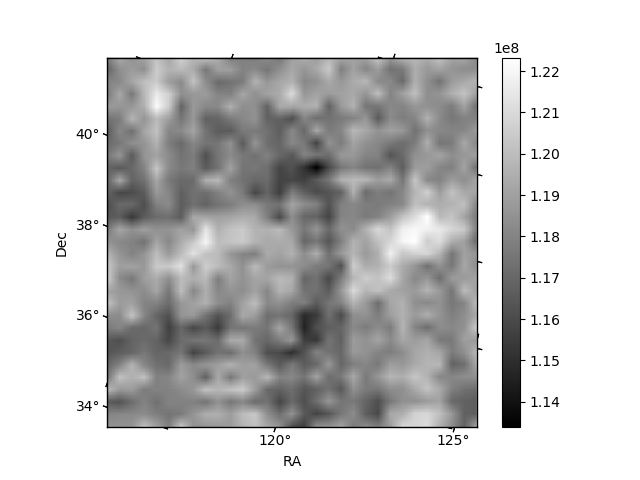
Histogram calculated using DETX and DETY for each event in the final _common_clean file
| Quadrant A | 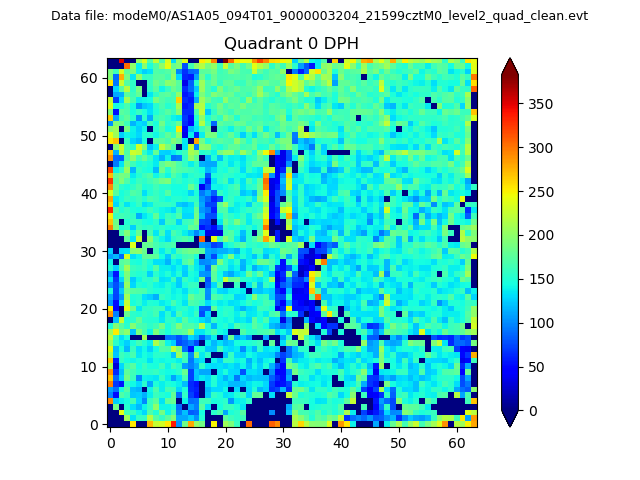 |
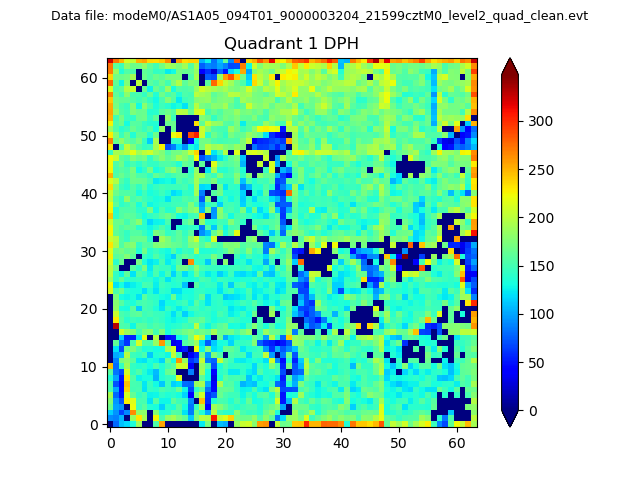 |
Quadrant B |
|---|---|---|---|
| Quadrant D |  |
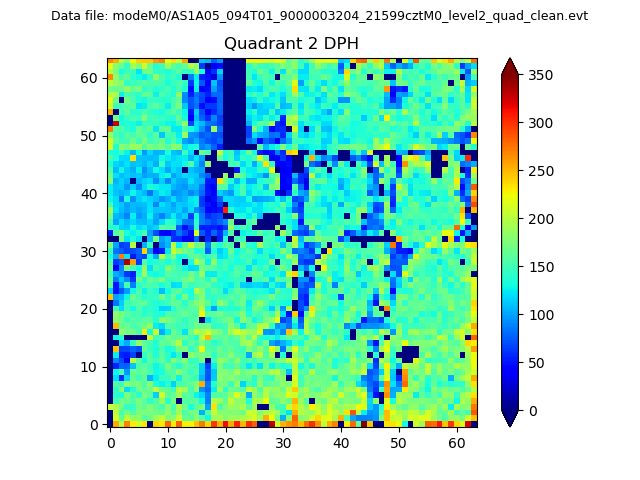 |
Quadrant C |
| Plot type | Count rate plots | Images |
|---|---|---|
| Comparison with Poisson distribution Blue bars denote a histogram of data divided into 1 sec bins. Red curve is a Poisson curve with rate = median count rate of data. |
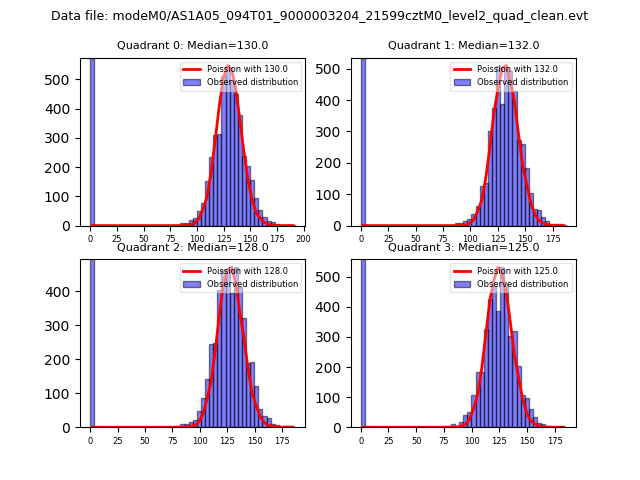 |
 |
| Quadrant-wise count rates Data is divided into 100 sec bins |
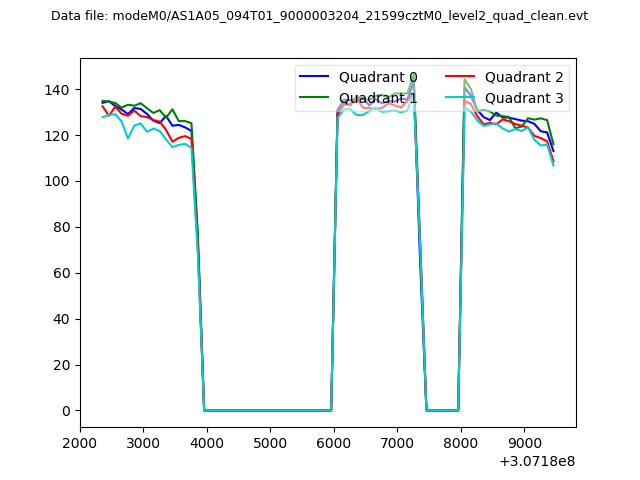 |
|
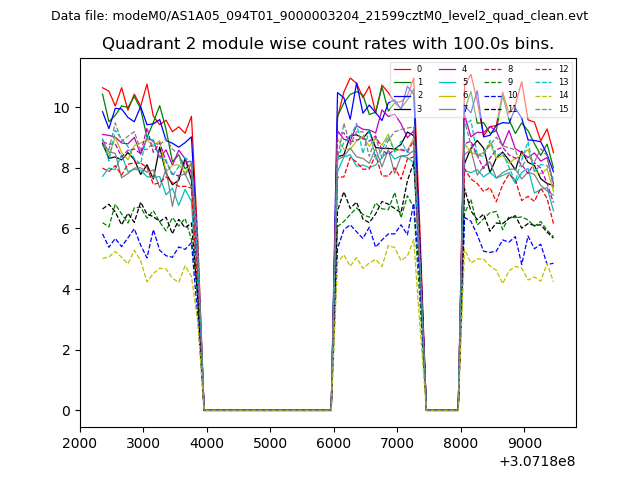
| Module-wise count rates for Quadrant A Data is divided into 100 sec bins |
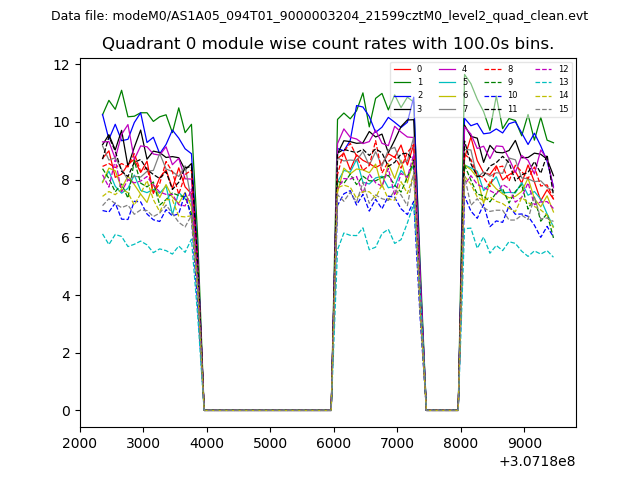 |
 |
| Module-wise count rates for Quadrant B Data is divided into 100 sec bins |
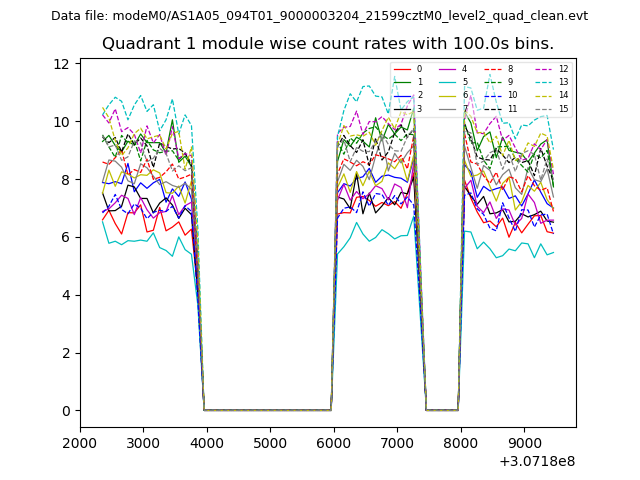 |
 |
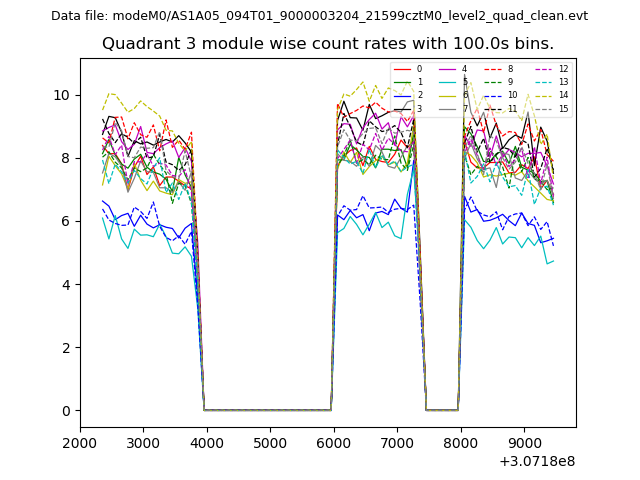
| Module-wise count rates for Quadrant C Data is divided into 100 sec bins |
 |
 |
| Module-wise count rates for Quadrant D Data is divided into 100 sec bins |
 |
 |
| Parameter | Plot |
|---|---|
| CZT HV Monitor |  |
| D_VDD |  |
| Temperature 1 | 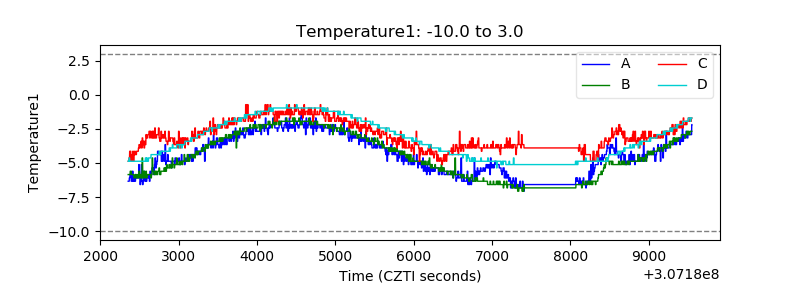 |
| Veto HV Monitor | 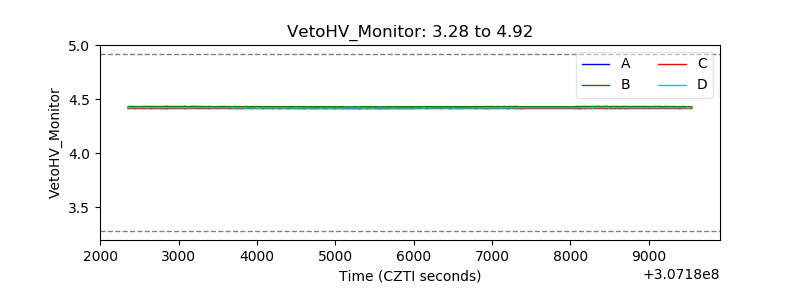 |
| Veto LLD | 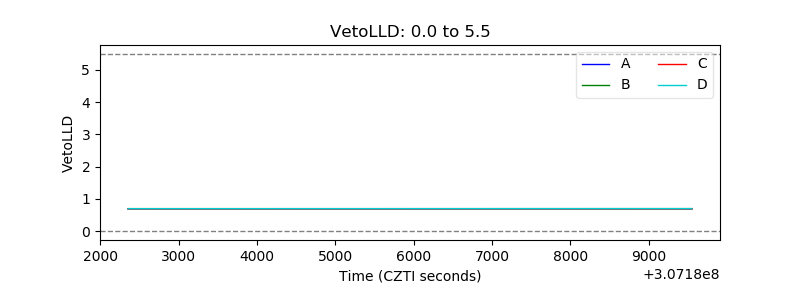 |
| Alpha Counter | 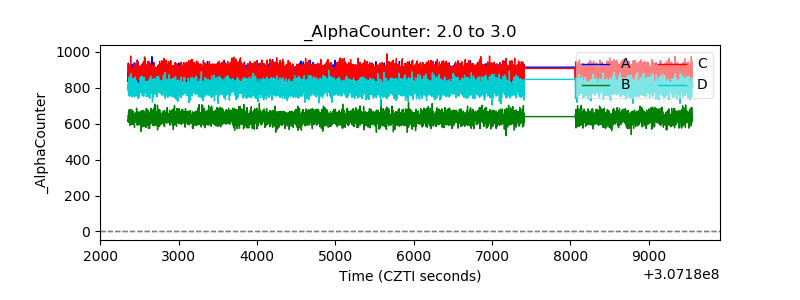 |
| _CPM_Rate | 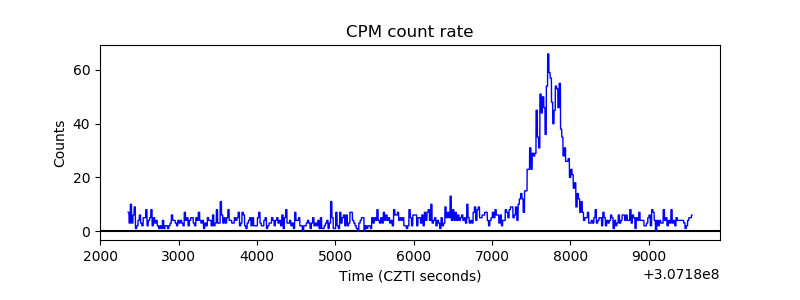 |
| CZT Counter | 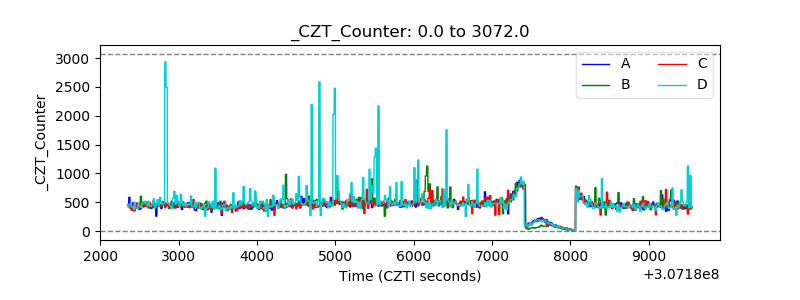 |
| +2.5 Volts monitor |  |
| +5 Volts monitor |  |
| _ROLL_ROT | 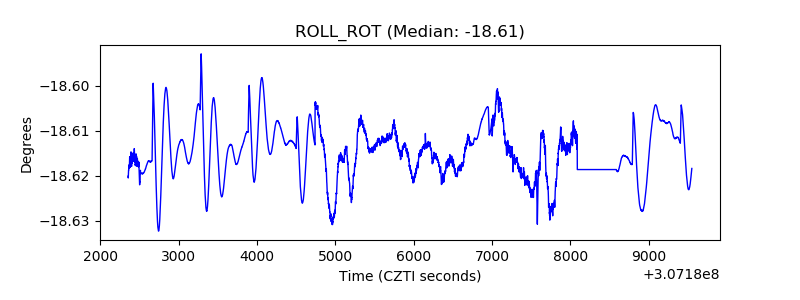 |
| _Roll_DEC | 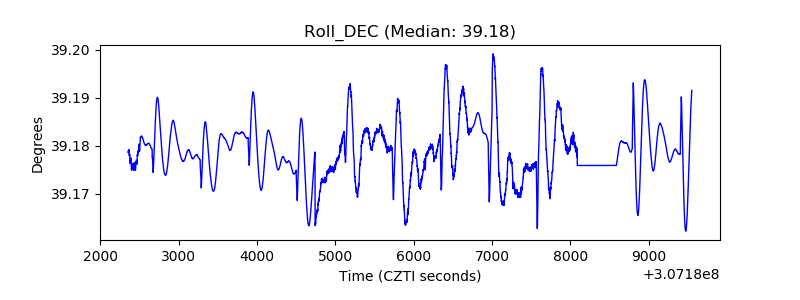 |
| _Roll_RA | 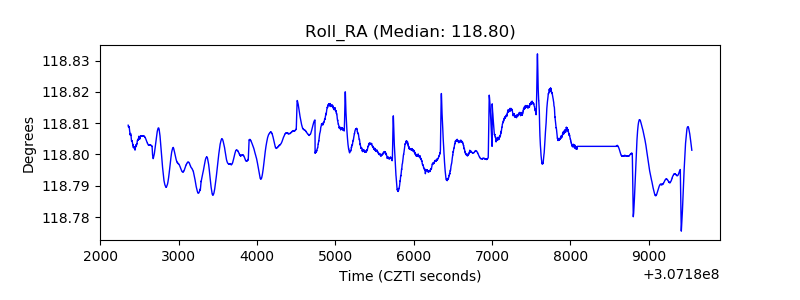 |
| Veto Counter | 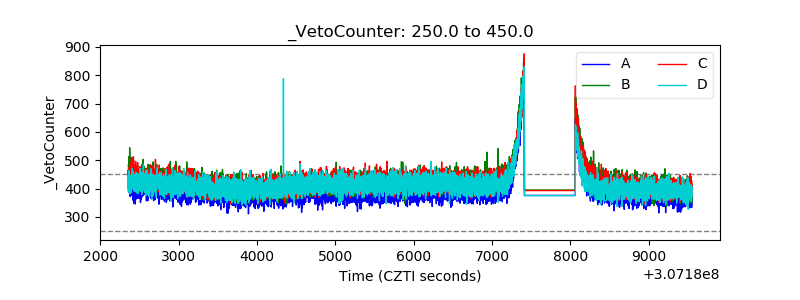 |