| Param | Original file | Final file |
|---|---|---|
| Filename | modeM0/AS1A05_094T01_9000003204_21600cztM0_level2.evt | modeM0/AS1A05_094T01_9000003204_21600cztM0_level2_quad_clean.evt |
| Size (bytes) | 472,855,680 | 94,576,320 |
| Size | 451.0 MB | 90.2 MB |
| Events in quadrant A | 3,288,087 | 603,710 |
| Events in quadrant B | 3,492,188 | 610,678 |
| Events in quadrant C | 3,307,525 | 591,521 |
| Events in quadrant D | 3,755,988 | 569,549 |
| Mode M0 | |||
|---|---|---|---|
| Quadrant | BADHDUFLAG | Total packets | Discarded packets |
| A | 0 | 14394 | 1 |
| B | 0 | 14855 | 1 |
| C | 0 | 14395 | 1 |
| D | 0 | 15944 | 2 |
| Mode M9 | |||
|---|---|---|---|
| Quadrant | BADHDUFLAG | Total packets | Discarded packets |
| A | 0 | 2 | 0 |
| B | 0 | 2 | 0 |
| C | 0 | 2 | 0 |
| D | 0 | 2 | 0 |
| Mode SS | |||
|---|---|---|---|
| Quadrant | BADHDUFLAG | Total packets | Discarded packets |
| A | 0 | 144 | 0 |
| B | 0 | 144 | 0 |
| C | 0 | 144 | 0 |
| D | 0 | 144 | 0 |
| Quadrant | Total seconds | Saturated seconds | Saturation percentage |
|---|---|---|---|
| A | 7011 | 179 | 2.553131% |
| B | 7012 | 215 | 3.066172% |
| C | 7012 | 211 | 3.009127% |
| D | 7011 | 272 | 3.879618% |
Noise dominated data is calculated using 1-second bins in cleaned event files. If a bin has >2000 counts, and if more than 50% of those come from <1% of pixels, then it is considered to be noise-dominated and hence unusable.
| Quadrant | # 1 sec bins | Bins with >0 counts | Bins with >2000 counts | High rate bins dominated by noise | Noise dominated (total time) | Noise dominated (detector-on time) | Marked lightcurve |
|---|---|---|---|---|---|---|---|
| A | 7171 | 7013 | 0 | 0 | 0.00% | 0.00% | 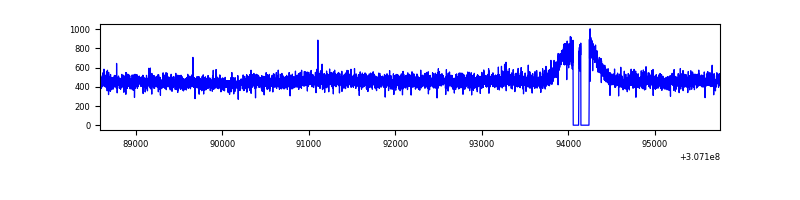 |
| B | 7171 | 7013 | 12 | 12 | 0.17% | 0.17% | 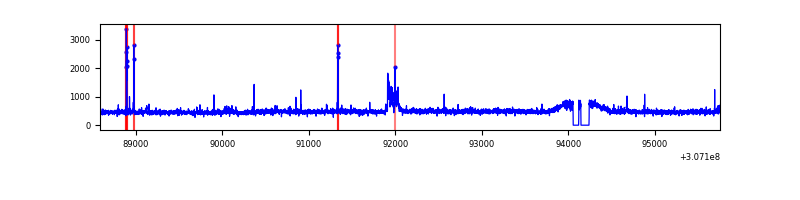 |
| C | 7171 | 7013 | 0 | 0 | 0.00% | 0.00% |  |
| D | 7170 | 7011 | 85 | 85 | 1.19% | 1.21% | 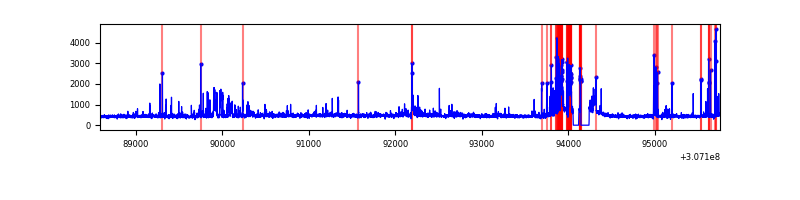 |
Top three noisy pixels from each quadrant. If the there are fewer than three noisy pixels in the level2.evt file, extra rows are filled as -1
| Pixel properties | Quadrant properties | ||||||
|---|---|---|---|---|---|---|---|
| Quadrant | DetID | PixID | Counts | Sigma | Mean | Median | Sigma |
| A | 13 | 254 | 8729 | 45.7 | 852 | 833 | 172.8 |
| A | 0 | 226 | 7545 | 38.85 | 852 | 833 | 172.8 |
| A | 3 | 137 | 7321 | 37.55 | 852 | 833 | 172.8 |
| B | 0 | 228 | 82039 | 499.31 | 846 | 825 | 162.7 |
| B | 3 | 64 | 52847 | 319.83 | 846 | 825 | 162.7 |
| B | 12 | 111 | 19733 | 116.25 | 846 | 825 | 162.7 |
| C | 14 | 238 | 127987 | 664.22 | 815 | 819 | 191.5 |
| C | 13 | 61 | 5617 | 25.06 | 815 | 819 | 191.5 |
| C | 4 | 175 | 2328 | 7.88 | 815 | 819 | 191.5 |
| D | 1 | 52 | 484185 | 2424.52 | 816 | 790 | 199.4 |
| D | 2 | 136 | 113250 | 564.05 | 816 | 790 | 199.4 |
| D | 14 | 35 | 40461 | 198.97 | 816 | 790 | 199.4 |
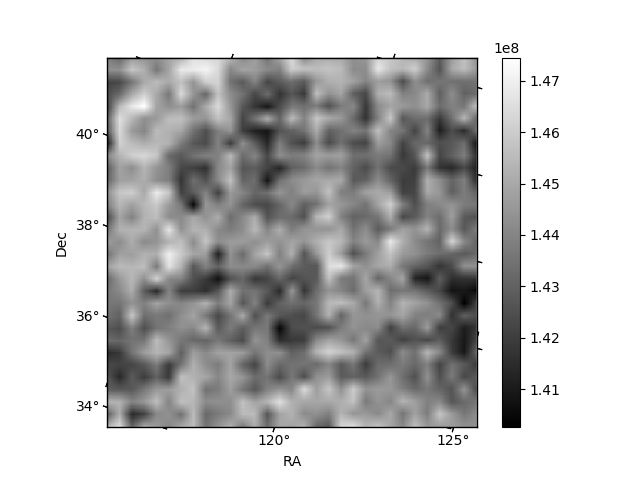
Histogram calculated using DETX and DETY for each event in the final _common_clean file
| Quadrant A |  |
 |
Quadrant B |
|---|---|---|---|
| Quadrant D |  |
 |
Quadrant C |
| Plot type | Count rate plots | Images |
|---|---|---|
| Comparison with Poisson distribution Blue bars denote a histogram of data divided into 1 sec bins. Red curve is a Poisson curve with rate = median count rate of data. |
 |
 |
| Quadrant-wise count rates Data is divided into 100 sec bins |
 |
|
| Module-wise count rates for Quadrant A Data is divided into 100 sec bins |
 |
 |
| Module-wise count rates for Quadrant B Data is divided into 100 sec bins |
 |
 |
| Module-wise count rates for Quadrant C Data is divided into 100 sec bins |
 |
 |
| Module-wise count rates for Quadrant D Data is divided into 100 sec bins |
 |
 |
| Parameter | Plot |
|---|---|
| CZT HV Monitor |  |
| D_VDD |  |
| Temperature 1 |  |
| Veto HV Monitor |  |
| Veto LLD |  |
| Alpha Counter |  |
| _CPM_Rate |  |
| CZT Counter |  |
| +2.5 Volts monitor |  |
| +5 Volts monitor |  |
| _ROLL_ROT |  |
| _Roll_DEC |  |
| _Roll_RA |  |
| Veto Counter |  |