| Param | Original file | Final file |
|---|---|---|
| Filename | modeM0/AS1A05_094T01_9000003204_21601cztM0_level2.evt | modeM0/AS1A05_094T01_9000003204_21601cztM0_level2_quad_clean.evt |
| Size (bytes) | 540,535,680 | 89,320,320 |
| Size | 515.5 MB | 85.2 MB |
| Events in quadrant A | 3,439,464 | 562,065 |
| Events in quadrant B | 3,552,504 | 569,652 |
| Events in quadrant C | 3,454,270 | 548,972 |
| Events in quadrant D | 5,425,298 | 512,504 |
| Mode M0 | |||
|---|---|---|---|
| Quadrant | BADHDUFLAG | Total packets | Discarded packets |
| A | 0 | 15014 | 1 |
| B | 0 | 15187 | 1 |
| C | 0 | 15023 | 1 |
| D | 0 | 21076 | 1 |
| Mode M9 | |||
|---|---|---|---|
| Quadrant | BADHDUFLAG | Total packets | Discarded packets |
| A | 0 | 1 | 0 |
| B | 0 | 1 | 0 |
| C | 0 | 1 | 0 |
| D | 0 | 1 | 0 |
| Mode SS | |||
|---|---|---|---|
| Quadrant | BADHDUFLAG | Total packets | Discarded packets |
| A | 0 | 150 | 0 |
| B | 0 | 150 | 0 |
| C | 0 | 150 | 0 |
| D | 0 | 150 | 0 |
| Quadrant | Total seconds | Saturated seconds | Saturation percentage |
|---|---|---|---|
| A | 7338 | 145 | 1.976015% |
| B | 7339 | 169 | 2.302766% |
| C | 7339 | 187 | 2.548031% |
| D | 7339 | 602 | 8.202752% |
Noise dominated data is calculated using 1-second bins in cleaned event files. If a bin has >2000 counts, and if more than 50% of those come from <1% of pixels, then it is considered to be noise-dominated and hence unusable.
| Quadrant | # 1 sec bins | Bins with >0 counts | Bins with >2000 counts | High rate bins dominated by noise | Noise dominated (total time) | Noise dominated (detector-on time) | Marked lightcurve |
|---|---|---|---|---|---|---|---|
| A | 7488 | 7339 | 0 | 0 | 0.00% | 0.00% |  |
| B | 7489 | 7340 | 0 | 0 | 0.00% | 0.00% |  |
| C | 7489 | 7340 | 0 | 0 | 0.00% | 0.00% |  |
| D | 7489 | 7340 | 363 | 363 | 4.85% | 4.95% | 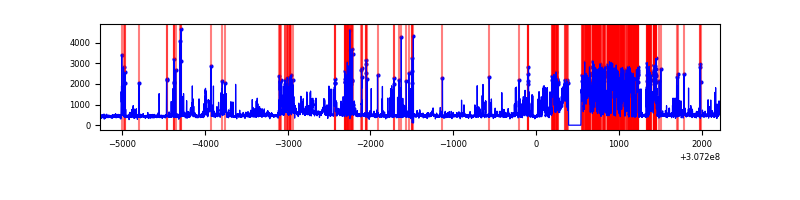 |
Top three noisy pixels from each quadrant. If the there are fewer than three noisy pixels in the level2.evt file, extra rows are filled as -1
| Pixel properties | Quadrant properties | ||||||
|---|---|---|---|---|---|---|---|
| Quadrant | DetID | PixID | Counts | Sigma | Mean | Median | Sigma |
| A | 13 | 254 | 9891 | 49.98 | 892 | 871 | 180.5 |
| A | 3 | 137 | 7749 | 38.11 | 892 | 871 | 180.5 |
| A | 0 | 226 | 7613 | 37.36 | 892 | 871 | 180.5 |
| B | 0 | 190 | 32981 | 188.72 | 885 | 861 | 170.2 |
| B | 12 | 111 | 20978 | 118.2 | 885 | 861 | 170.2 |
| B | 0 | 230 | 20853 | 117.46 | 885 | 861 | 170.2 |
| C | 14 | 238 | 132053 | 655.39 | 851 | 854 | 200.2 |
| C | 13 | 61 | 6142 | 26.42 | 851 | 854 | 200.2 |
| C | 8 | 128 | 2594 | 8.69 | 851 | 854 | 200.2 |
| D | 1 | 52 | 1734400 | 8386.48 | 840 | 813 | 206.7 |
| D | 2 | 136 | 152271 | 732.7 | 840 | 813 | 206.7 |
| D | 13 | 174 | 145806 | 701.42 | 840 | 813 | 206.7 |
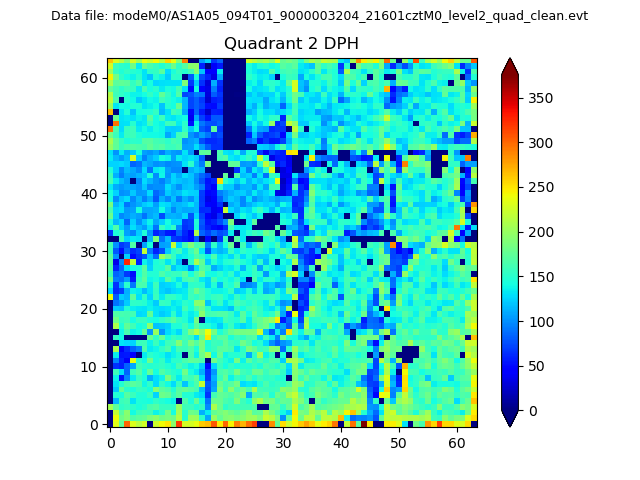
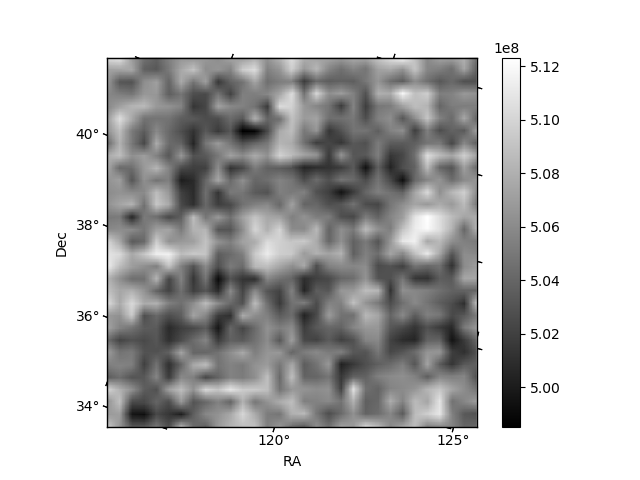
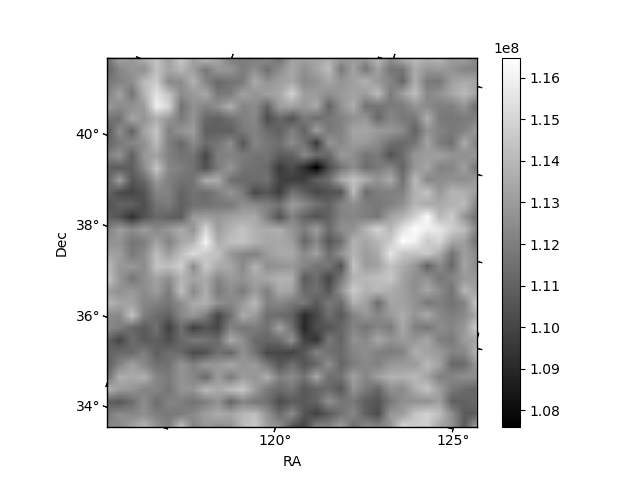
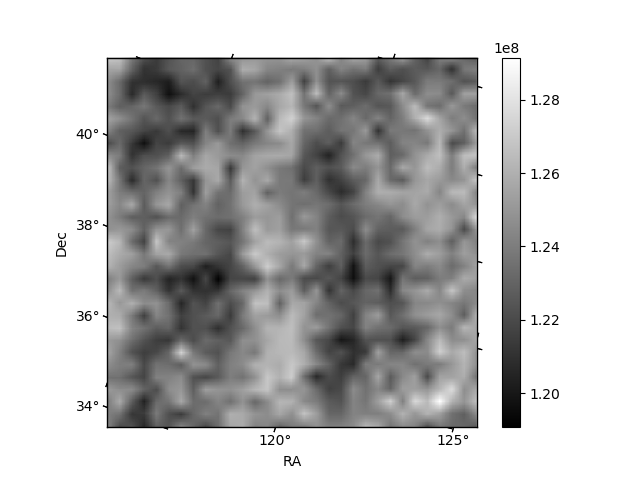
Histogram calculated using DETX and DETY for each event in the final _common_clean file
| Quadrant A | 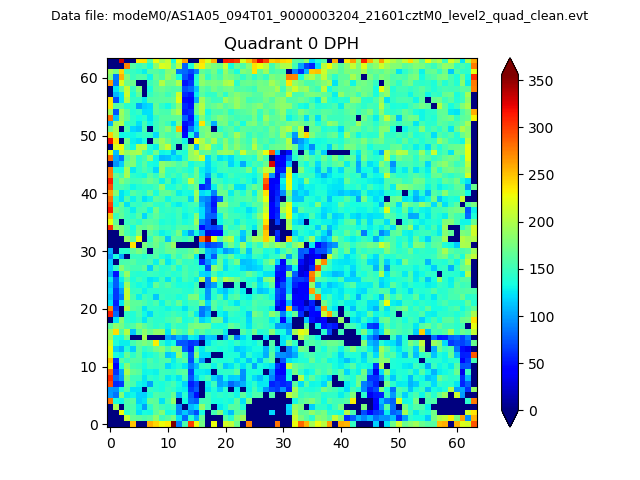 |
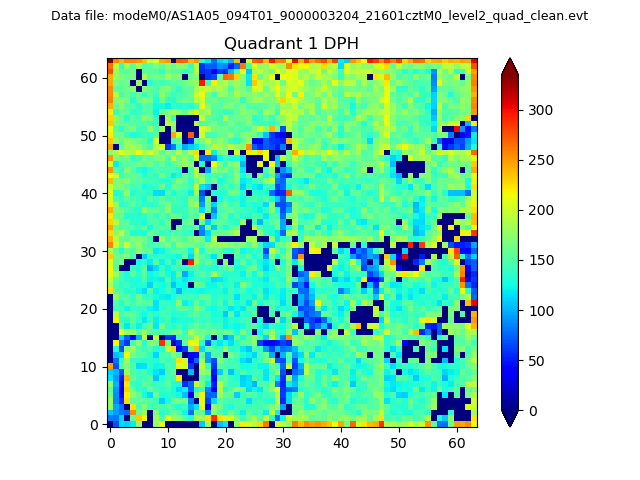 |
Quadrant B |
|---|---|---|---|
| Quadrant D | 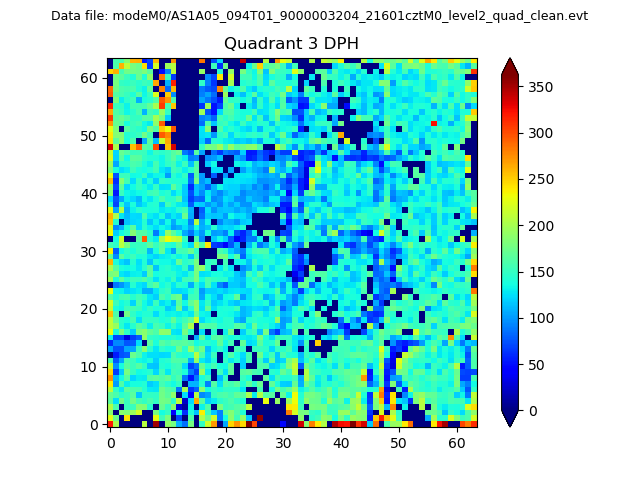 |
 |
Quadrant C |
| Plot type | Count rate plots | Images |
|---|---|---|
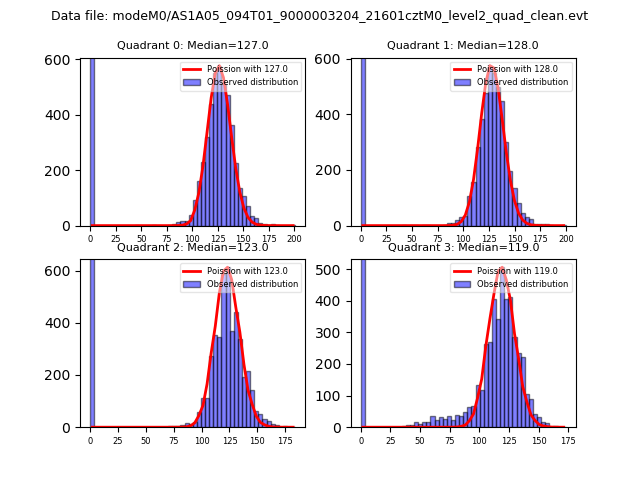
| Comparison with Poisson distribution Blue bars denote a histogram of data divided into 1 sec bins. Red curve is a Poisson curve with rate = median count rate of data. |
 |
 |
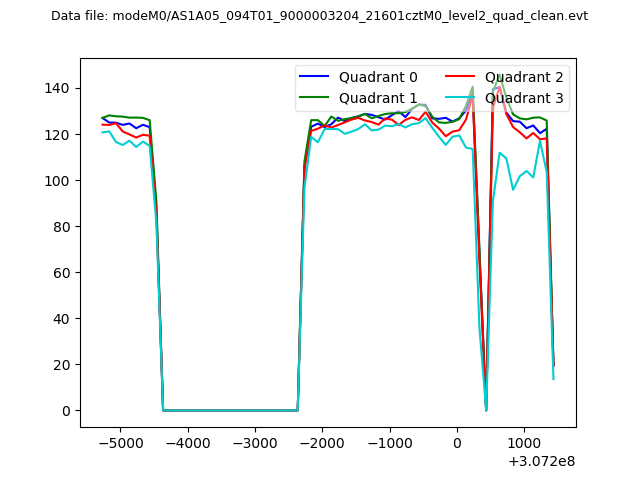
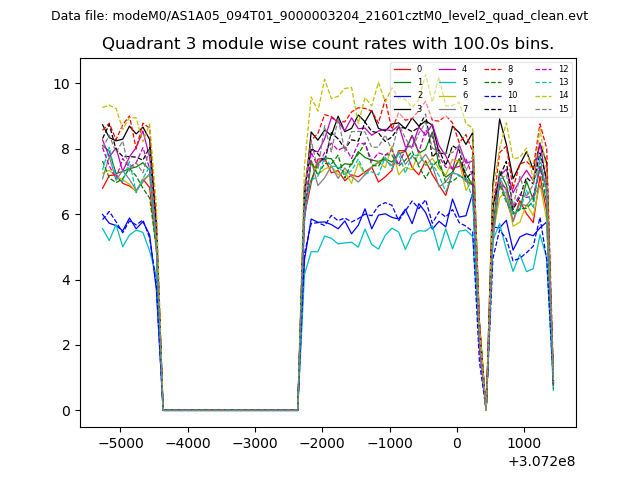
| Quadrant-wise count rates Data is divided into 100 sec bins |
 |
|
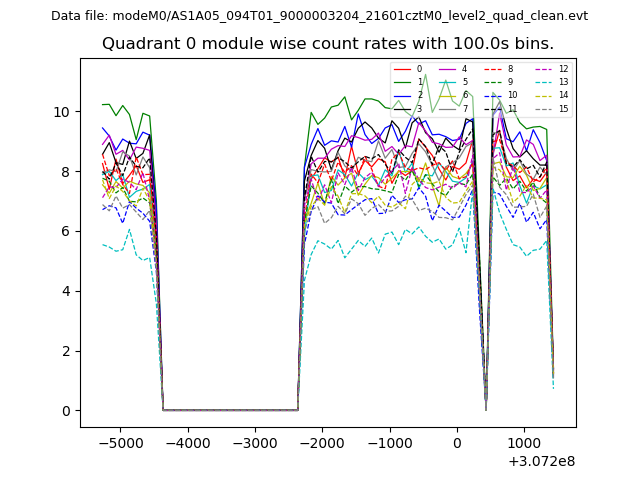
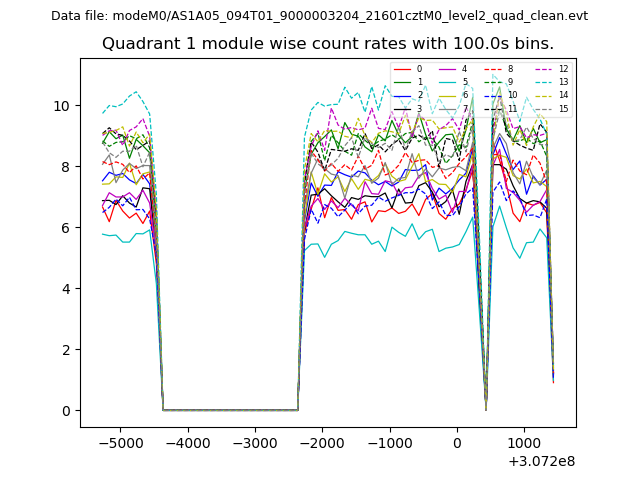
| Module-wise count rates for Quadrant A Data is divided into 100 sec bins |
 |
 |
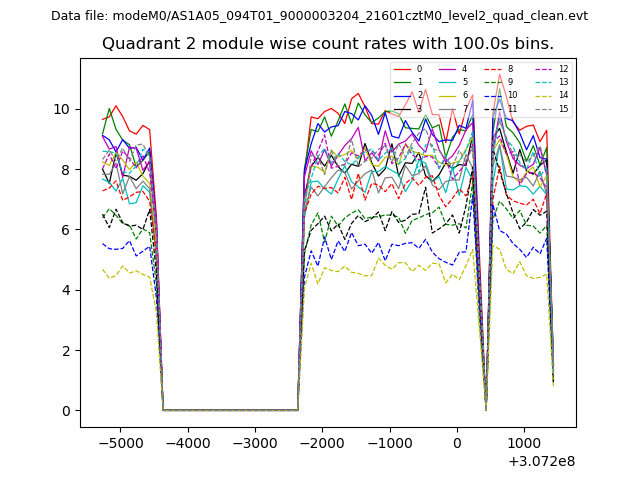
| Module-wise count rates for Quadrant B Data is divided into 100 sec bins |
 |
 |
| Module-wise count rates for Quadrant C Data is divided into 100 sec bins |
 |
 |
| Module-wise count rates for Quadrant D Data is divided into 100 sec bins |
 |
 |
| Parameter | Plot |
|---|---|
| CZT HV Monitor | 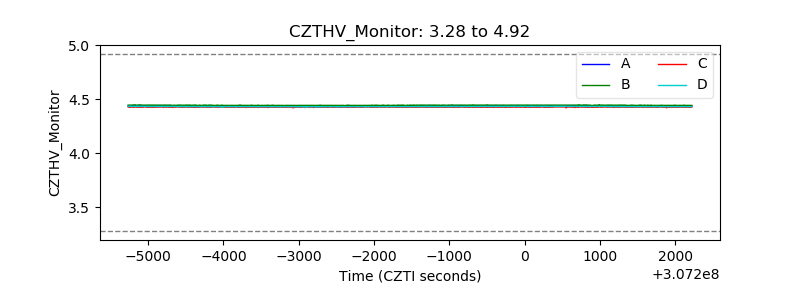 |
| D_VDD | 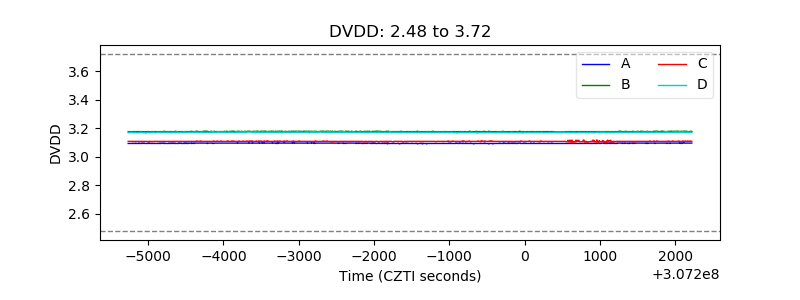 |
| Temperature 1 | 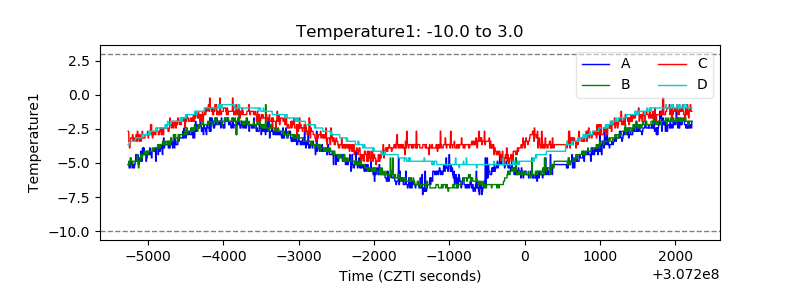 |
| Veto HV Monitor |  |
| Veto LLD | 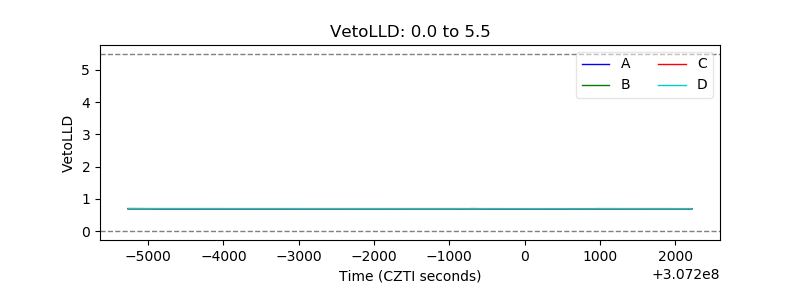 |
| Alpha Counter | 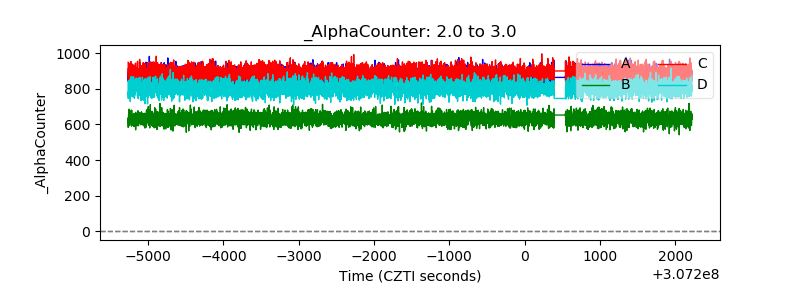 |
| _CPM_Rate | 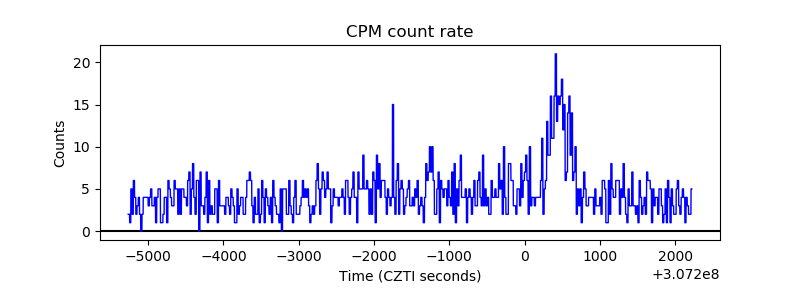 |
| CZT Counter | 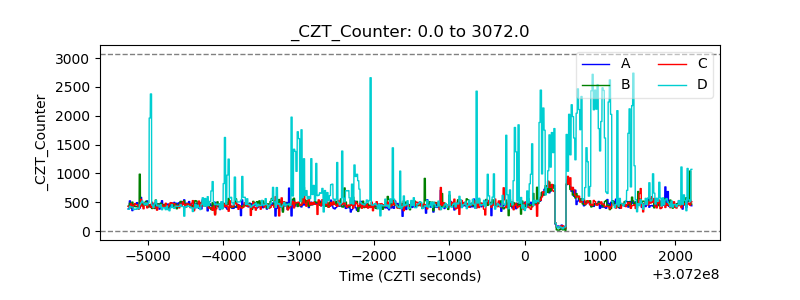 |
| +2.5 Volts monitor |  |
| +5 Volts monitor | 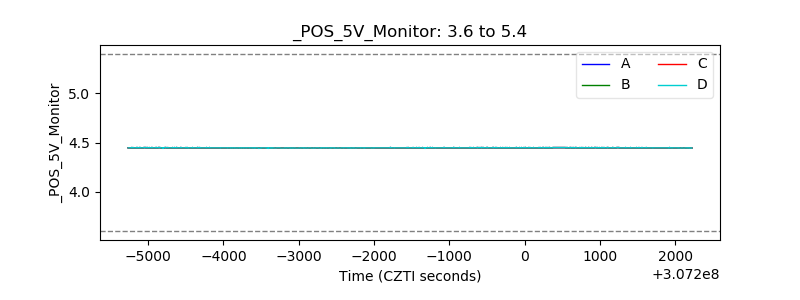 |
| _ROLL_ROT | 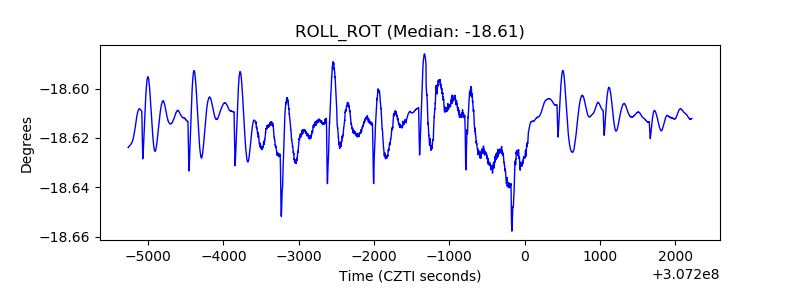 |
| _Roll_DEC | 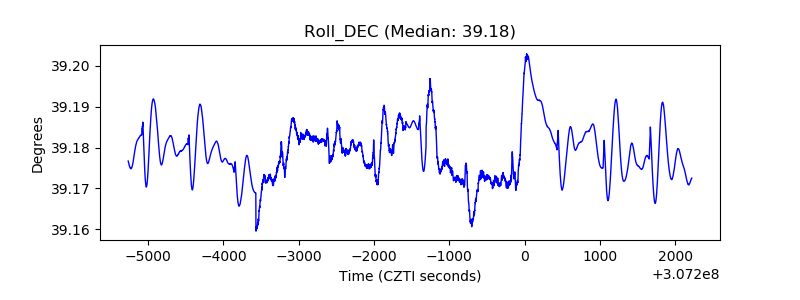 |
| _Roll_RA | 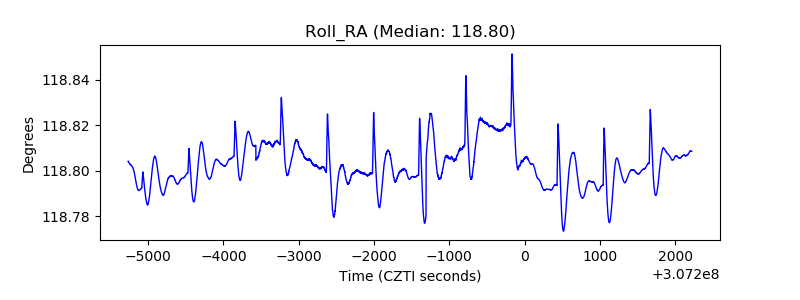 |
| Veto Counter | 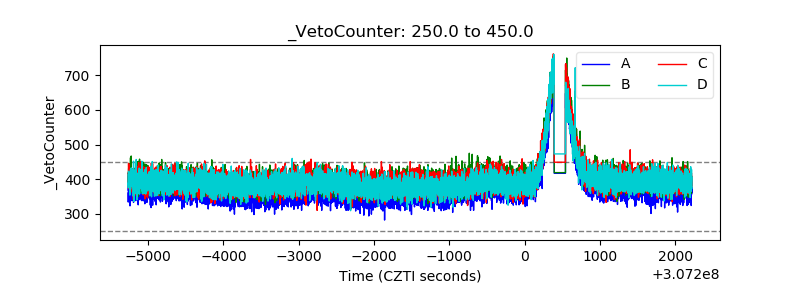 |