| Param | Original file | Final file |
|---|---|---|
| Filename | modeM0/AS1A05_094T01_9000003204_21602cztM0_level2.evt | modeM0/AS1A05_094T01_9000003204_21602cztM0_level2_quad_clean.evt |
| Size (bytes) | 561,859,200 | 80,827,200 |
| Size | 535.8 MB | 77.1 MB |
| Events in quadrant A | 3,379,781 | 497,116 |
| Events in quadrant B | 3,560,974 | 500,185 |
| Events in quadrant C | 3,397,982 | 483,993 |
| Events in quadrant D | 6,183,644 | 459,488 |
| Mode M0 | |||
|---|---|---|---|
| Quadrant | BADHDUFLAG | Total packets | Discarded packets |
| A | 0 | 14748 | 1 |
| B | 0 | 15101 | 1 |
| C | 0 | 14728 | 1 |
| D | 0 | 23293 | 1 |
| Mode M9 | |||
|---|---|---|---|
| Quadrant | BADHDUFLAG | Total packets | Discarded packets |
| A | 0 | 4 | 0 |
| B | 0 | 4 | 0 |
| C | 0 | 4 | 0 |
| D | 0 | 4 | 0 |
| Mode SS | |||
|---|---|---|---|
| Quadrant | BADHDUFLAG | Total packets | Discarded packets |
| A | 0 | 148 | 0 |
| B | 0 | 148 | 0 |
| C | 0 | 148 | 0 |
| D | 0 | 148 | 0 |
| Quadrant | Total seconds | Saturated seconds | Saturation percentage |
|---|---|---|---|
| A | 7274 | 56 | 0.769865% |
| B | 7275 | 71 | 0.975945% |
| C | 7275 | 101 | 1.388316% |
| D | 7275 | 682 | 9.374570% |
Noise dominated data is calculated using 1-second bins in cleaned event files. If a bin has >2000 counts, and if more than 50% of those come from <1% of pixels, then it is considered to be noise-dominated and hence unusable.
| Quadrant | # 1 sec bins | Bins with >0 counts | Bins with >2000 counts | High rate bins dominated by noise | Noise dominated (total time) | Noise dominated (detector-on time) | Marked lightcurve |
|---|---|---|---|---|---|---|---|
| A | 7694 | 7275 | 0 | 0 | 0.00% | 0.00% | 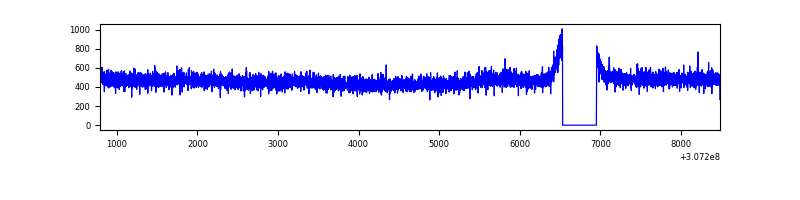 |
| B | 7695 | 7276 | 2 | 2 | 0.03% | 0.03% | 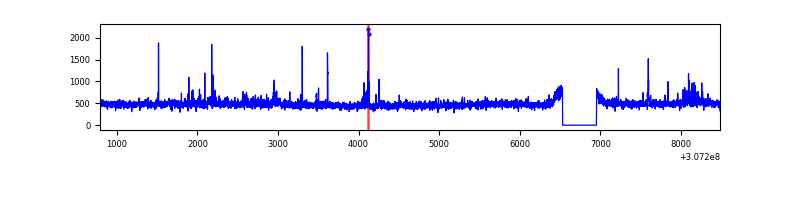 |
| C | 7695 | 7276 | 0 | 0 | 0.00% | 0.00% | 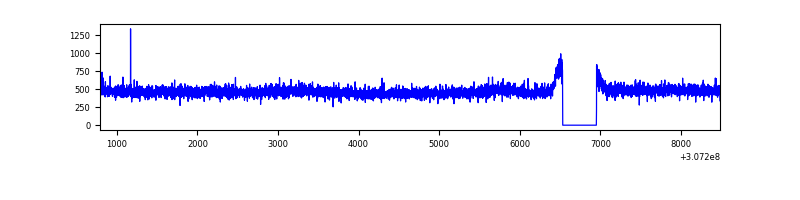 |
| D | 7695 | 7276 | 558 | 558 | 7.25% | 7.67% | 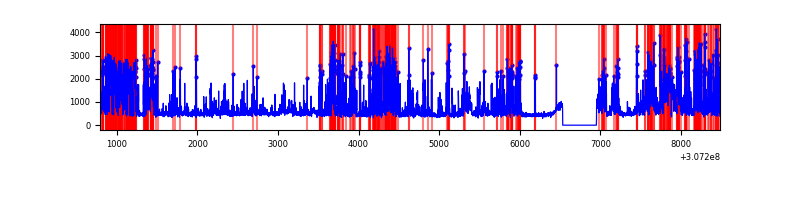 |
Top three noisy pixels from each quadrant. If the there are fewer than three noisy pixels in the level2.evt file, extra rows are filled as -1
| Pixel properties | Quadrant properties | ||||||
|---|---|---|---|---|---|---|---|
| Quadrant | DetID | PixID | Counts | Sigma | Mean | Median | Sigma |
| A | 13 | 254 | 10074 | 51.82 | 877 | 858 | 177.9 |
| A | 3 | 137 | 7698 | 38.46 | 877 | 858 | 177.9 |
| A | 0 | 226 | 7640 | 38.13 | 877 | 858 | 177.9 |
| B | 0 | 190 | 61462 | 363.53 | 867 | 845 | 166.7 |
| B | 0 | 229 | 30302 | 176.66 | 867 | 845 | 166.7 |
| B | 0 | 197 | 29272 | 170.48 | 867 | 845 | 166.7 |
| C | 14 | 238 | 132131 | 664.35 | 836 | 839 | 197.6 |
| C | 13 | 61 | 5899 | 25.6 | 836 | 839 | 197.6 |
| C | 10 | 91 | 3431 | 13.12 | 836 | 839 | 197.6 |
| D | 1 | 52 | 2729672 | 13496.83 | 830 | 803 | 202.2 |
| D | 2 | 136 | 116979 | 574.6 | 830 | 803 | 202.2 |
| D | 7 | 38 | 76275 | 373.28 | 830 | 803 | 202.2 |
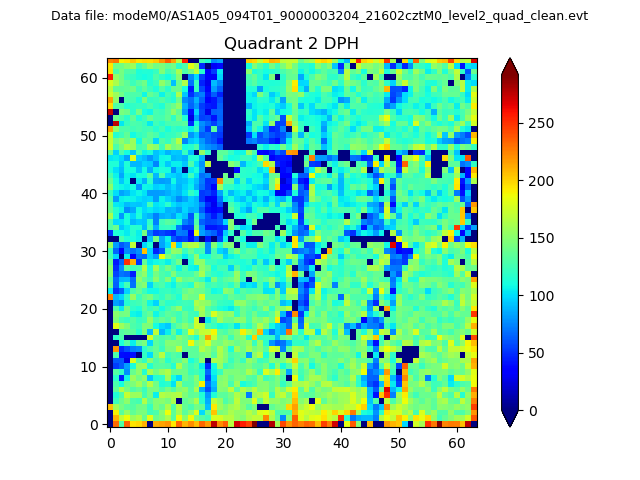
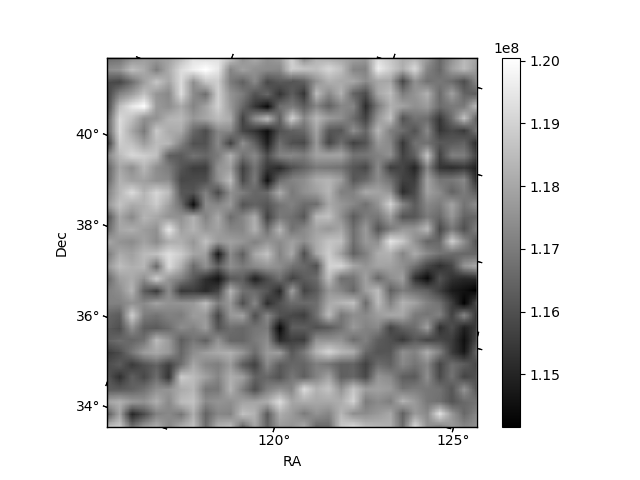
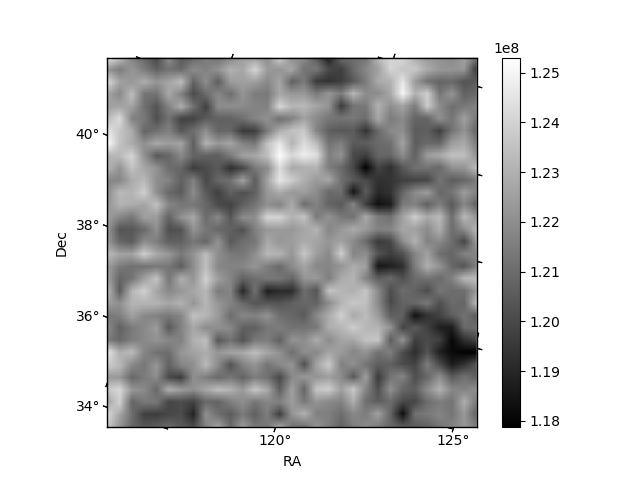
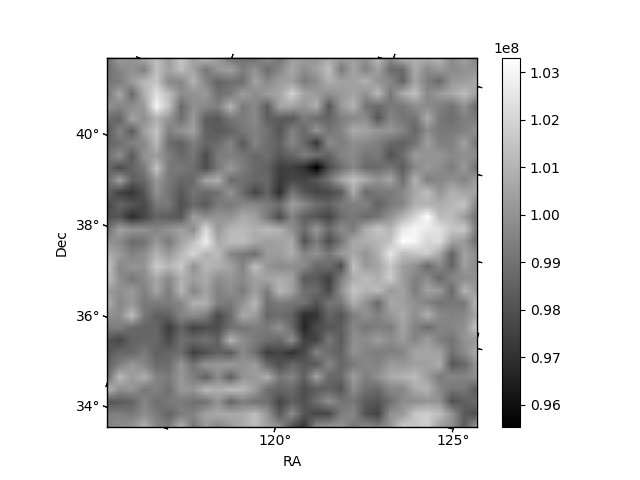
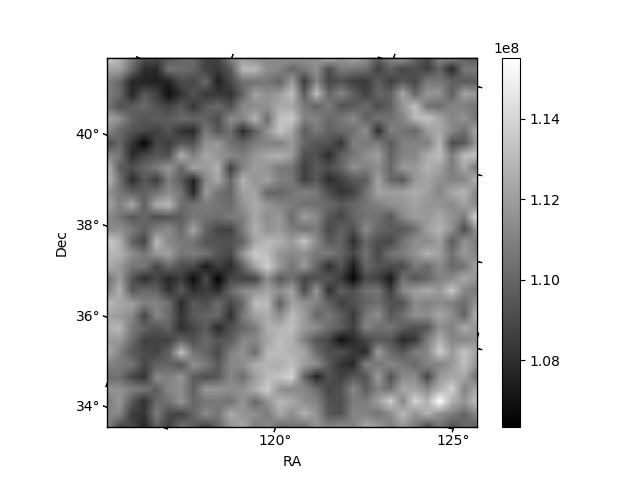
Histogram calculated using DETX and DETY for each event in the final _common_clean file
| Quadrant A | 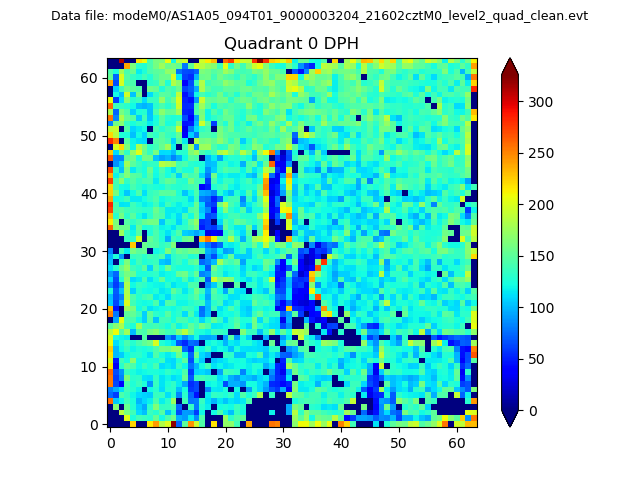 |
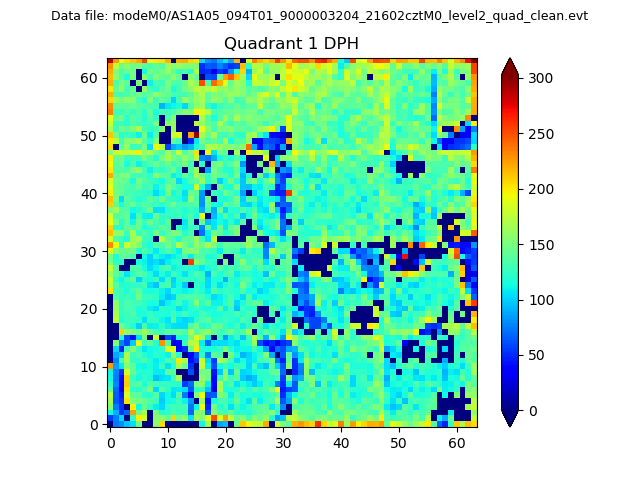 |
Quadrant B |
|---|---|---|---|
| Quadrant D | 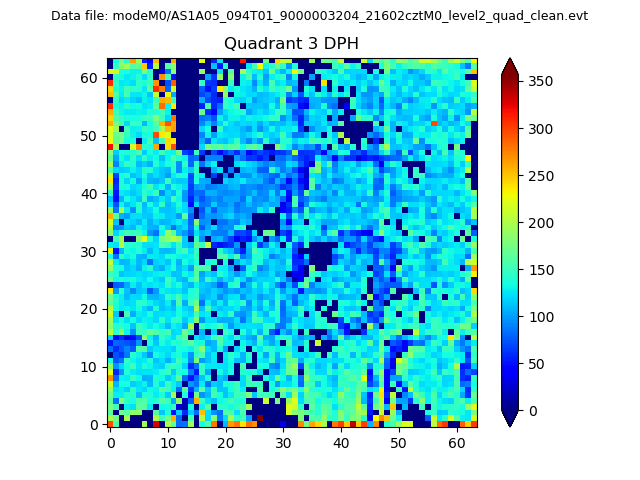 |
 |
Quadrant C |
| Plot type | Count rate plots | Images |
|---|---|---|
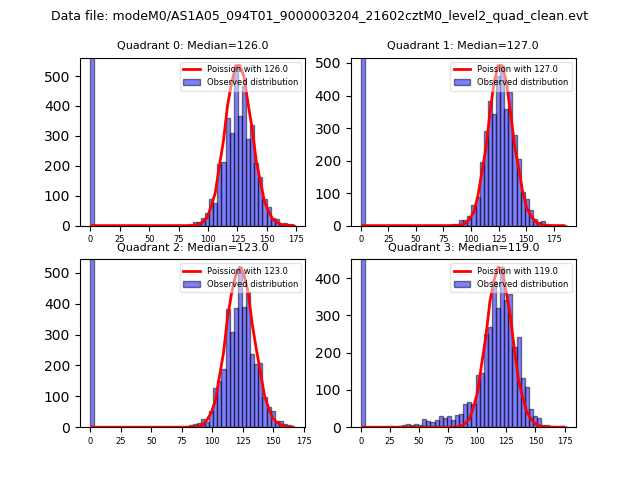
| Comparison with Poisson distribution Blue bars denote a histogram of data divided into 1 sec bins. Red curve is a Poisson curve with rate = median count rate of data. |
 |
 |
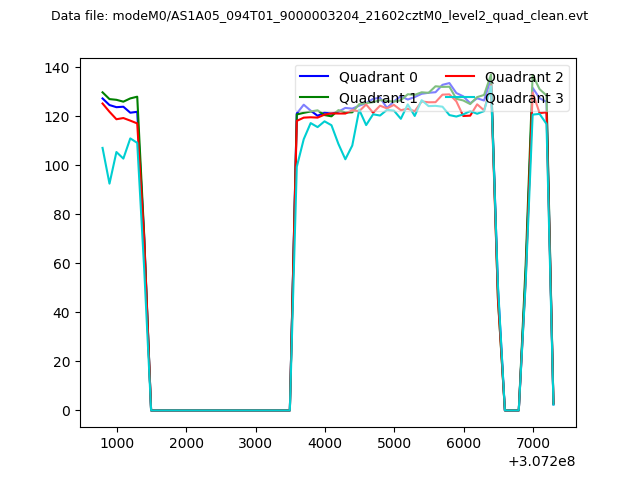
| Quadrant-wise count rates Data is divided into 100 sec bins |
 |
|
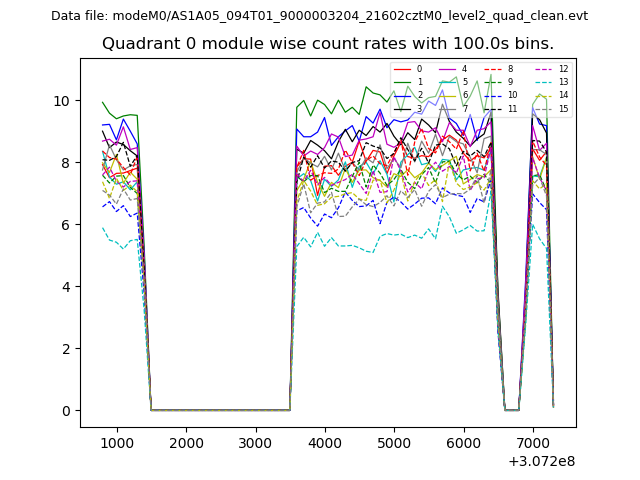
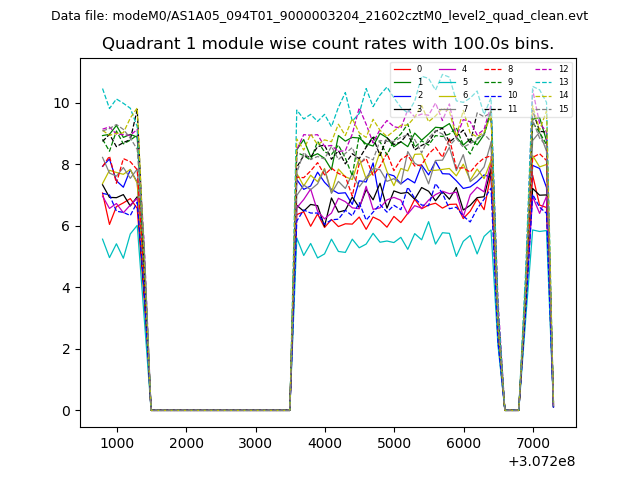
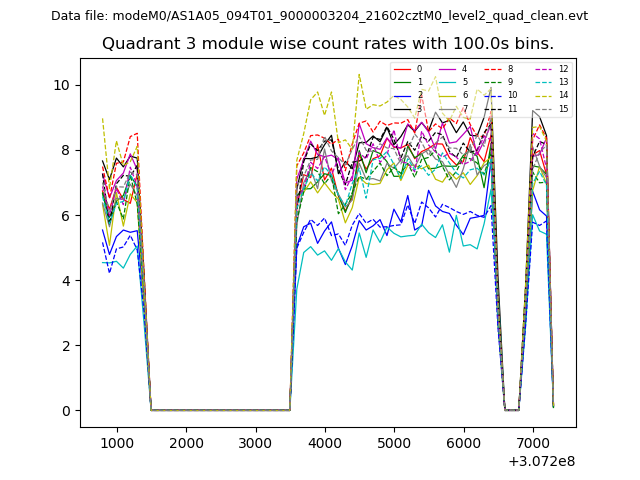
| Module-wise count rates for Quadrant A Data is divided into 100 sec bins |
 |
 |
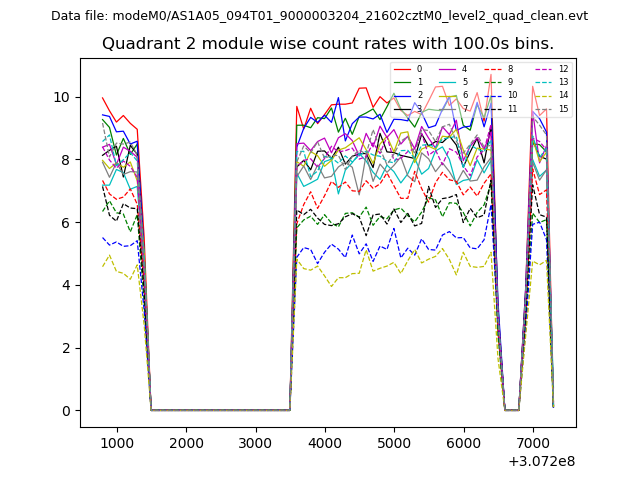
| Module-wise count rates for Quadrant B Data is divided into 100 sec bins |
 |
 |
| Module-wise count rates for Quadrant C Data is divided into 100 sec bins |
 |
 |
| Module-wise count rates for Quadrant D Data is divided into 100 sec bins |
 |
 |
| Parameter | Plot |
|---|---|
| CZT HV Monitor | 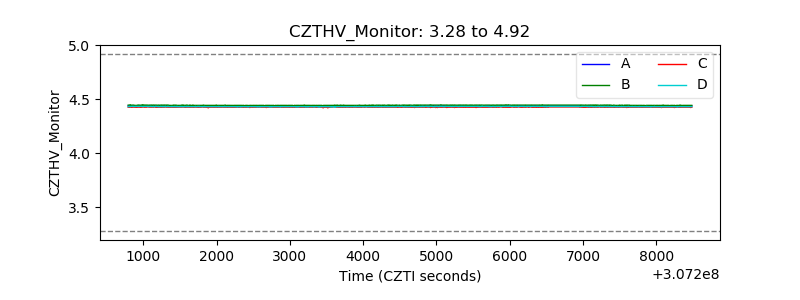 |
| D_VDD | 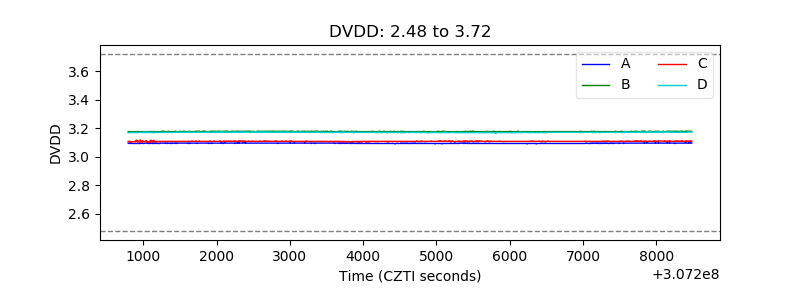 |
| Temperature 1 | 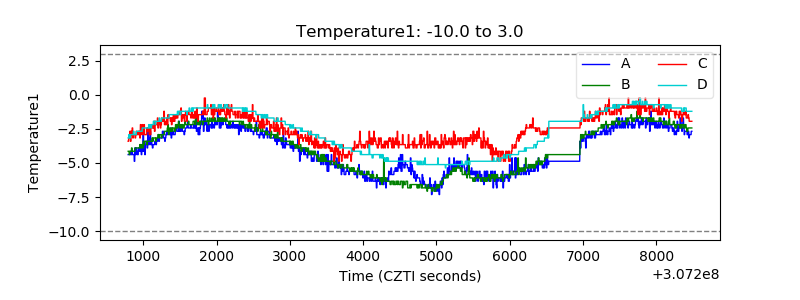 |
| Veto HV Monitor | 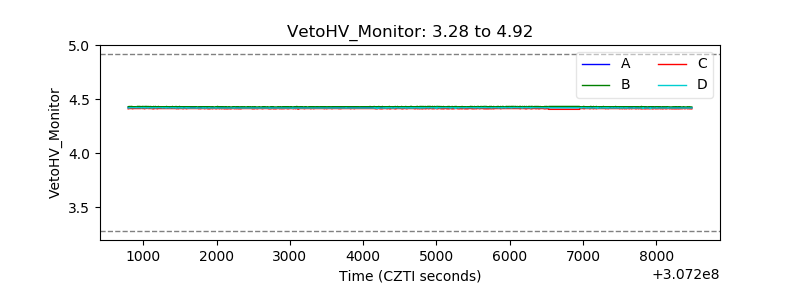 |
| Veto LLD | 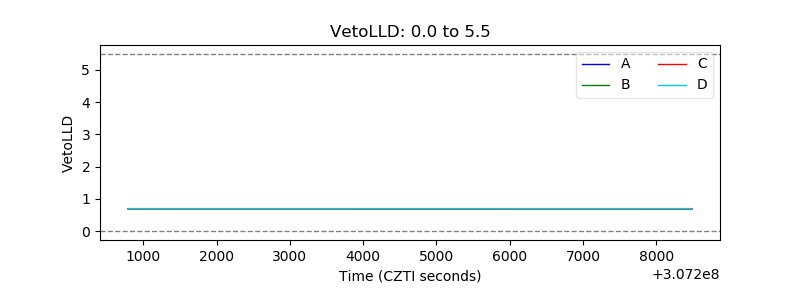 |
| Alpha Counter | 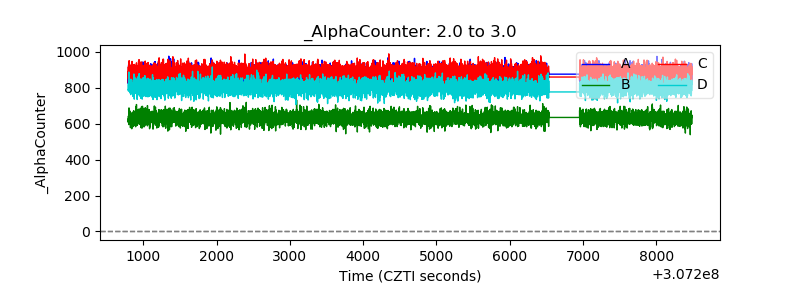 |
| _CPM_Rate | 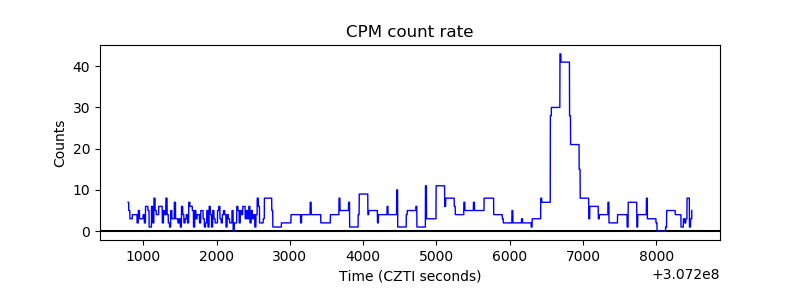 |
| CZT Counter | 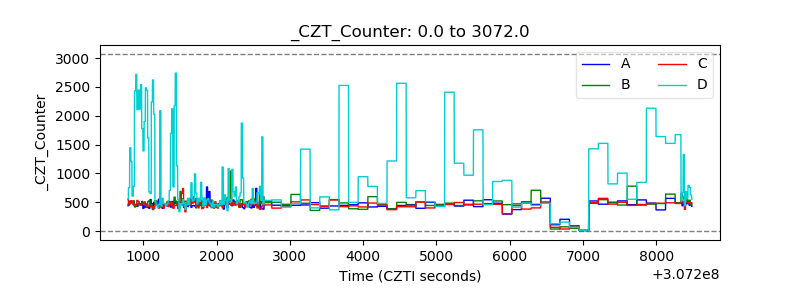 |
| +2.5 Volts monitor |  |
| +5 Volts monitor |  |
| _ROLL_ROT | 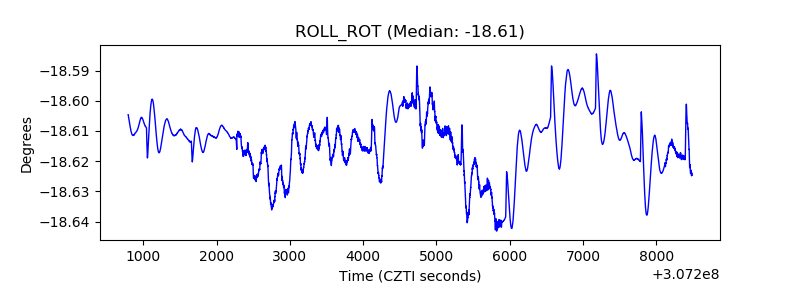 |
| _Roll_DEC | 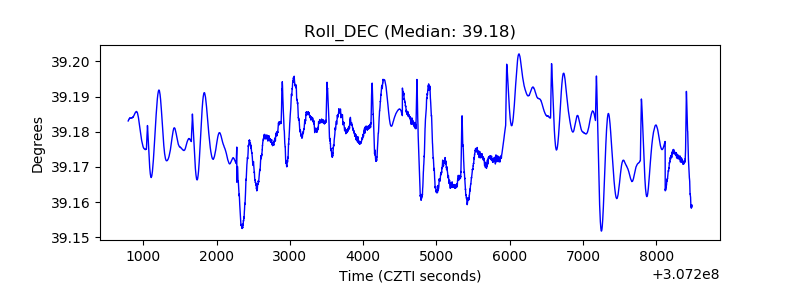 |
| _Roll_RA | 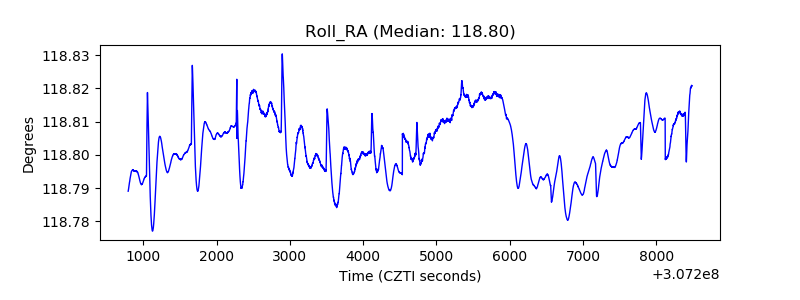 |
| Veto Counter | 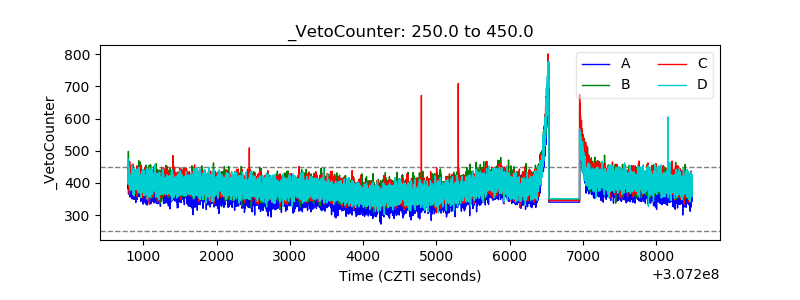 |