| Param | Original file | Final file |
|---|---|---|
| Filename | modeM0/AS1A05_094T01_9000003204_21604cztM0_level2.evt | modeM0/AS1A05_094T01_9000003204_21604cztM0_level2_quad_clean.evt |
| Size (bytes) | 1,048,645,440 | 142,551,360 |
| Size | 1000.1 MB | 135.9 MB |
| Events in quadrant A | 5,941,407 | 884,643 |
| Events in quadrant B | 6,248,266 | 886,988 |
| Events in quadrant C | 6,006,678 | 866,734 |
| Events in quadrant D | 12,704,121 | 800,561 |
| Mode M0 | |||
|---|---|---|---|
| Quadrant | BADHDUFLAG | Total packets | Discarded packets |
| A | 0 | 25930 | 5 |
| B | 0 | 26567 | 3 |
| C | 0 | 25912 | 3 |
| D | 0 | 46721 | 3 |
| Mode M9 | |||
|---|---|---|---|
| Quadrant | BADHDUFLAG | Total packets | Discarded packets |
| A | 0 | 13 | 0 |
| B | 0 | 14 | 0 |
| C | 0 | 14 | 0 |
| D | 0 | 14 | 0 |
| Mode SS | |||
|---|---|---|---|
| Quadrant | BADHDUFLAG | Total packets | Discarded packets |
| A | 0 | 258 | 0 |
| B | 0 | 258 | 0 |
| C | 0 | 258 | 0 |
| D | 0 | 258 | 0 |
| Quadrant | Total seconds | Saturated seconds | Saturation percentage |
|---|---|---|---|
| A | 12696 | 107 | 0.842785% |
| B | 12696 | 136 | 1.071204% |
| C | 12696 | 176 | 1.386263% |
| D | 12696 | 1664 | 13.106490% |
Noise dominated data is calculated using 1-second bins in cleaned event files. If a bin has >2000 counts, and if more than 50% of those come from <1% of pixels, then it is considered to be noise-dominated and hence unusable.
| Quadrant | # 1 sec bins | Bins with >0 counts | Bins with >2000 counts | High rate bins dominated by noise | Noise dominated (total time) | Noise dominated (detector-on time) | Marked lightcurve |
|---|---|---|---|---|---|---|---|
| A | 14016 | 12698 | 0 | 0 | 0.00% | 0.00% |  |
| B | 14016 | 12698 | 9 | 9 | 0.06% | 0.07% | 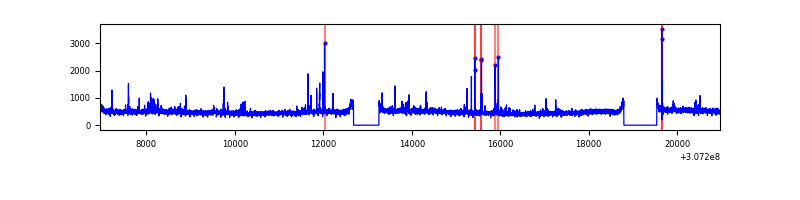 |
| C | 14016 | 12698 | 0 | 0 | 0.00% | 0.00% | 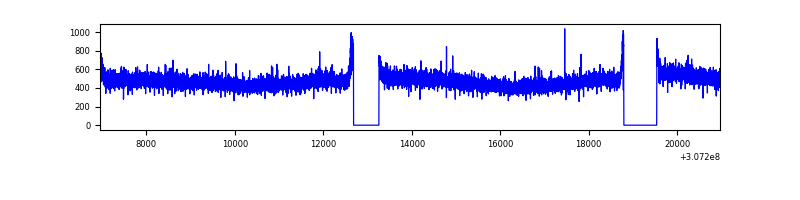 |
| D | 14016 | 12697 | 1346 | 1346 | 9.60% | 10.60% |  |
Top three noisy pixels from each quadrant. If the there are fewer than three noisy pixels in the level2.evt file, extra rows are filled as -1
| Pixel properties | Quadrant properties | ||||||
|---|---|---|---|---|---|---|---|
| Quadrant | DetID | PixID | Counts | Sigma | Mean | Median | Sigma |
| A | 13 | 254 | 17102 | 50.35 | 1539 | 1504 | 309.8 |
| A | 3 | 137 | 13258 | 37.94 | 1539 | 1504 | 309.8 |
| A | 0 | 226 | 13129 | 37.53 | 1539 | 1504 | 309.8 |
| B | 3 | 64 | 70427 | 235.82 | 1529 | 1491 | 292.3 |
| B | 0 | 190 | 68934 | 230.71 | 1529 | 1491 | 292.3 |
| B | 0 | 197 | 44698 | 147.8 | 1529 | 1491 | 292.3 |
| C | 14 | 238 | 230274 | 654.78 | 1480 | 1487 | 349.4 |
| C | 13 | 61 | 10432 | 25.6 | 1480 | 1487 | 349.4 |
| C | 8 | 128 | 4503 | 8.63 | 1480 | 1487 | 349.4 |
| D | 1 | 52 | 6695378 | 19260.79 | 1432 | 1390 | 347.5 |
| D | 7 | 238 | 146824 | 418.46 | 1432 | 1390 | 347.5 |
| D | 2 | 136 | 126481 | 359.93 | 1432 | 1390 | 347.5 |
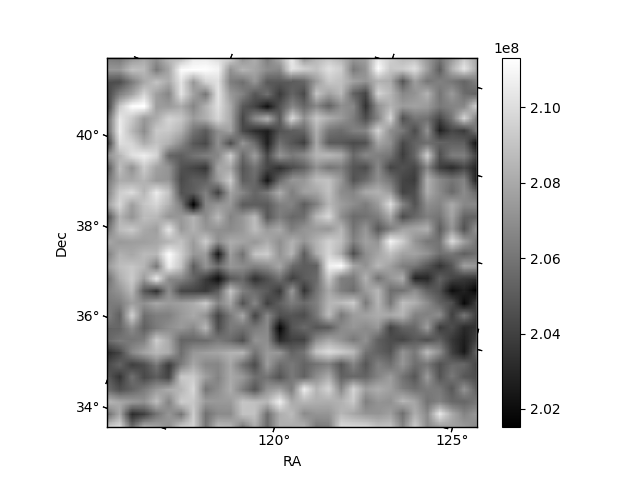
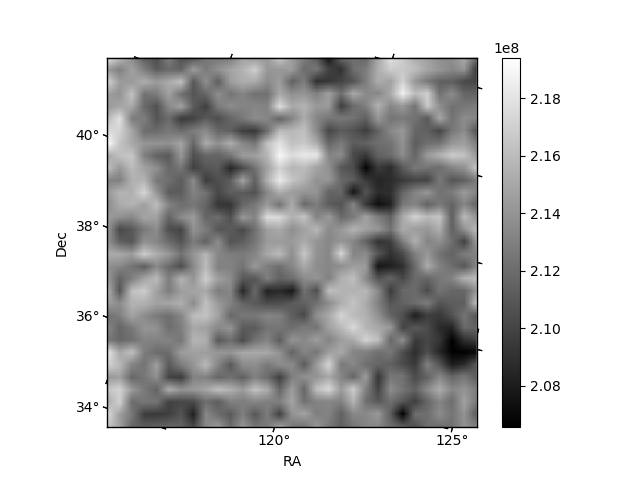
Histogram calculated using DETX and DETY for each event in the final _common_clean file
| Quadrant A | 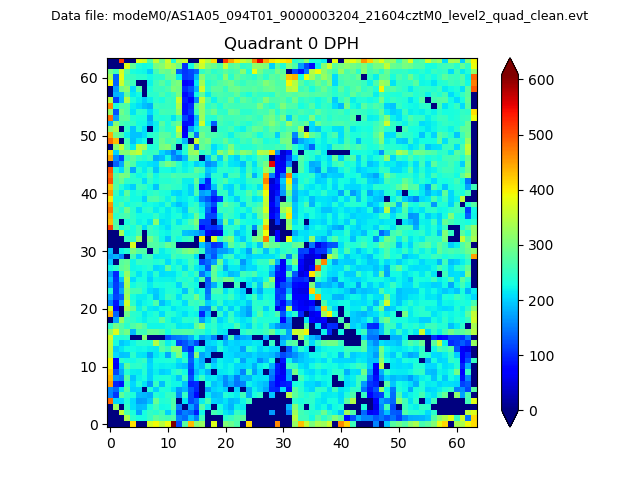 |
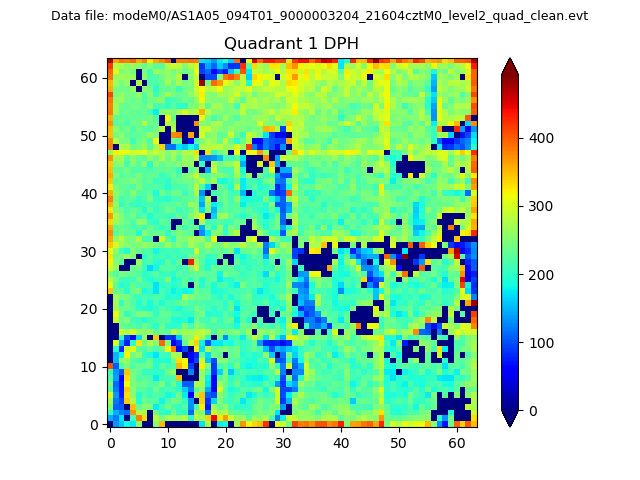 |
Quadrant B |
|---|---|---|---|
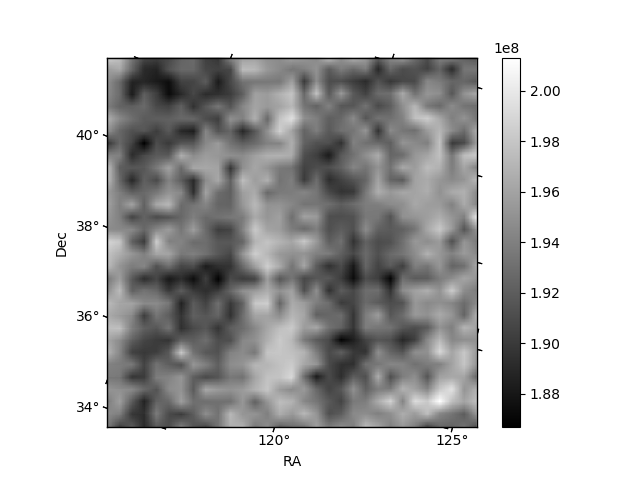
| Quadrant D | 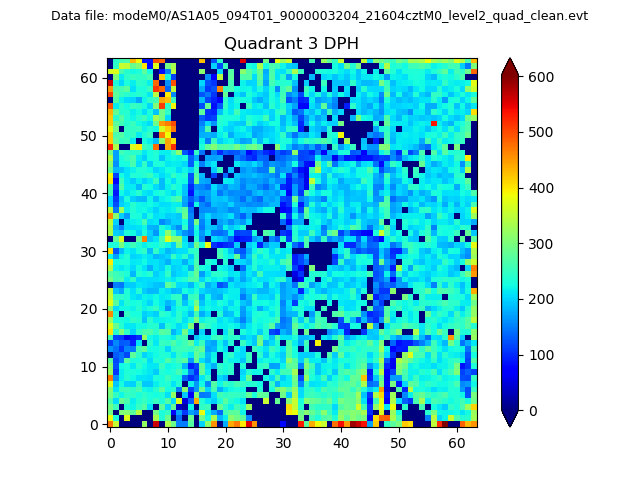 |
 |
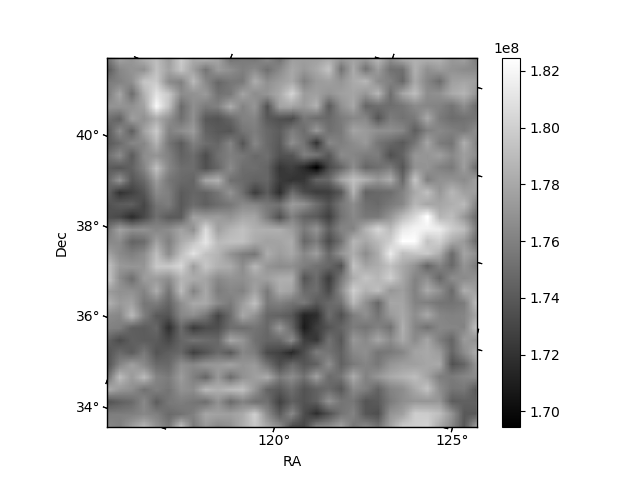
Quadrant C |
| Plot type | Count rate plots | Images |
|---|---|---|
| Comparison with Poisson distribution Blue bars denote a histogram of data divided into 1 sec bins. Red curve is a Poisson curve with rate = median count rate of data. |
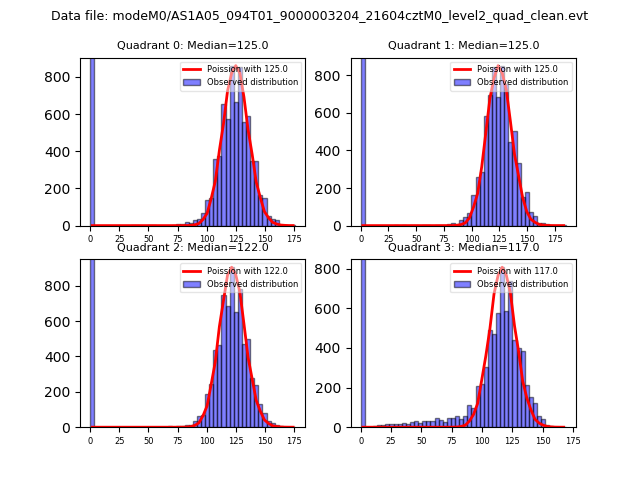 |
 |
| Quadrant-wise count rates Data is divided into 100 sec bins |
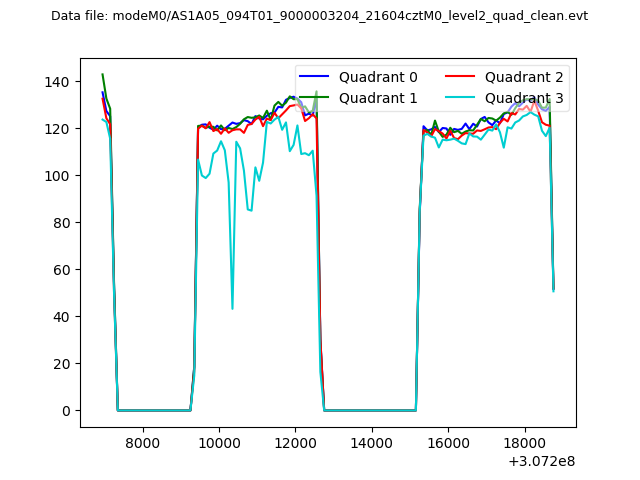 |
|
| Module-wise count rates for Quadrant A Data is divided into 100 sec bins |
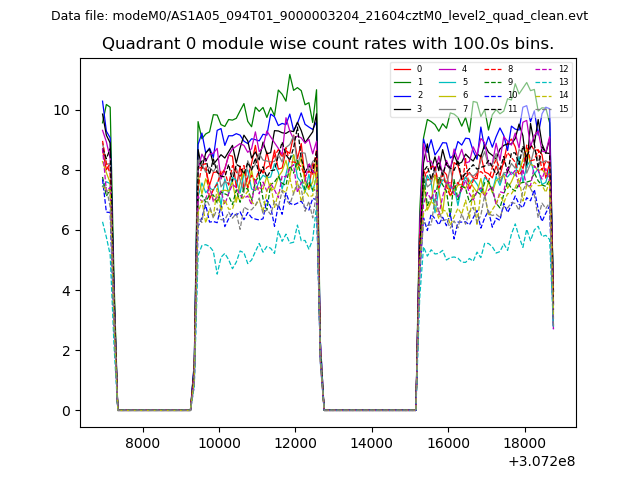 |
 |
| Module-wise count rates for Quadrant B Data is divided into 100 sec bins |
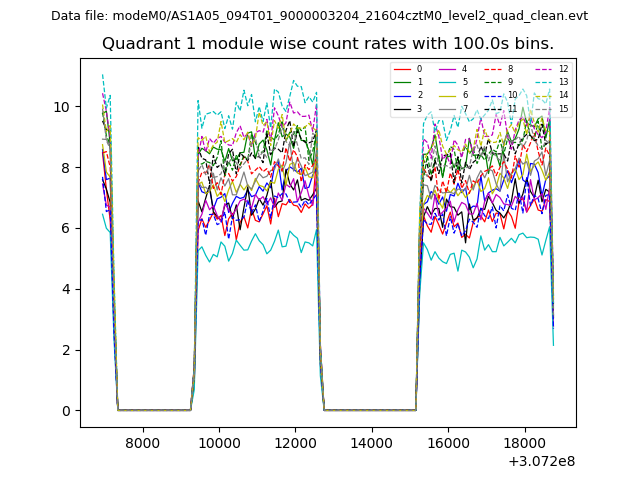 |
 |
| Module-wise count rates for Quadrant C Data is divided into 100 sec bins |
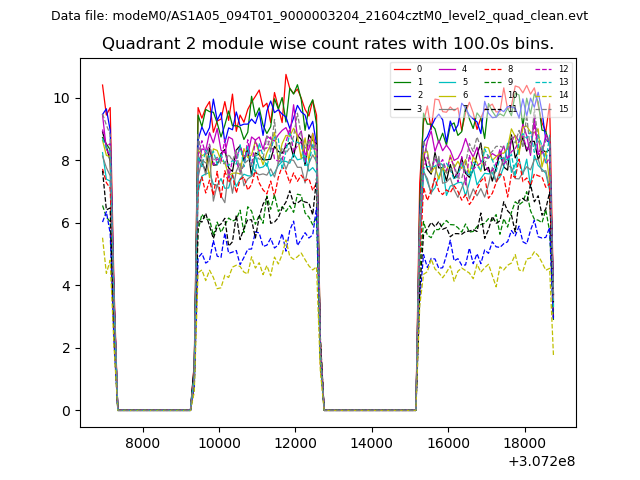 |
 |
| Module-wise count rates for Quadrant D Data is divided into 100 sec bins |
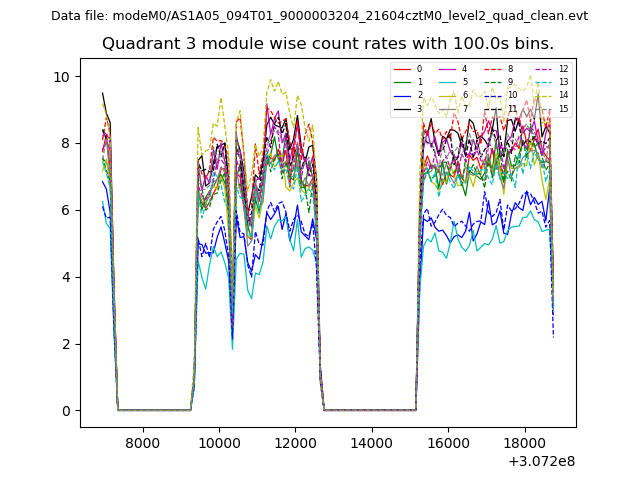 |
 |
| Parameter | Plot |
|---|---|
| CZT HV Monitor | 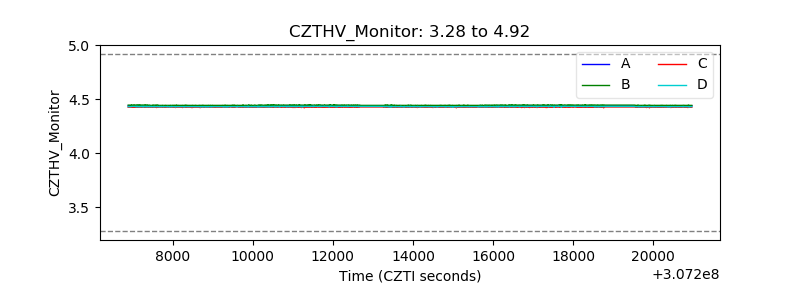 |
| D_VDD | 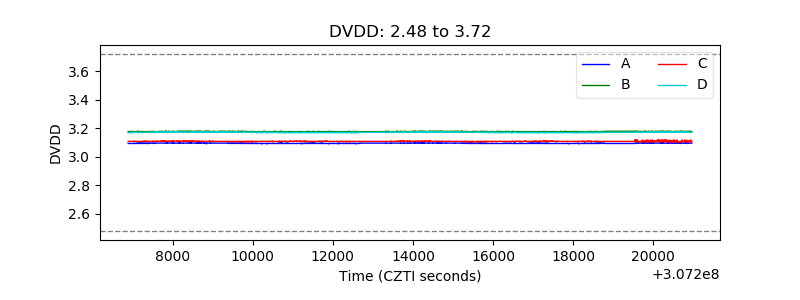 |
| Temperature 1 | 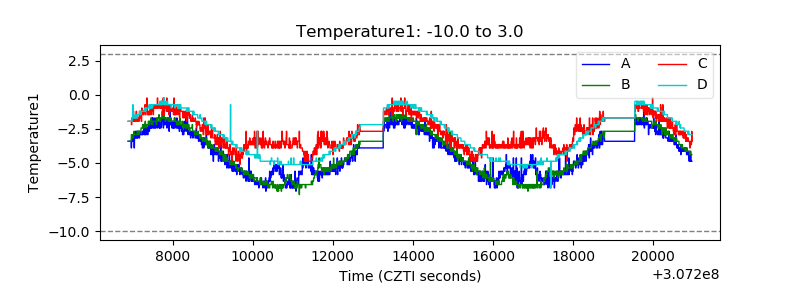 |
| Veto HV Monitor | 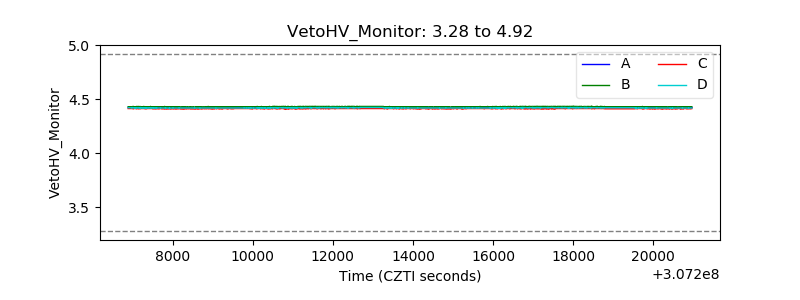 |
| Veto LLD | 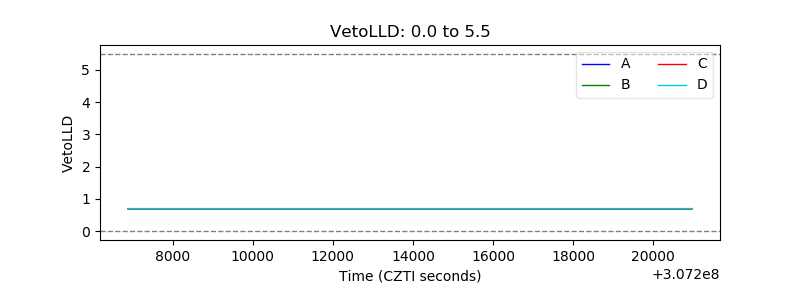 |
| Alpha Counter | 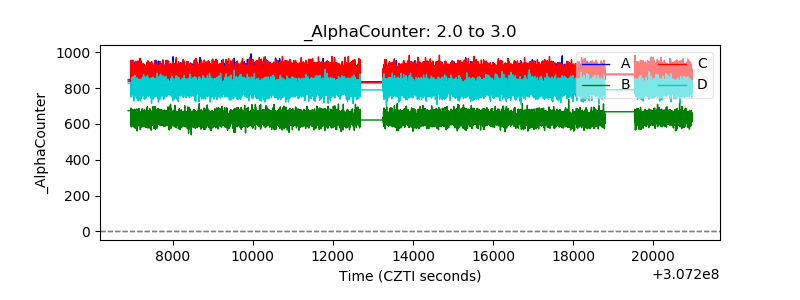 |
| _CPM_Rate | 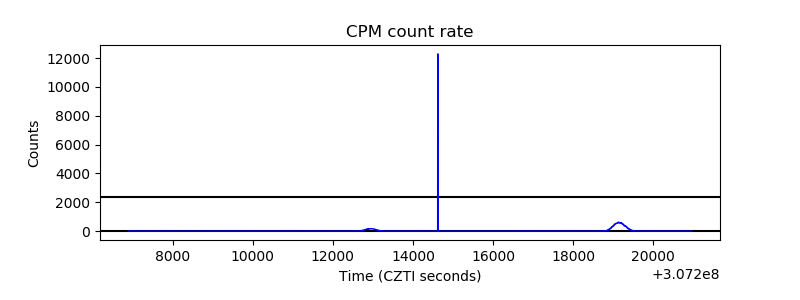 |
| CZT Counter |  |
| +2.5 Volts monitor |  |
| +5 Volts monitor |  |
| _ROLL_ROT | 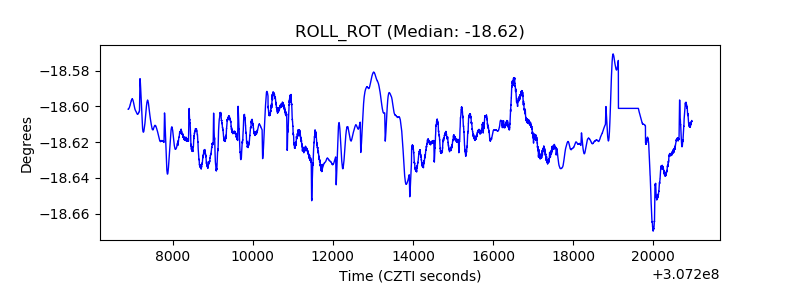 |
| _Roll_DEC | 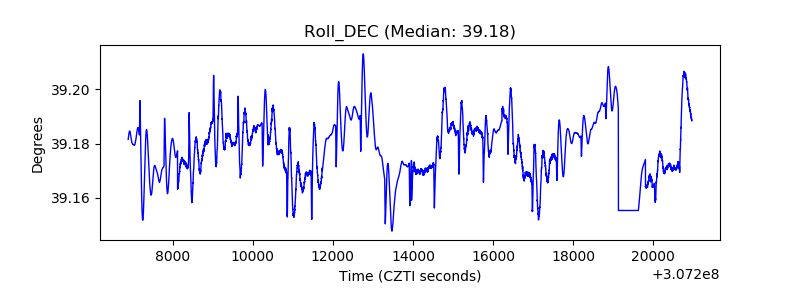 |
| _Roll_RA | 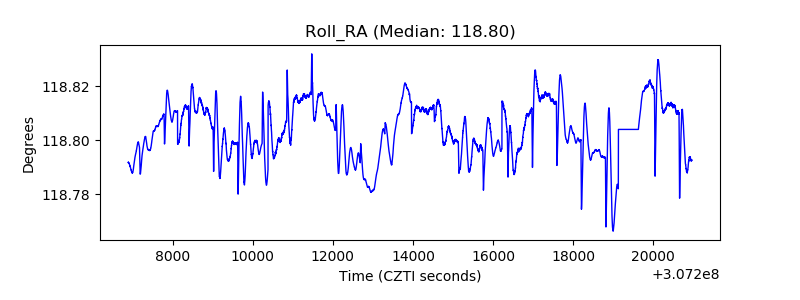 |
| Veto Counter | 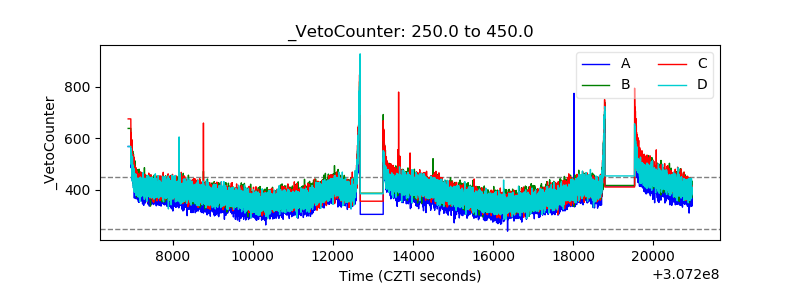 |