| Param | Original file | Final file |
|---|---|---|
| Filename | modeM0/AS1A05_094T01_9000003204_21606cztM0_level2.evt | modeM0/AS1A05_094T01_9000003204_21606cztM0_level2_quad_clean.evt |
| Size (bytes) | 486,054,720 | 88,200,000 |
| Size | 463.5 MB | 84.1 MB |
| Events in quadrant A | 3,204,765 | 558,596 |
| Events in quadrant B | 3,325,758 | 566,110 |
| Events in quadrant C | 3,250,648 | 555,101 |
| Events in quadrant D | 4,491,258 | 531,264 |
| Mode M0 | |||
|---|---|---|---|
| Quadrant | BADHDUFLAG | Total packets | Discarded packets |
| A | 0 | 13877 | 2 |
| B | 0 | 14225 | 2 |
| C | 0 | 14037 | 2 |
| D | 0 | 17924 | 2 |
| Mode M9 | |||
|---|---|---|---|
| Quadrant | BADHDUFLAG | Total packets | Discarded packets |
| A | 0 | 18 | 0 |
| B | 0 | 19 | 0 |
| C | 0 | 19 | 0 |
| D | 0 | 19 | 0 |
| Mode SS | |||
|---|---|---|---|
| Quadrant | BADHDUFLAG | Total packets | Discarded packets |
| A | 0 | 134 | 0 |
| B | 0 | 134 | 0 |
| C | 0 | 134 | 0 |
| D | 0 | 134 | 0 |
| Quadrant | Total seconds | Saturated seconds | Saturation percentage |
|---|---|---|---|
| A | 6594 | 59 | 0.894753% |
| B | 6594 | 63 | 0.955414% |
| C | 6594 | 92 | 1.395208% |
| D | 6594 | 275 | 4.170458% |
Noise dominated data is calculated using 1-second bins in cleaned event files. If a bin has >2000 counts, and if more than 50% of those come from <1% of pixels, then it is considered to be noise-dominated and hence unusable.
| Quadrant | # 1 sec bins | Bins with >0 counts | Bins with >2000 counts | High rate bins dominated by noise | Noise dominated (total time) | Noise dominated (detector-on time) | Marked lightcurve |
|---|---|---|---|---|---|---|---|
| A | 7669 | 6595 | 3 | 3 | 0.04% | 0.05% | 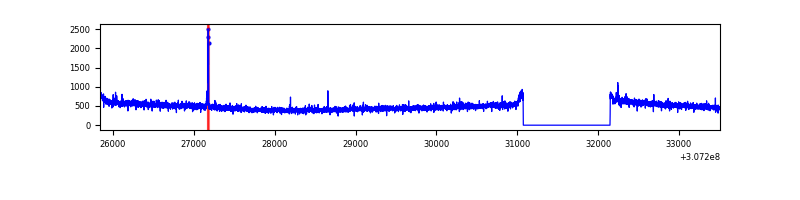 |
| B | 7669 | 6595 | 3 | 3 | 0.04% | 0.05% | 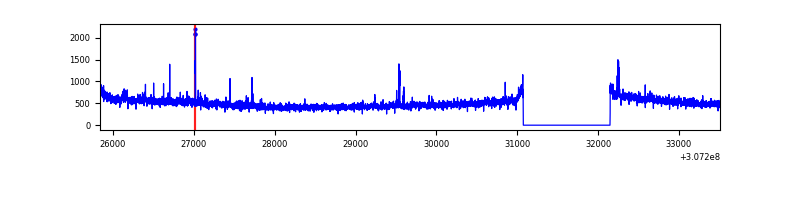 |
| C | 7669 | 6595 | 0 | 0 | 0.00% | 0.00% | 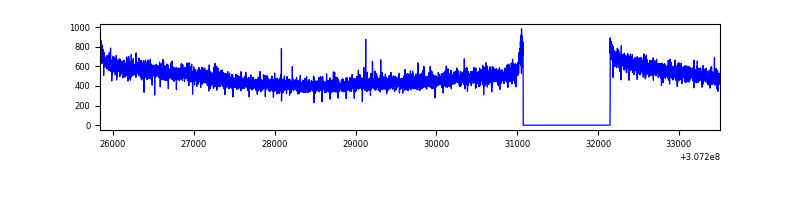 |
| D | 7669 | 6595 | 171 | 171 | 2.23% | 2.59% | 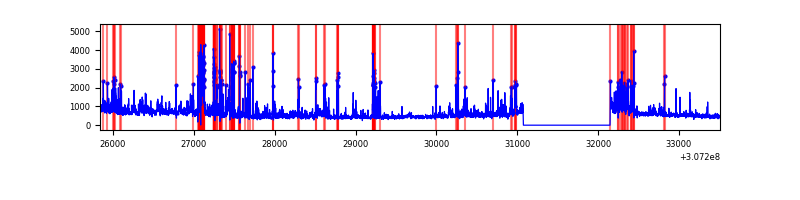 |
Top three noisy pixels from each quadrant. If the there are fewer than three noisy pixels in the level2.evt file, extra rows are filled as -1
| Pixel properties | Quadrant properties | ||||||
|---|---|---|---|---|---|---|---|
| Quadrant | DetID | PixID | Counts | Sigma | Mean | Median | Sigma |
| A | 15 | 174 | 23496 | 137.45 | 823 | 806 | 165.1 |
| A | 13 | 254 | 9510 | 52.73 | 823 | 806 | 165.1 |
| A | 0 | 226 | 7237 | 38.96 | 823 | 806 | 165.1 |
| B | 3 | 64 | 31400 | 195.55 | 825 | 802 | 156.5 |
| B | 0 | 190 | 22146 | 136.41 | 825 | 802 | 156.5 |
| B | 0 | 229 | 19082 | 116.83 | 825 | 802 | 156.5 |
| C | 14 | 238 | 124300 | 656.34 | 801 | 808 | 188.2 |
| C | 13 | 61 | 5546 | 25.18 | 801 | 808 | 188.2 |
| C | 7 | 221 | 2898 | 11.11 | 801 | 808 | 188.2 |
| D | 1 | 52 | 810268 | 4196.77 | 794 | 772 | 192.9 |
| D | 5 | 222 | 367230 | 1899.87 | 794 | 772 | 192.9 |
| D | 14 | 35 | 95602 | 491.64 | 794 | 772 | 192.9 |
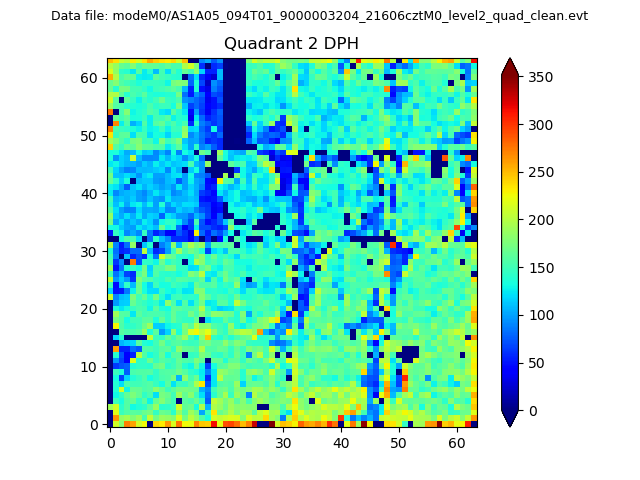
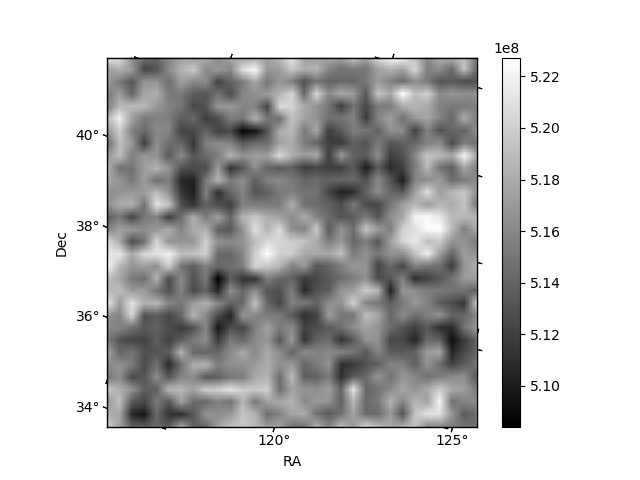
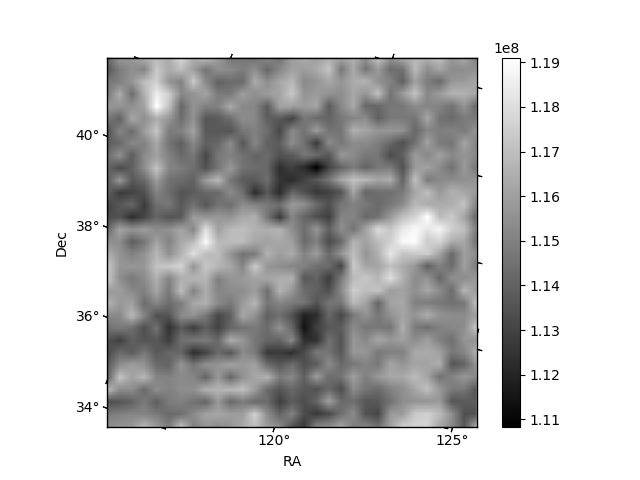
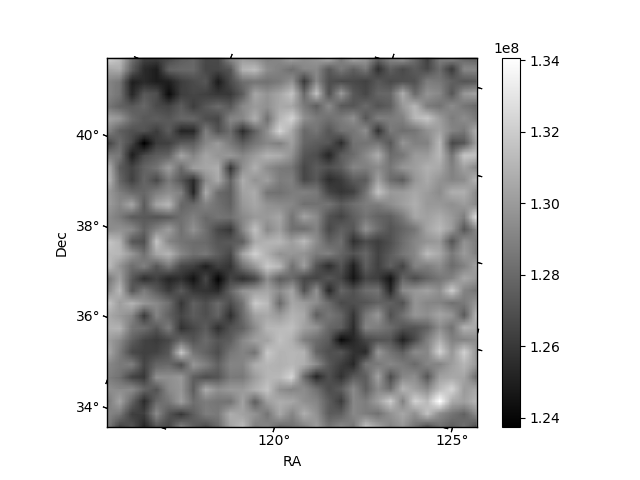
Histogram calculated using DETX and DETY for each event in the final _common_clean file
| Quadrant A | 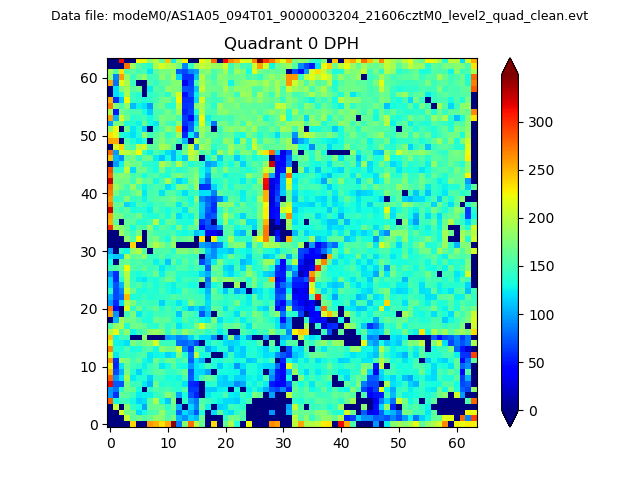 |
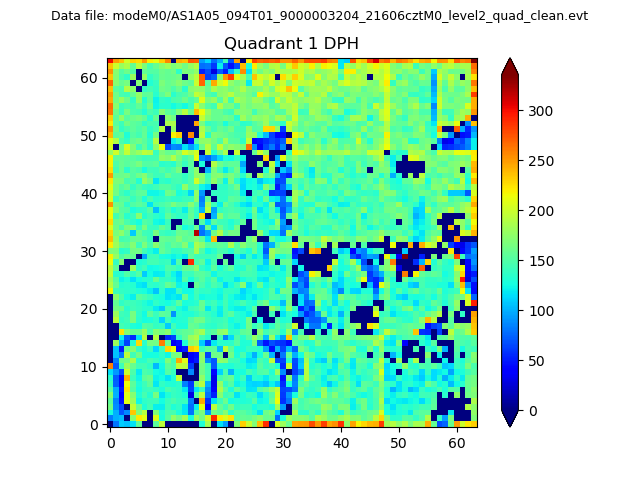 |
Quadrant B |
|---|---|---|---|
| Quadrant D | 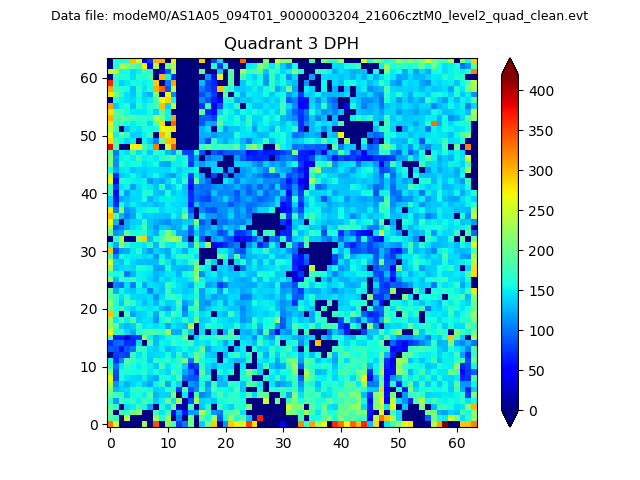 |
 |
Quadrant C |
| Plot type | Count rate plots | Images |
|---|---|---|
| Comparison with Poisson distribution Blue bars denote a histogram of data divided into 1 sec bins. Red curve is a Poisson curve with rate = median count rate of data. |
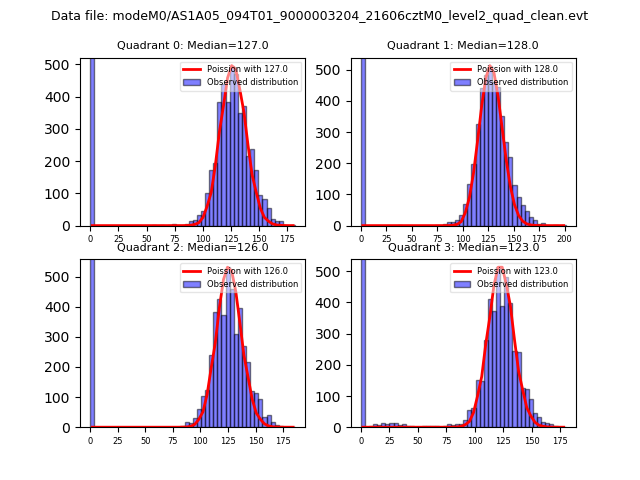 |
 |
| Quadrant-wise count rates Data is divided into 100 sec bins |
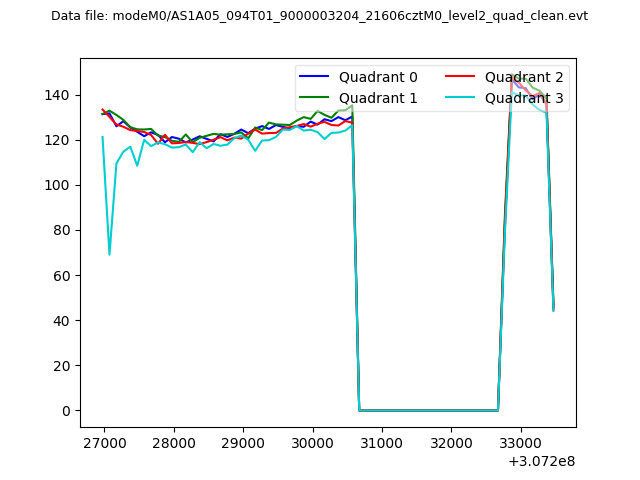 |
|
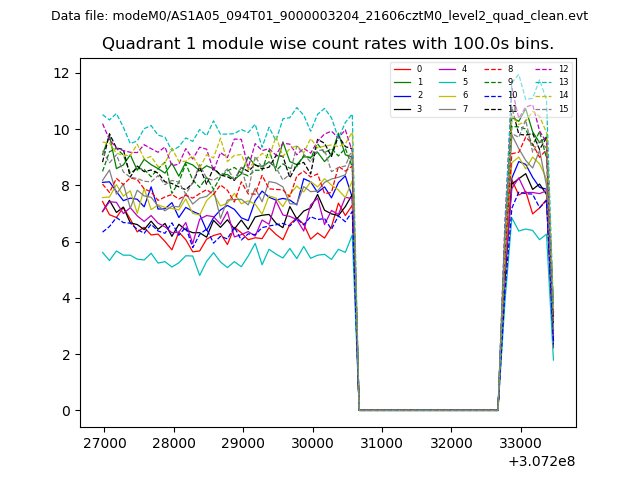
| Module-wise count rates for Quadrant A Data is divided into 100 sec bins |
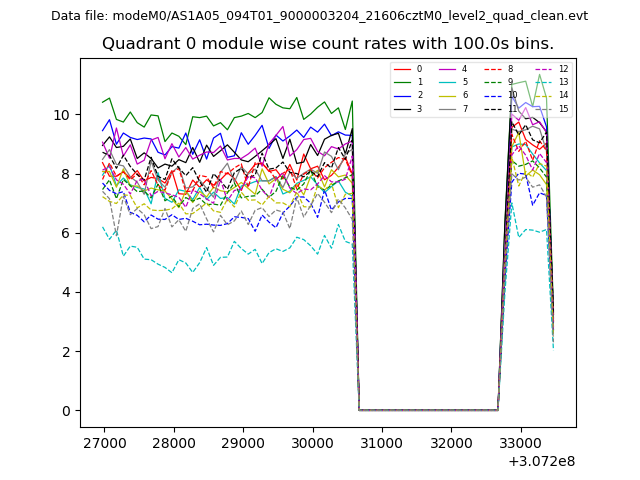 |
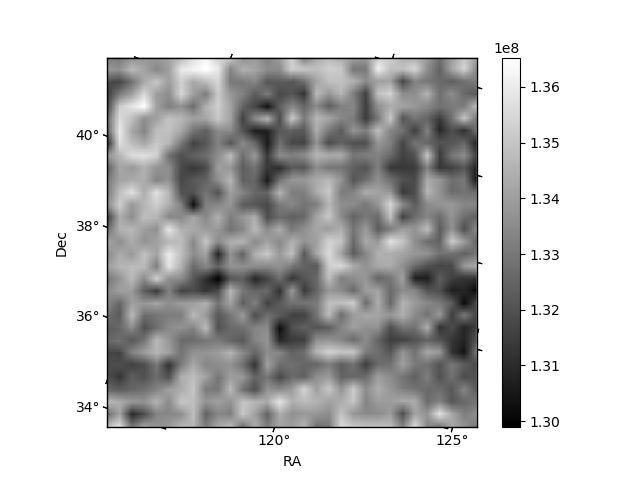 |
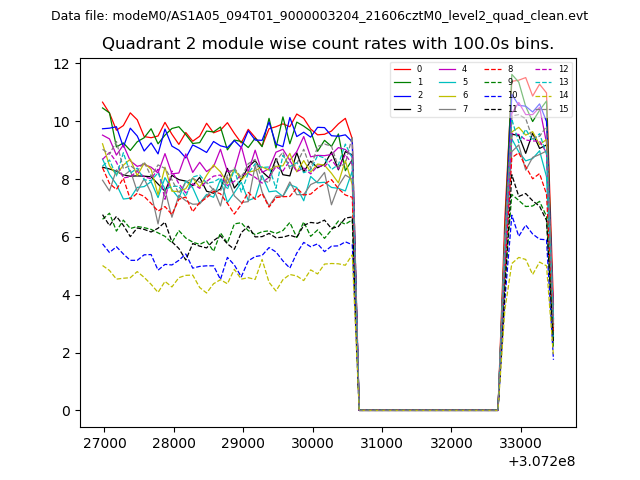
| Module-wise count rates for Quadrant B Data is divided into 100 sec bins |
 |
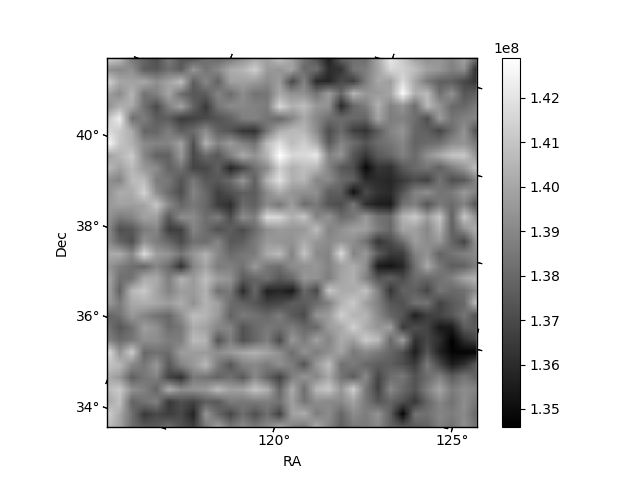 |
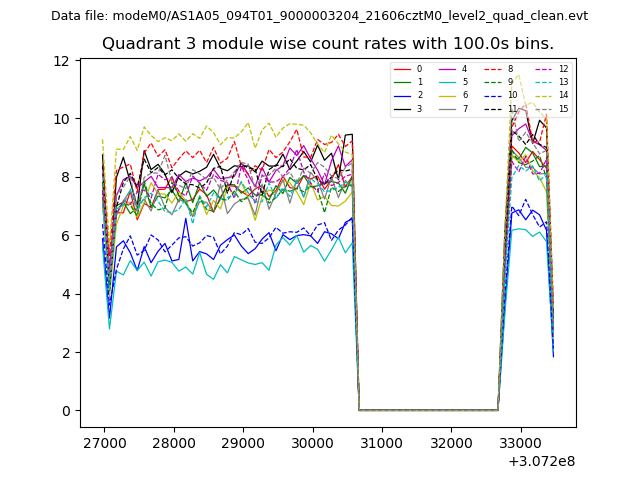
| Module-wise count rates for Quadrant C Data is divided into 100 sec bins |
 |
 |
| Module-wise count rates for Quadrant D Data is divided into 100 sec bins |
 |
 |
| Parameter | Plot |
|---|---|
| CZT HV Monitor | 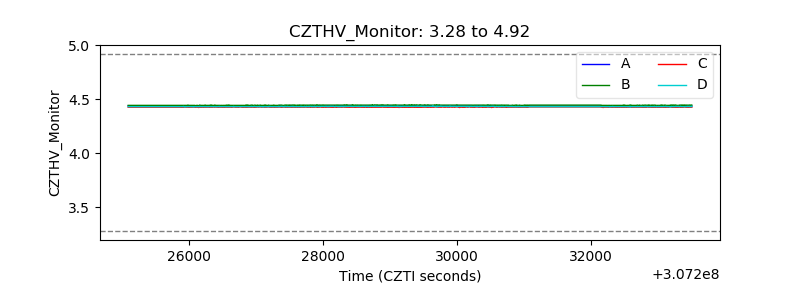 |
| D_VDD | 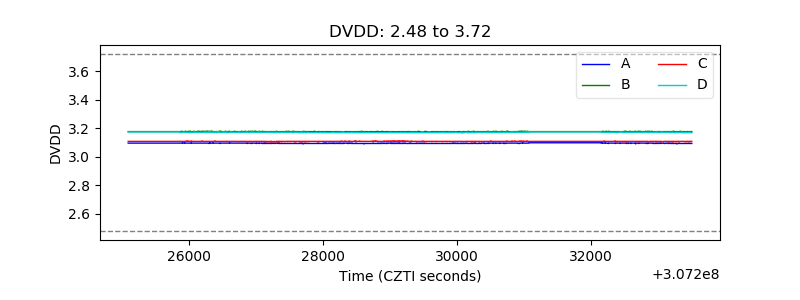 |
| Temperature 1 | 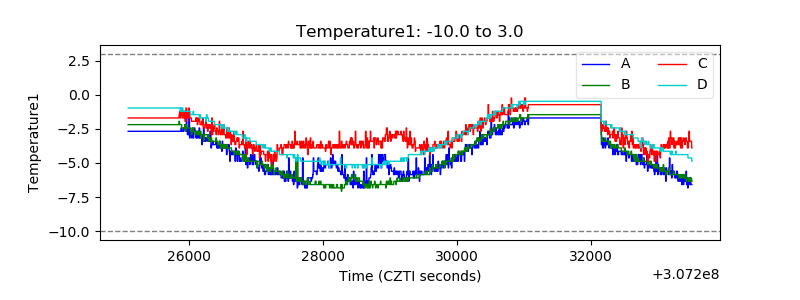 |
| Veto HV Monitor | 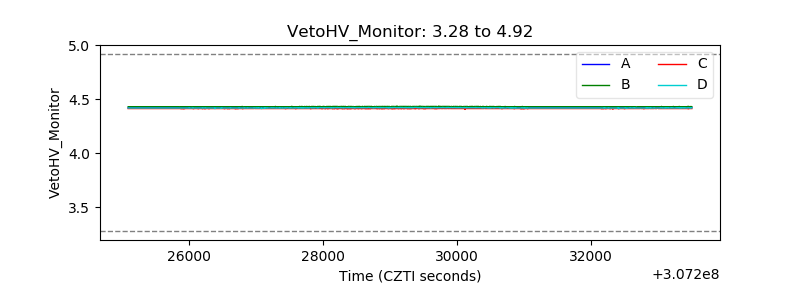 |
| Veto LLD | 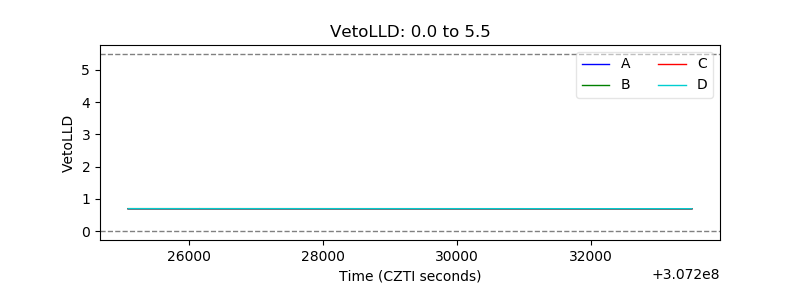 |
| Alpha Counter | 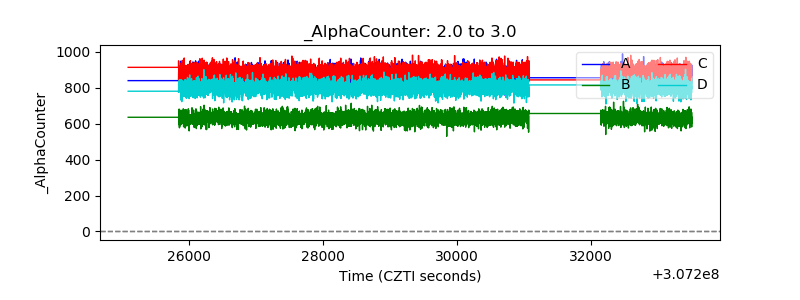 |
| _CPM_Rate | 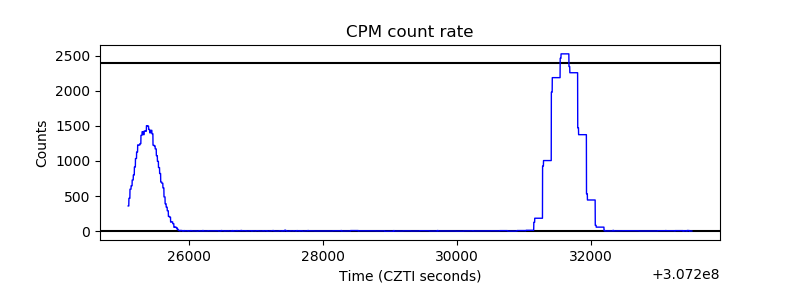 |
| CZT Counter | 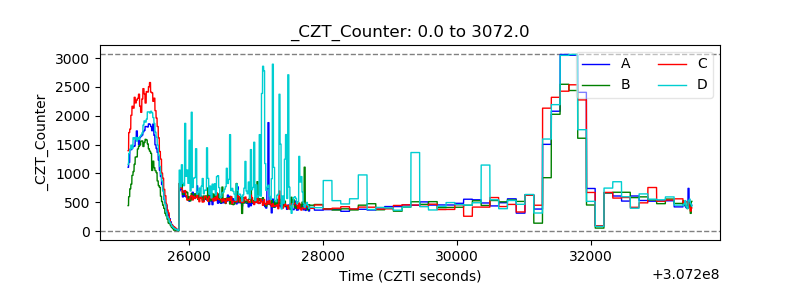 |
| +2.5 Volts monitor |  |
| +5 Volts monitor |  |
| _ROLL_ROT | 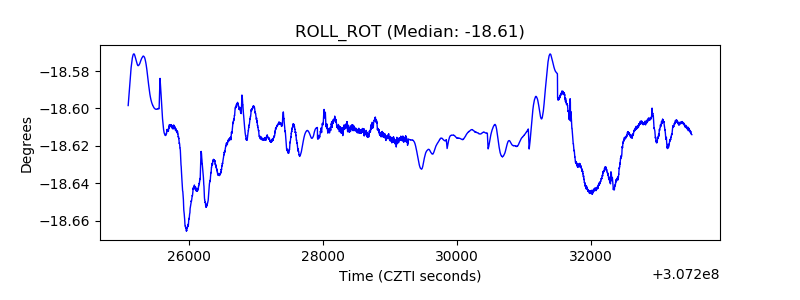 |
| _Roll_DEC | 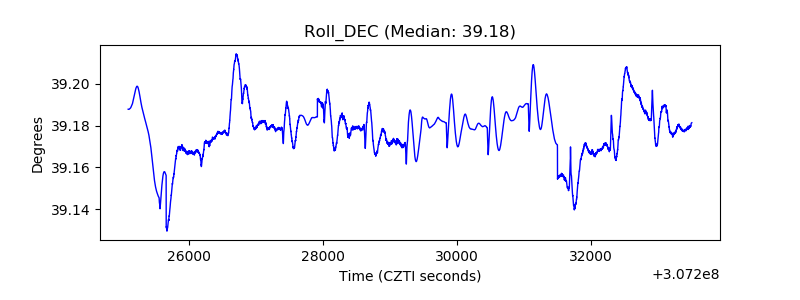 |
| _Roll_RA | 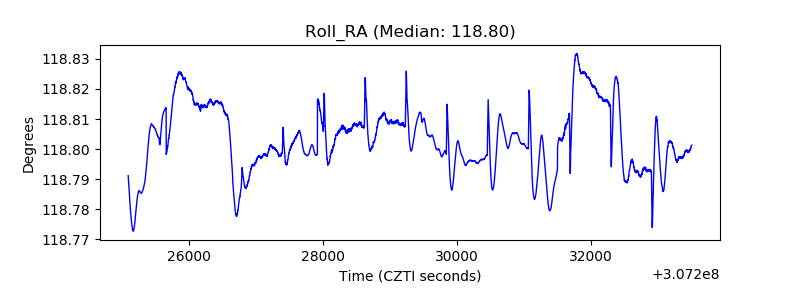 |
| Veto Counter | 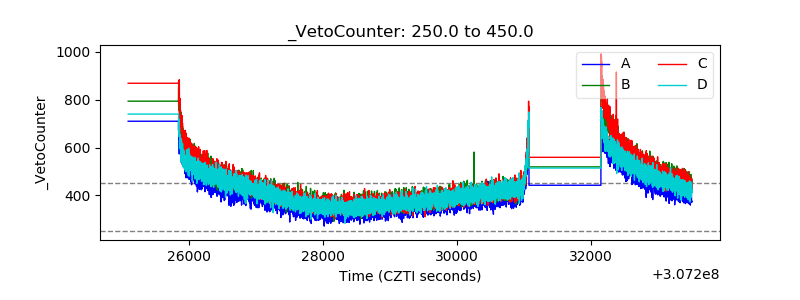 |